
Heavy to excessive rainfall may bring flooding to parts of Arizona, New Mexico, Florida, North Carolina, and Virginia today. Recently burned areas will be particularly vulnerable to flash flooding. Gusty winds and low humidity will bring elevated to critical fire weather conditions to parts of the Northwest U.S. and central Alaska today. Read More >
While many significant weather events affected central/northeastern South Dakota and west central Minnesota in 2018, below is a listing of the top 10 events of the year in terms of scope, severity of impacts, and/or rarity. In chronological order:
March 5-6th Winter Storm
This potent spring system brought a wide range of precipitation types, including rain, hail, sleet, and thundersnow! As much as 18 inches of snow fell across the area, worst-hit being north central and east central South Dakota. Wind gusts up to 50 mph also resulted in blizzard conditions for some. More information can be found here: https://www.weather.gov/abr/20180305-6_WinterStorm
Photo courtesy of Zach Nelson, RiverFront Broadcasting
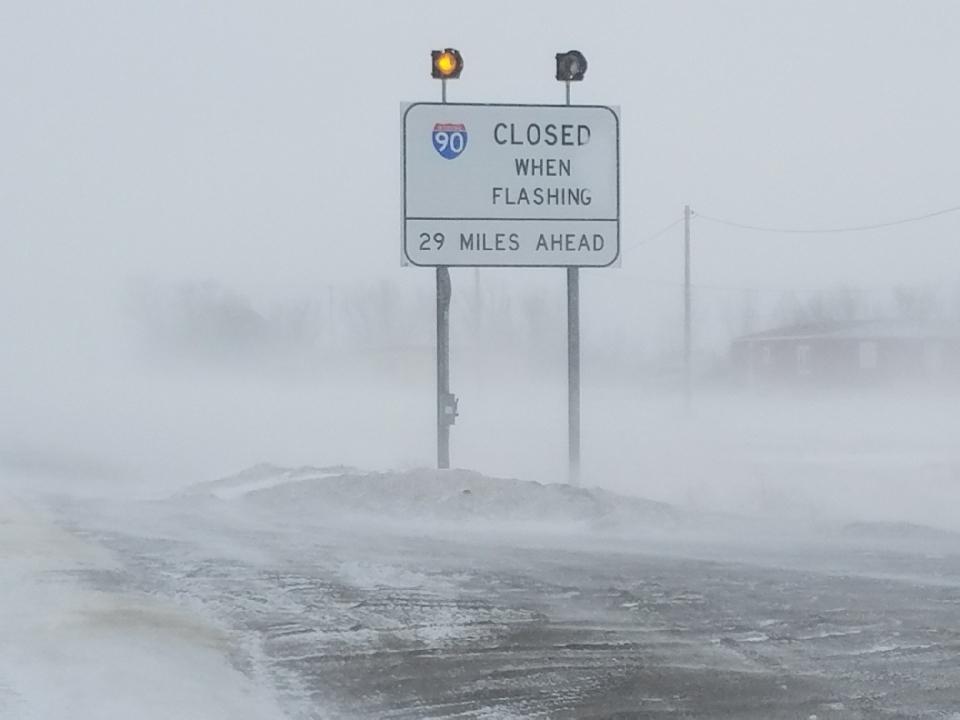
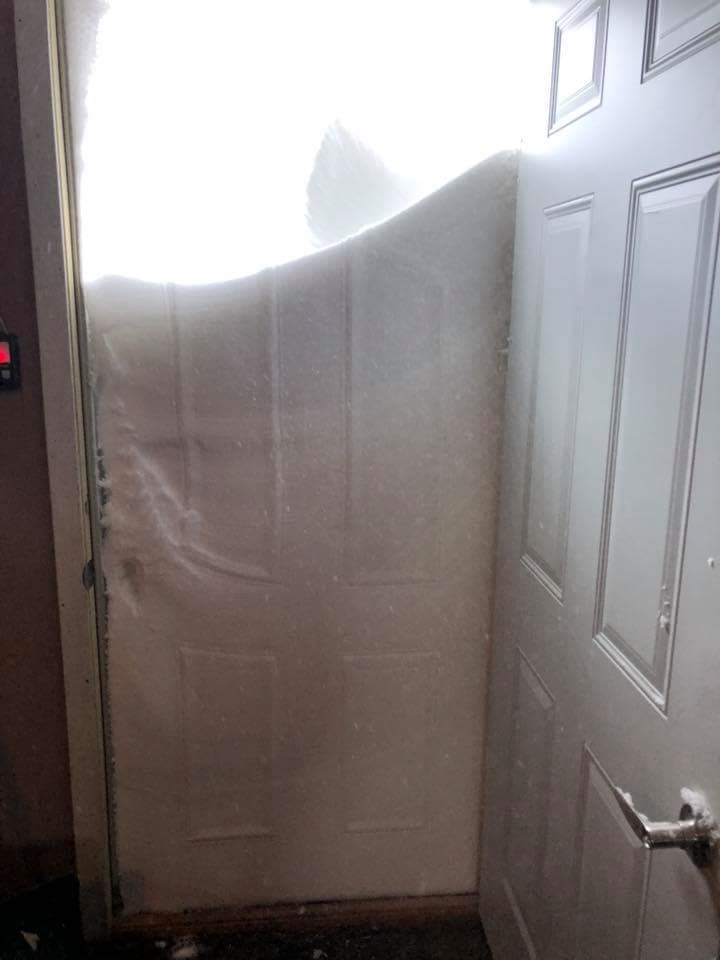
April 13-14th Blizzard
This historic spring system produced widespread snowfall totals of one to two feet across the southern half of South Dakota and southern Minnesota, in addition to 50 mph wind gusts and widespread blizzard conditions. More information can be found here: https://www.weather.gov/abr/April13-14BlizzardSummary. This event capped off a very lob-sided snow season, as very little snow fell from Nov-Jan while record amounts fell from Feb-Apr to end the season with near or above average totals.
Photo courtesy of LyRanda Hatlestad-Fuoss (relayed via Brent Nathaniel), taken 12 miles north of Draper, SD on the morning of April 14th
May 17th Extreme Rainfall
Training thunderstorms led to extreme rainfall reports including 13.15” four miles northwest of Long Lake, SD. This heavy rainfall contributed to the failure of the Hiddenwood Lake Dam about 4 miles north of Selby, SD on the morning of May 18th. Several area roadways were submerged as a result. More information can be found here: https://www.weather.gov/abr/2018May17_18_severe_flooding
Photo courtesy of the Walworth County Sheriff, of the failed Hiddenwood Lake Dam

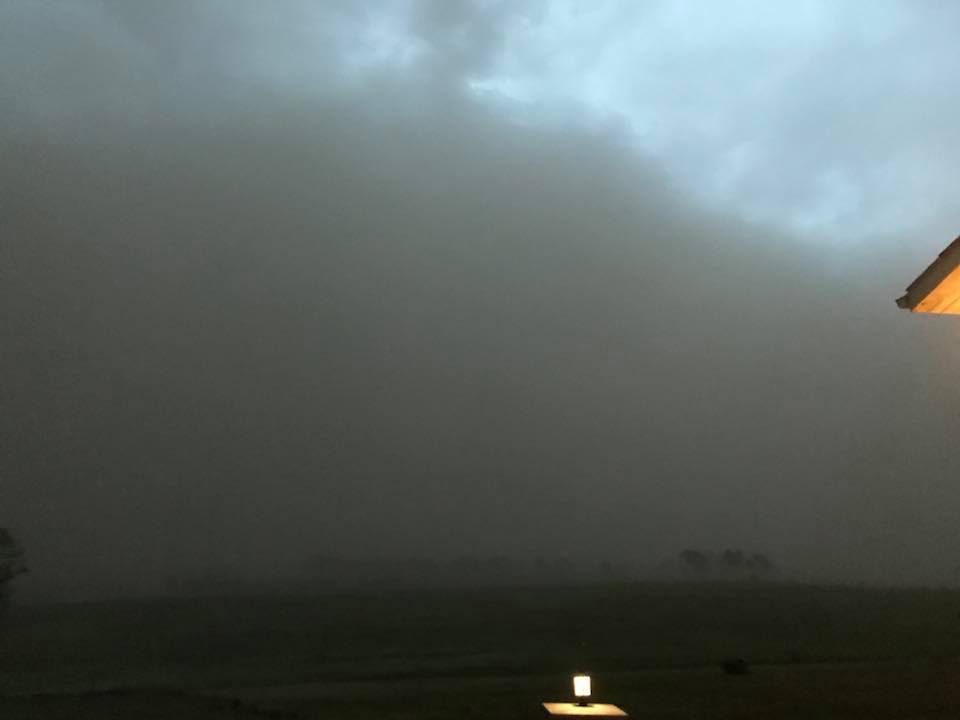
June 1st Dust Storm
On the heels of a dry May, high winds of up to 80 mph in association with severe thunderstorms produced a dust storm across portions of the James Valley. Visibilities were greatly reduced during the evening hours. More information can be found here: https://www.weather.gov/abr/2018June1_Severe_Dust. The dry weather that allowed high winds to loft dust continued through October. Severe drought conditions plagued area farms for the second consecutive summer across portions of the James Valley. As of January 1st, 2019, Aberdeen has 2 year precipitation deficit of 10.28”. Meanwhile only 150 miles away and over the same period, Sioux Falls has recorded a 2 year precipitation surplus of 11.63”.
Photo courtesy of Maggie and Ryan Jett, taken 5 miles northwest of Aberdeen
June 5-6th Straight-Line Windstorm
A long-lived line of severe thunderstorms produced widespread wind damage from Corson/Dewey Counties to Grant County during the evening of June 5th into the morning of June 6th. A measured wind gust of 100 mph was recorded near Lowry. More information can be found here: https://www.weather.gov/abr/20180605WindAndHail
Photo courtesy of the South Dakota Highway Patrol, taken north of Faulkton

June 27th and 29th Hail Scar Storms
Two separate long-track and damaging hailstorms affected Dewey, Sully, Hughes and Stanley counties on the early morning of 27th and on the evening of the 29th. “Hail scars” were visible via satellite in the days that followed, highlighting large swaths of pulverized cropland and other vegetation. More information can be found here: https://www.weather.gov/abr/June27and29HailScarStorms
Photo taken anonymously near Blunt, after the 27th storm

July 3-4th Straight-Line Windstorm
Significantly severe 96 mph wind gusts were measured at Mobridge and ~10 miles west-northwest of Long Lake as a line of severe thunderstorms raced from Rapid City to Eagle Butte to Forbes, ND. Extensive damage, including structural damage, resulted in certain cases. More information can be found here: https://www.weather.gov/abr/July2-4SevereStorms
Photo courtesy of Justin Nichols, taken in Eagle Butte

August 23rd, 26th and 27th Extreme Hail
This season’s secondary severe weather season began on the 23rd when Hyde county observed two tornadoes, and a 3” diameter hailstone fell just northwest of Hoven (more information here: https://www.weather.gov/abr/SevereWeatherSummary8-23-18). 4” diameter hail then fell in Blunt on the 26th, and 3.5” diameter hail fell near Presho on the 27th. On average, a 3” hailstone is recorded about once every other year and a 4” hailstone about once every three years across the NWS Aberdeen forecast area (https://www.weather.gov/images/otx/content/pages/cwa.png).
Photo left courtesy of Derek Rausch, taken 4 miles northwest of Hoven around 6 pm on the 23rd
Photo right courtesy of Twila Larson Reding, taken in Blunt around 8:15 pm on the 26th

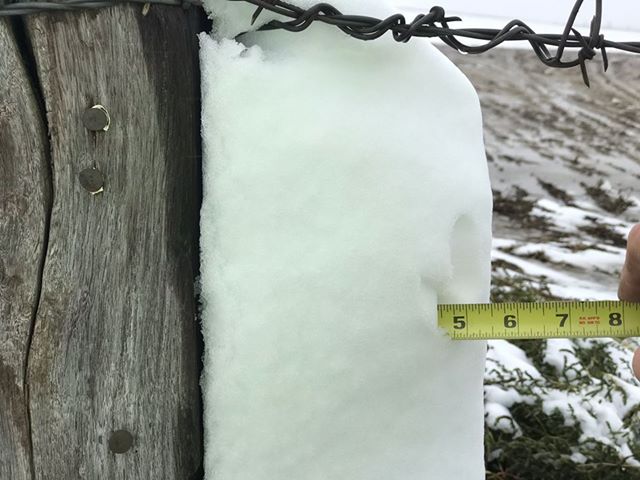
October 9-10th Snowfall
A rare and particular combination of persistent wet snow and stiff winds from the 9th into the 10th downed power lines across parts of Spink, Brown and Marshall Counties. The result was the loss of power to thousands of customers, 400+ of which overnight. Localized areas received as much as 6-9” of snow in Brown and Marshall Counties. This was also a very early snowfall for the area, and was in fact the second earliest measurable snowfall on record in Sisseton (3.4” was recorded).
Photo courtesy of Mike Scott, taken near Aberdeen on the morning of the 10th
December 26-28th Blizzard
Moderate to heavy snow with little wind on the evening of the 26th combined with moderate to heavy snow and 50 mph wind gusts on the 27th to produce blizzard conditions. Impacts continued into the 28th before winds subsided. Storm total snowfall amounts generally ranged from 6-12” across the area. More information can be found here: https://www.weather.gov/abr/December26th-28thWinterStormandBlizzard
Photo taken by a NWS employee in Aberdeen

Honorable mentions:
1.) An extreme heavy rainfall event flooded portions of northern Hand and southern Spink counties on July 2-3rd. More information can be found here: https://www.weather.gov/abr/July2-4SevereStorms
2.) Freezing rain on the evening of the 30th of December transitioned to snow on the morning of the 31st across northeastern South Dakota and west central Minnesota. High winds then resulted in ground blizzard conditions through the morning and afternoon hours.
2018 Climate Summary
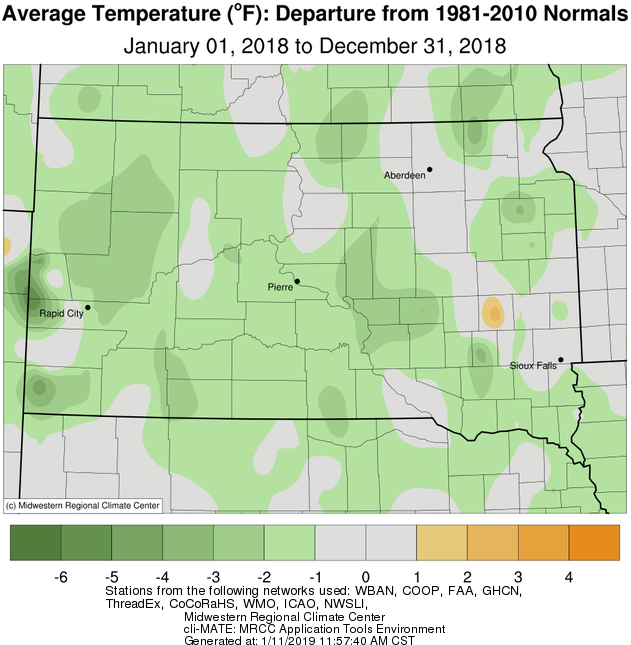
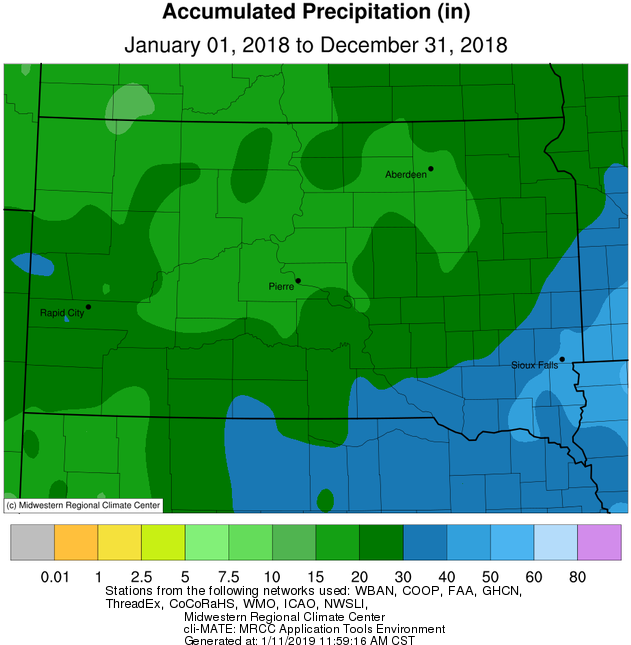
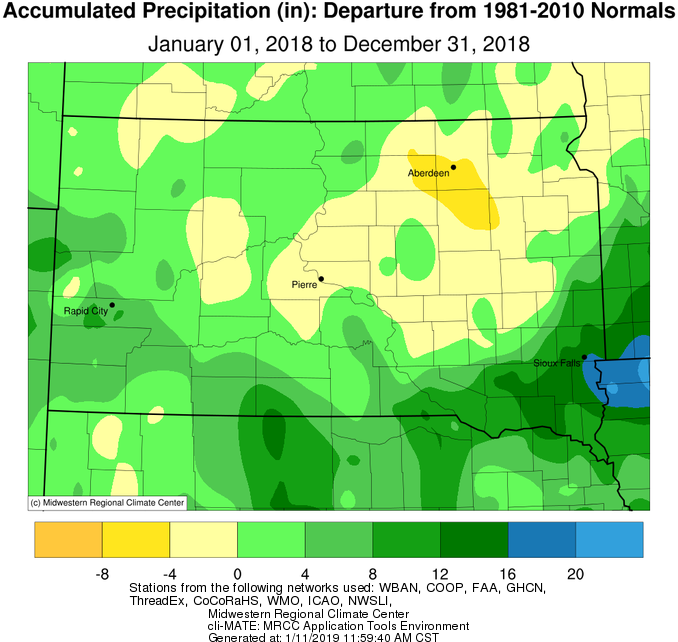
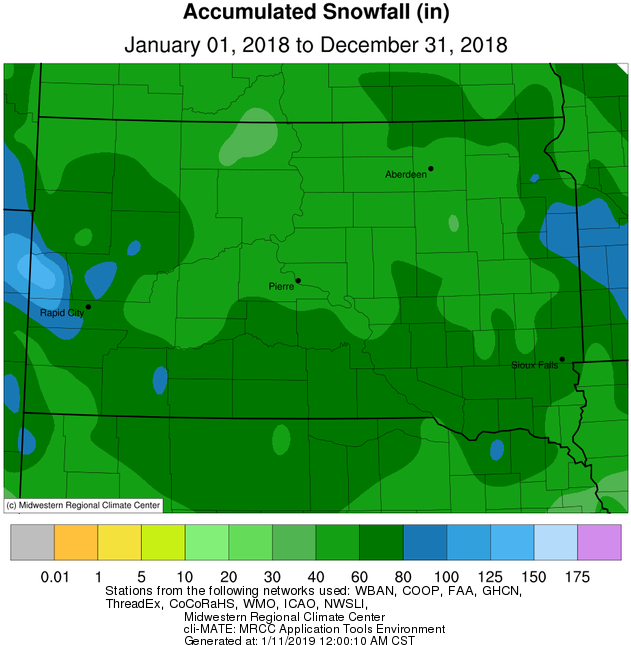
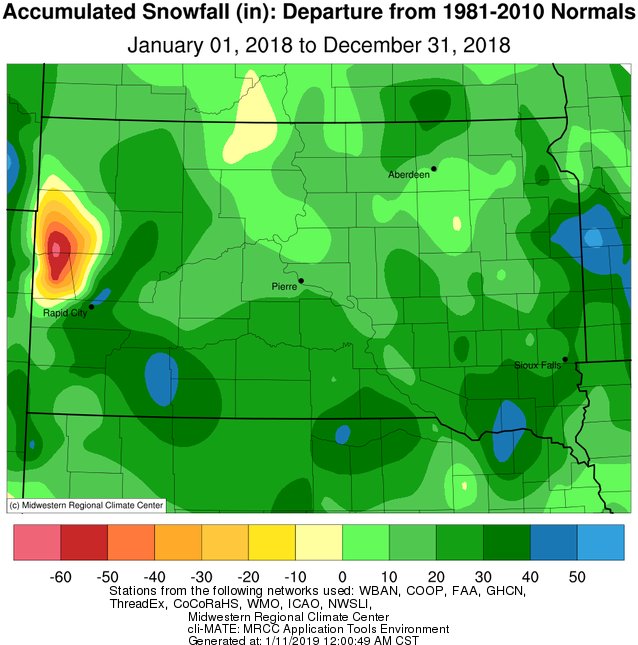
2018 finished between average and slightly below average by as much as 2.5 degrees temperature-wise across the area. Mobridge’s average yearly temperature was 44.9 degrees, which is exactly average. Most everyone ended the year above average for snowfall, some significantly above, however overall precipitation was more split. Portions of the James River Valley ended lower than 4” below average, while isolated instances of 4” above normal precipitation were also observed. Watertown’s total precipitation in 2018 was 22.08”, which is exactly average. The combination of an exceptionally snowy late winter and spring in 2018 and an above average snowfall in December resulted in snowfall totals for the year up to 40” above normal, particularly across far east-central South Dakota (note, this is yearly snowfall, not seasonal snowfall). Watertown set a record with 65.9” of snow, beating 2008’s 65.1”, Sisseton came in second place with 70.8” (72.2” in 2009), Kennebec 5th place with 65.6”, Mobridge 7th with 51.8”, and Pierre 8th with 52.9”. Kennebec also recorded their 4th wettest year on record, with 26.03”. This was thanks in large part to numerous happenstance warm season thunderstorms rather than a persistent wet large-scale pattern. The warmest temperature of the year in the NWS Aberdeen’s forecast area was 106 degrees at a COOP station 17 miles WSW of Fort Pierre on August 11th, and the coldest temperature was -44 degrees at the same location on January 2nd. That’s a 150 degree temperature swing!
|
2018 CLIMATE REVIEW |
||||
|
Temperature Data |
Aberdeen |
Sisseton |
Wheaton |
Watertown |
|
Warmest Temperature/Date |
101° / May 27, June 5 |
97° / May 27 |
94° / May 26, Sept 16 |
96° / May 27 |
|
Coldest Temperature/Date |
-32° / Jan 1 |
-22° / Dec 29 |
-25° / Jan 1 |
-25° / Jan 1 |
|
Average Yearly High/Departure from Normal |
55.0° / +0.4 |
53.0° / -1.5 |
52.4° / -3.0 |
51.7° / -1.9 |
|
Average Yearly Low/Departure from Normal |
30.8° / -0.7 |
32.6° / -0.4 |
33.2° / +0.2 |
32.1° / -0.4 |
|
Yearly Average/Departure from Normal |
42.9° / -0.1 |
42.8° / -0.9 |
42.8° / -1.5 |
41.9° / -1.1 |
|
Precipitation/Wind Data |
||||
|
Yearly Precipitation / Departure from Normal |
17.94”/-3.78” |
23.04”/+0.71” |
22.73”/+0.35” |
22.08”/+0.0” |
|
Yearly Snowfall / Departure from Normal |
57.9”/+19.8” |
70.8”/+26.3” |
52.8”/+21.1” |
65.9”/+30.0” |
|
Highest Wind Gust MPH / Date |
71 / July 10 |
66 / July 3 |
N/A |
54 / June 2 |
|
Temperature Data |
Pierre |
Kennebec |
Mobridge |
Timber Lake |
|
Warmest Temperature/Date |
103° / Aug 11 |
101° / Jul 11, Aug 11 |
103° / Aug 10 |
100° / Jul 7 |
|
Coldest Temperature/Date |
-22° / Jan 1 |
-35° / Jan 1 |
-30° / Jan 1 |
-32° / Jan 1 |
|
Average Yearly High/Departure from Normal |
57.1° / -2.1 |
59.2° / -2.1 |
56.1° / -0.7 |
55.0° / -1.7 |
|
Average Yearly Low/Departure from Normal |
34.3° / -1.3 |
34.6° / +1.0 |
33.1° / +0.7 |
32.2° / -0.2 |
|
Yearly Average/Departure from Normal |
45.7° / -1.7 |
46.9° / -0.6 |
44.9° / +0.0 |
43.6° / -1.0 |
|
Precipitation/Wind Data |
||||
|
Yearly Precipitation / Departure from Normal |
17.83”/-2.18” |
26.03”/+8.6” |
19.17”/+1.3” |
22.29”/+4.66” |
|
Yearly Snowfall / Departure from Normal |
52.9”/+21.0” |
65.6”/+33.9” |
51.8”/+20.7” |
44.6”/+9.5” |
|
Highest Wind Gust MPH / Date |
70 / Jun 5th |
N/A |
95 / July 4 |
N/A |
Temperature departure in 2018, courtesy of the Midwestern Regional Climate Center
Precipitation totals (left) and departures (right) in 2018, courtesy of the Midwestern Regional Climate Center
Snowfall totals (left) and departures (right) in 2018, courtesy of the Midwestern Regional Climate Center. Note: A station northwest of Rapid City is in error.
Monthly Summaries
January 2018
January 2018 began exceptionally cold. On the heels of the coldest final 7 days of any December on record, record cold continued into the first couple days of January 2018. On the 1st, Aberdeen recorded a daily record cold high of -9° and low of -32°, Mobridge recorded a daily record cold high of -8° and low of -30° and Pierre recorded a daily record cold high of -9° and low of -22°. Pierre also recorded a daily record cold low of -21° on the 2nd. That said, a January Thaw overtook the area in the middle of the month when upper 40’s and even lower 50’s were common. Sisseton set a daily record high of 51° on the 19th. On a whole for the month, temperatures were about average.
Regarding precipitation, it was another below average month. While a significant snowstorm affected much of southern South Dakota and Minnesota on the 21st and 22nd, the vast majority of the area ranged from 2 to 8 inches of snow below average. This means only 1-2” of snow fell these past 31 days, and in some cases less. Pierre recorded just a trace of snow which sets the record for least amount of snow for January. Aberdeen and Sisseton also ranked within the top 10 Januaries on record in terms of lack of snowfall. That said, a few scattered light rain events helped slightly in the overall moisture department thanks to a period of mild temperatures.
February 2018
February 2018 was a reminder of what winter in South Dakota and Minnesota typically looks like! Looking at the month as a whole, temperatures ranged from 7 to as much as 15 degrees below average. Temperatures began cold and for the most part, with the exception of a brief period in the middle of the month, stayed cold. In fact, Pierre only observed 2 days with an above average high temperature, Mobridge 4 days, and Aberdeen 5.
An active pattern led to generally 8-20” of snow across the area (about 3-15” above average), this in stark contrast to the lackluster snow season up until the month began. Several daily snowfall records fell over the course of the month thanks to at least 4 main distinct snowfall events. After the least snowy January on record at Pierre with just a trace, 16.6” this month goes down as the 6th snowiest February on record. Additionally the 17.4” that fell in Mobridge goes down as the 3rd snowiest February on record, the 17.9” that fell in Sisseton is the 4th snowiest, and the 19.1” in Kennebec is the 6th snowiest.
March 2018
March picked up where February left off – more cold and snow. Thanks in large part to a major winter storm on March 5th and 6th, snowfall totals ranged generally from 2 to 12 inches above average across central/northeastern South Dakota and west central Minnesota. This system broke many daily snowfall and precipitation records, as anywhere from 4 to 18 inches of snow fell during that 2-day period alone. Wheaton, MN picked up 1.20” of moisture on the 5th alone, which is only 0.28” away from their average March total. More information here: https://www.weather.gov/abr/20180305-6_WinterStorm. A generally active precipitation pattern persisted through the rest of the month as well, leading to much above average monthly snowfall amounts. Sisseton recorded their 5th snowiest March on record, Wheaton ranked 7th and Watertown 8th.
Temperatures on a whole during March 2018 were generally below average, by as much as 3 to 5 degrees across central South Dakota. Some of the coldest air came through on the 8th when low single digits above zero were recorded widespread. On the last day of the month, cold air combined with strong winds to produce wind chills as cold as -18 degrees across north central South Dakota! Watertown failed to reach 50 degrees this March. For perspective the average is 6 days, and March 2016 produced 17 days above 50.
The season as a whole has been bipolar snowfall-wise, to say the least. Significant snow departures had developed by the end of January, but amazingly, February and March have combined to restore near-normal seasonal amounts. What does April have in store? Signs point towards more snow and cold, in above average proportions, through at least the first 2 weeks.
April 2018
Cold and snow continued impacting the area in April. The month began with light snow across the region on the 2nd and 3rd with amounts ranging between 2 – 6 inches. The storm system was followed by an Arctic high pressure which brought bitter cold temperatures on April 4th, and then another snow system struck on the 8th. Winter weather was far from over by this point however, as a dynamic and historic springtime storm system severely impacted the Northern Plains on April 13th and 14th. Widespread snowfall totals of one to two feet across the southern half of South Dakota and southern Minnesota combined with winds gusts of up to 50 mph to produce widespread blizzard conditions for many hours. Both portions of I-29 and I-90 were closed from the afternoon of the 13th through the morning of the 15th. More information here: https://www.weather.gov/abr/April13-14BlizzardSummary. By the time April 2018 was over, it ranked as the 2nd snowiest on record in Watertown (29.5” in 2008), 3rd snowiest in Kennebec, 5th in Pierre, 7th in Timber Lake, and 10th in Mobridge. Most locations finished 5-15 inches of snow above average. Several daily snowfall total records (not necessarily storm total) were recorded throughout the month. Thanks to an incredibly active end of the 2017-2018 snow season, Kennebec ranks as the 7th snowiest season on record with 56.9” of snow, and Watertown ranks 10th with 53.1”. Despite the much above average snowfall, some areas were below average on total precipitation, particularly across northeastern South Dakota and western Minnesota where 1-2" of moisture was lacking.
Temperatures on a whole during April 2018 were very much below average, by as much as 8 to 12 degrees. The coldest air arrived on the 3rd with highs only in the 20s for most locations. Low temperatures the morning of the 4th were in the single digits on either side of zero. Several locations saw record lows the morning of the 4th, including all-time April low temperatures in Aberdeen of -6 degrees and in Pierre of 0 degrees. Several record cold daily low and high temperatures were set through April 16th before conditions began to moderate towards the end of the month. Despite this warm-up, April 2018 will go down in the record books as one of the very coldest on record across the area: Kennebec set their record (2nd place was 39.9 degrees in 2013), Aberdeen, Watertown, and Pierre came in at 2nd place for coldest April on record (record coldest Aprils were 34.9 degrees in 2013, 33.5 degrees in 1950, and 37.6 degrees in 2013 respectively), and Sisseton, Mobridge, Timber Lake and Wheaton ranked 3rd. Watertown observed only 4 days with high temperatures above average, and Sisseton only 5. Kennebec was only 3.4 degrees above the monthly normal temperature of March, and Pierre only 3.6 degrees!
May 2018
May 2018 was either very wet or very dry, depending on your location. While a generally active pattern brought several opportunities for precipitation, Aberdeen recorded their 7th driest May on record with just 0.52” of moisture (1900 holds the record at 0.25”). This is 0.13” less than was recorded in May 2017. However, 2017 was drier than 2018 from January 1st to May 31st in Aberdeen by 0.58” (3.76” below normal vs 3.18” below normal respectively). On the contrary, an exceptionally heavy rainfall event took place across portions of north central South Dakota on May 17th. Training thunderstorms, those which develop and pass over the same areas over extended periods of time, led to extreme rainfall reports including 13.15” four miles northwest of Long Lake, SD. These measurements are being vetted to determine if they meet standards necessary to qualify as South Dakota’s state 24 hour precipitation record (currently held by Groton, SD with 8.74” recorded on May 6th, 2007). This heavy rainfall contributed to the failure of the Hiddenwood Lake Dam about 4 miles north of Selby, SD on the morning of May 18th. Several area roadways were submerged as a result. More information on the May 17th event can be found here: https://www.weather.gov/abr/2018May17_18_severe_flooding
May 2018 was very warm across the board, May 24-27th in particular. The following were record daily high temperatures: Watertown reached 96° on the 27th, Sisseton reached 90° on the 24th, 93° on the 25th, and 95° on the 26th, and Aberdeen reached 94° on the 25th, 97° on the 26th and 101° on the 27th. This is only the 4th year on record in Aberdeen when a May day reached at least 100° (once in 2018, 1959 and 1931, and 7 times in 1934). This was the 3rd warmest May on record in Aberdeen (64.5° average temperature vs 1st place 69° in 1934), the 3rd warmest May on record in Sisseton (64.3° average temperature vs 1st place 70.3° in 1934), the 3rd warmest May on record in Wheaton (64.8° vs 1st place 67.1° in 1977, the 4th warmest in Timber Lake, 7th in Pierre and Watertown, and 8th warmest in Kennebec. This is an abrupt turn-around from just a month ago. Amazingly, Aberdeen recorded their 2nd coldest April on record this year, and both Sisseton and Wheaton recorded their 3rd coldest April on record this year. “Normal” weather is just the average of extremes in the Northern Plains after all.
June 2018
June 2018 was above average temperature-wise, from 2 to 6+ degrees. Portions of the James River Valley were warmest, as below average precipitation allowed for drier and thus warmer air here. The first half of the month was record-breaking in some cases, including 99° on the 14th and 97° on the 5th at Mobridge, 99° on the 5th in Pierre, 95° on the 5th in Watertown (daily records).
Much of central South Dakota and west central Minnesota received above average precipitation while portions of the Coteau and the James Valley were below average. Accordingly, and on the heels of a dry May as well, the James River Valley is where, on June 1st, high winds associated with thunderstorm activity produced a dust storm which greatly reduced visibility during the evening hours. (https://www.weather.gov/abr/2018June1_Severe_Dust). Drought, severe in some cases, persisted through the month across portions of the James River Valley despite an overall active weather pattern. Bad luck can be attributed to this relatively small region of drought. On the contrary, bouts of heavy rain occurred across the area as well. Watertown for instance picked up a daily record 1.84” of rain on the 11th, 1.55” of which fell in one hour from 10 to 11 am. Localized flooding resulted in town. Daily rainfall records were also set at Pierre (1.84” on the 27th) and Mobridge (1.09” on the 17th).
As is typical in June, impactful severe weather developed on a number of days. A line of storms during the evening of June 5th into the morning of June 6th produced widespread straight-line wind damage from Corson/Dewey counties to Grant county. A wind gust of 100 mph was recorded near Lowry (https://www.weather.gov/abr/20180605WindAndHail). On June 16th, two tornadoes developed near Burdette, and another touched down briefly near Claire City on the 24th (several funnel clouds this day as well). Finally, two separate large hailstorms affected generally the same area of Dewey, Sully, Hughes and Stanley counties on the early morning of 27th and on the evening of the 29th. Hail scars were visible via satellite in the following days as large swaths of cropland and other vegetation were pulverized.
July 2018
Despite starting generally warmer than normal, July 2018 finished cooler than normal to average out at near normal temperature-wise overall across the area. July 26th featured a record minimum high temperature at Watertown of 66 degrees.
Regarding precipitation, much of central South Dakota ranged from near normal to upwards of 2” below normal while northeastern South Dakota and west central Minnesota generally received above average rainfall; much above average in some cases. Britton recorded two 4+ inch rainfall events, on the 9-10th and 19-20th, which contributed to a monthly total of 10.39” (record July total is 10.83” in 1993). Sisseton recorded a total of 6.64” of rain with ranks as the 6th wettest July on record. A significant heavy rainfall and flooding event took place on the evening of July 2nd into the morning of July 3rd across portions of northern Hand and southern Spink counties. 11” was measured in a KELOLAND rain gauge before it overflowed 3 miles south-southwest of Polo. The probability for this type of rainfall to occur here is 0.1%. In other words, this is about as likely as being dealt a full house in 5 card poker, or getting a YAHTZEE on the first roll (https://hdsc.nws.noaa.gov/hdsc/pfds/pfds_map_cont.html?bkmrk=sd). Looking at it another way, this one 24 hour rainfall event nearly equaled what the area receives on average in all of May, June, July and August, the four wettest months of the year, combined (Miller: 11.36”). Drought conditions improved from D2 Severe to D1 Moderate throughout the course of the month across the James River Valley.
The most noteworthy severe weather event of the month occurred on the evening of July 3rd into the morning of July 4th. Significantly severe 96 mph wind gusts were recorded at Mobridge and ~10 miles west-northwest of Long Lake as a line of thunderstorms raced from Rapid City to Eagle Butte to Forbes, ND. Extensive damage, including structural damage, resulted in certain cases. More information can be found here: https://www.weather.gov/abr/July2-4SevereStorms
August 2018
August 2018 was near normal in terms of temperatures on a whole. Record cold was recorded however, at both Aberdeen and Sisseton on the 2nd: 40 degrees and 42 degrees respectively. There were a number of days where thick smoke from Western U.S. and Southwestern Canadian wildfires blocked out enough sunlight to reduce daytime high temperatures by a few degrees. Smoke was thick enough even at the surface to reduce visibility, and the air smelled of it as well. Haze filled our skies on and off again throughout much of the month thanks to a favorable upper-level wind pattern and an active fire season.
Precipitation departures range from up to 2” below average and up to 3” above average. Those who entered the month dry generally remained as such, and thus the U.S. Drought Monitor changed little throughout the month. D2/Severe Drought continues to impact portions of Brown, Spink, Edmunds and Faulk counties as of the 28th. Further west, severe weather was a reoccurring theme especially towards the end of the month. Typically, after the jet stream jogs north into Canada in July, it tracks back into the Northern Plains in August and so a “secondary severe weather season” can emerge. This season’s began on the 23rd when Hyde county observed two tornadoes and a 3” diameter hailstone fell just northwest of Hoven (https://www.weather.gov/abr/SevereWeatherSummary8-23-18). 4” diameter hail fell in Blunt on the 26th, and 3.5” diameter hail fell near Presho on the 27th. Hailstones this large are fairly uncommon, as these events accounted for 3 of the 41 days that our forecast area (http://tinyurl.com/jzlnoq8) has had reports of 3” or larger diameter hail since 1950 and one of the 25 days with 4” or larger diameter hail (last occurrence on June 21st, 2013 in Spink County). Therefore, on average, a 3” hailstone is recorded about once every other year and a 4” hailstone about once every three years.
September 2018
September 2018 finished between average and up to 2 inches of precipitation above average generally along and west of the James River Valley as well as across east central and southeastern South Dakota, and up to an inch of precipitation below average across the rest of northeastern South Dakota as well as west central Minnesota. Indeed, several rounds of rainfall occurred generally during the second half of the month, including a widespread 1” plus event on the 19th and 20th. Mobridge recorded 2.1” on the 20th, which broke the previous daily rainfall record of 0.96” set in 1996. This largely contributed to Mobridge recording their 7th wettest September on record with 3.33”. Timber Lake, with 3.37”, recorded their 4th wettest September on record. While this uptick in activity was helpful across the severe drought-stricken areas of portions of Brown, Spink, Faulk, Edmunds and McPherson counties, it’ll take much more moisture to alleviate long-term deficits. While opportunities have been plenty across portions of South Dakota, they’ve unfortunately been misplaced. Amazingly, Sioux Falls year-to-date has recorded 20.78 more inches of precipitation than Aberdeen has (34.32” vs 13.54”). For perspective, Sioux Falls typically receives 3.68” more precipitation than Aberdeen through the end of September. Flooding has been a large story this month across southeastern South Dakota. Finally, snow was not reported across the Aberdeen NWS County Warning Area this September, though there were a few close calls late in the month.
On the whole, near average to up to 2 degrees above normal temperatures were recorded this month across the area. While temperatures during the first half of the month were much above average, an active precipitation pattern during the second half of the month ushered in plenty of clouds and cool air which led to generally below average temperatures during this time. This mid-month shift was quite apparent at Aberdeen for example, as their high temperature on the 16th was 95 degrees but only 63 degrees the following day (93 followed by 61 degrees at Sisseton). By September 25th, patchy frost was possible and a widespread freeze with low temperatures between 32 and 26 degrees took place across northern South Dakota and west central Minnesota on the 28th and 29th.
October 2018
October 2018 was below normal in terms of temperatures on a whole. Much below normal temperatures dominated the first 15 days of October with several locations experiencing their coldest or second coldest start of the month. The cold start, along with minor warmth in the second half allowed Sisseton, Aberdeen, Watertown, Pierre, and Wheaton Minnesota to see their top ten coldest October on record. Sisseton saw their third coldest October on record with an average temperature of 40.9 degrees, or 5.4 degrees below normal. Record lows were set on October 15th when temperatures dropped in the teens and low 20s.
Precipitation amounts across eastern and northeastern South Dakota and western Minnesota was 0.15 to 0.75 inches above normal. Areas along and west of the Missouri valley saw around or just below normal precipitation amounts. The big story for precipitation was early season snowfall on October 9th through the 11th. A rare and particular combination of persistent wet snow and stiff winds downed power lines across parts of Spink, Brown and Marshall Counties. The result was the loss of power to thousands of customers, 400+ of which overnight. Localized areas received as much as 6-9” of snow in Brown and Marshall Counties. Sisseton recorded its second earliest measurable snowfall on record when 3.4 inches fell on the 10th. Wheaton, MN, Kennebec, Timber Lake and Aberdeen all recorded top 10 earliest measureable snowfalls.
November 2018
November 2018 changed little from the month before, as in temperatures remained relatively chilly on a whole. The area ranged from 2 to 8 degrees below average, with northeastern South Dakota and western Minnesota being the coolest. Sisseton recorded their 6th coldest November on record, and Wheaton tied for their 5th coldest. Aberdeen, Watertown, Sisseton and Pierre recorded either record cold lows or highs on November 9th, and additional cold records were set on the 17th and 10th across the area.
No blockbuster winter storms impacted the area this November (historically, November is one of our snowiest months), but there were a number of wintry precipitation events that led to difficult travel. Namely, a swath of generally 2-6 inches (locally higher) of snow impacted north central and northeastern South Dakota and west central Minnesota on the 16th. Additionally, light freezing rain impacted the area on the 28th and freezing drizzle impacted mainly central South Dakota on the evening of the 16th.
December 2018
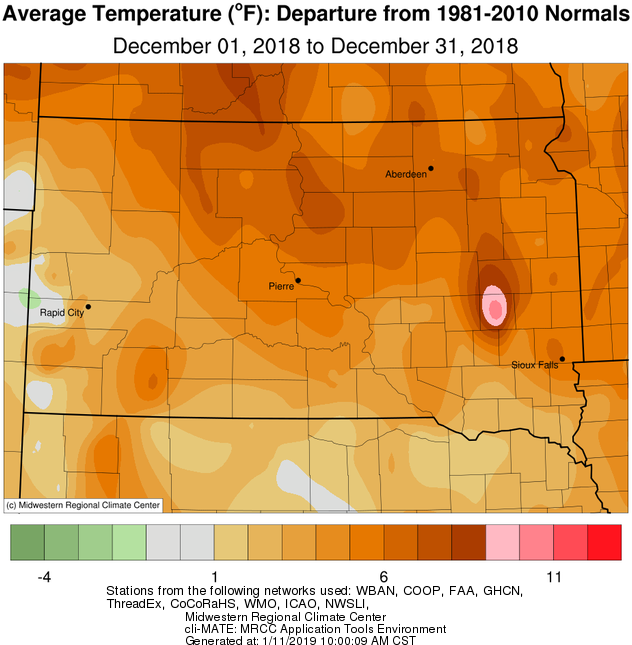
December 2018 was quite mild temperature-wise, anywhere from 4 to 8 degrees above average on the whole. Mobridge finished the month with an average temperature of 26.6 degrees, which ranks as the 7th warmest December on record. El Niño may have played a role, as upper level wind patterns across North America respond to warmer equatorial waters off the coast of South America. In addition to a generally milder pattern for temperatures across the High Plains, drier weather is a typical response as well. That was true for much of December, and bare ground allowed for extra absorption of solar radiation which would have otherwise been reflected back out to space due to white snow cover. However, rogue storm systems are always a possibility…
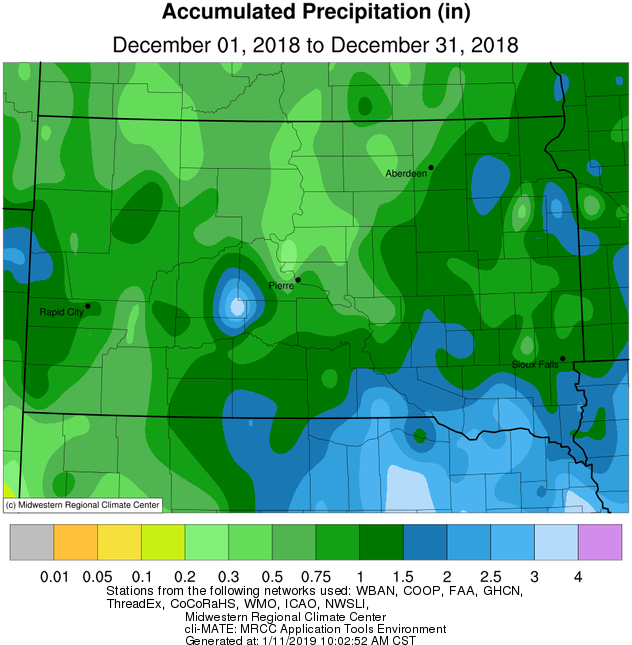
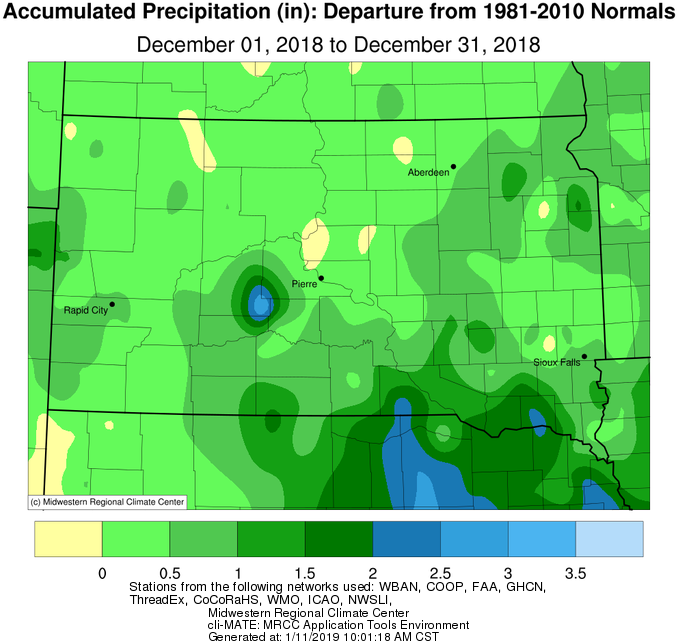
The vast majority of our forecast area finished the month above normal in terms of precipitation and snowfall. A few locations even recorded top 10 values: Watertown recorded their 6th wettest December with 1.59” of precipitation and 8th snowiest with 14.3” of snow in Watertown, 8th wettest and 4th snowiest at Sisseton with 1.24” and 17.9” respectively, and 9th wettest and 10th snowiest at Wheaton with 1.32” and 13.1” respectively. This was thanks in large part to a strong and relatively wet storm system that impacted the region December 26-28th. Wind gusts of 50+ mph and snowfall of generally 6-12” led to blizzard conditions mainly east of the Missouri River (https://www.weather.gov/abr/December26th-28thWinterStormandBlizzard). Another round of snow and high winds resulted in blizzard conditions across northeastern South Dakota and west central Minnesota on the 31st.
A somewhat unusual aspect to this December was the number of freezing rain events. Whenever precipitation moved into the area, freezing drizzle or freezing rain was often a concern in the forecast process. These concerns were realized especially so on the evening of the 11th, 12th, on the morning of the 19th, during the 26-27th winter storm, and on the evening of the 30th. While amounts were generally under a tenth of an inch in these cases, the effect was nonetheless extremely hazardous travel. Once again, El Niño may have had a hand in this. Storm systems favor a more southerly track during El Niño winters, meaning the Southern US receives more precipitation. This was the case this December. The result is drier air near the surface across the Northern Plains as the Gulf of Mexico is effectively shut off. When systems do enter our area, they precipitate snow into a near-surface warm/dry layer, and this layer melts the snow into liquid before reaching the ground. However, when surface and ground temperatures remain at or below freezing, this liquid freezes on contact on roads, sidewalks, etc.
December 2018 was quite mild temperature-wise, anywhere from 4 to 8 degrees above average on the whole. Mobridge finished the month with an average temperature of 26.6 degrees, which ranks as the 7th warmest December on record. El Niño may have played a role, as upper level wind patterns across North America respond to warmer equatorial waters off the coast of South America. In addition to a generally milder pattern for temperatures across the High Plains, drier weather is a typical response as well. That was true for much of December, and bare ground allowed for extra absorption of solar radiation which would have otherwise been reflected back out to space due to white snow cover. However, rogue storm systems are always a possibility…
The vast majority of our forecast area finished the month above normal in terms of precipitation and snowfall. A few locations even recorded top 10 values: Watertown recorded their 6th wettest December with 1.59” of precipitation and 8th snowiest with 14.3” of snow in Watertown, 8th wettest and 4th snowiest at Sisseton with 1.24” and 17.9” respectively, and 9th wettest and 10th snowiest at Wheaton with 1.32” and 13.1” respectively. This was thanks in large part to a strong and relatively wet storm system that impacted the region December 26-28th. Wind gusts of 50+ mph and snowfall of generally 6-12” led to blizzard conditions mainly east of the Missouri River (https://www.weather.gov/abr/December26th-28thWinterStormandBlizzard). Another round of snow and high winds resulted in blizzard conditions across northeastern South Dakota and west central Minnesota on the 31st.
A somewhat unusual aspect to this December was the number of freezing rain events. Whenever precipitation moved into the area, freezing drizzle or freezing rain was often a concern in the forecast process. These concerns were realized especially so on the evening of the 11th, 12th, on the morning of the 19th, during the 26-27th winter storm, and on the evening of the 30th. While amounts were generally under a tenth of an inch in these cases, the effect was nonetheless extremely hazardous travel. Once again, El Niño may have had a hand in this. Storm systems favor a more southerly track during El Niño winters, meaning the Southern US receives more precipitation. This was the case this December. The result is drier air near the surface across the Northern Plains as the Gulf of Mexico is effectively shut off. When systems do enter our area, they precipitate snow into a near-surface warm/dry layer, and this layer melts the snow into liquid before reaching the ground. However, when surface and ground temperatures remain at or below freezing, this liquid freezes on contact on roads, sidewalks, etc.
|
DECEMBER 2018 |
||||
|
Temperature Data |
Aberdeen |
Sisseton |
Wheaton |
Watertown |
|
Warmest Temperature / Date |
49 / 14th |
53 / 15th |
46 / 15th, 19th |
44 / 15th |
|
Coldest Temperature / Date |
-21 / 29th |
-22 / 29th |
-15 / 29th |
-18 / 29th |
|
Average High / Departure from Normal |
33.1 / +7.6 |
31.8 / +5.7 |
30.0 / +7.1 |
29.8 / +5.0 |
|
Average Low / Departure from Normal |
10.9 / +5.0 |
13.8 / +5.9 |
14.0 / +8.0 |
12.3 / +5.1 |
|
Monthly Average / Departure from Normal |
22.0 / +6.3 |
22.8 / +5.8 |
22.0 / +7.6 |
21.0 / +5.0 |
|
Precipitation Data |
||||
|
Monthly Precipitation / Departure from Normal |
1.01” / +0.49 |
1.24” / +0.85 |
1.32” / +0.60 |
1.59” / +1.06 |
|
Monthly Snowfall / Departure from Normal |
12.3” / +5.4 |
17.9” / +10.3 |
13.1” / +4.9 |
14.3” / +7.2 |
|
Most Precipitation in 24 hours / Date |
0.48” / 26th |
0.48” / 26th |
0.48” / 28th |
0.58” / 26th |
|
Most Snow in 24 hours / Date |
5.2” / 26th |
6.2” / 27th |
4.8” / +28th |
5.5” / 26th |
|
Temperature Data |
Pierre |
Kennebec |
Mobridge |
Timber Lake |
|
Warmest Temperature / Date |
55 / 15th |
56 / 14th |
55 / 15th |
55 / 18th |
|
Coldest Temperature / Date |
-9 / 28th, 29th |
-13 / 29th |
-9 / 28th |
-6 / 29th |
|
Average High / Departure from Normal |
37.6 / +6.3 |
38.6 / +5.9 |
36.4 / +7.7 |
35.4 / +5.9 |
|
Average Low / Departure from Normal |
16.6 / +4.5 |
16.1 / +4.8 |
16.9 / +9.2 |
15.6 / +5.7 |
|
Monthly Average / Departure from Normal |
27.1 / +5.4 |
27.3 + 5.3 |
26.6 / +8.4 |
25.7 / +5.8 |
|
Precipitation Data |
||||
|
Monthly Precipitation / Departure from Normal |
1.05” / +0.50 |
0.84” / +4.6 |
0.54” / +0.10 |
0.69” / +0.21 |
|
Monthly Snowfall / Departure from Normal |
6.8” / +1.9 |
11.7” / +5.1 |
7.6” / +1.9 |
6.5” / -1.0 |
|
Most Precipitation in 24 hours / Date |
0.34” / 26th |
0.32” / 26th |
0.41” / 26th |
0.45” / 26th |
|
Most Snow in 24 hours / Date |
3.0” / 26th |
4.0” / 31st |
6.3” / 26th |
5.0” / 26th |
Temperature departures during December 2018, courtesy of the Midwestern Regional Climate Center
Precipitation totals (left) and departures (right) during December 2018, courtesy of the Midwestern Regional Climate Center
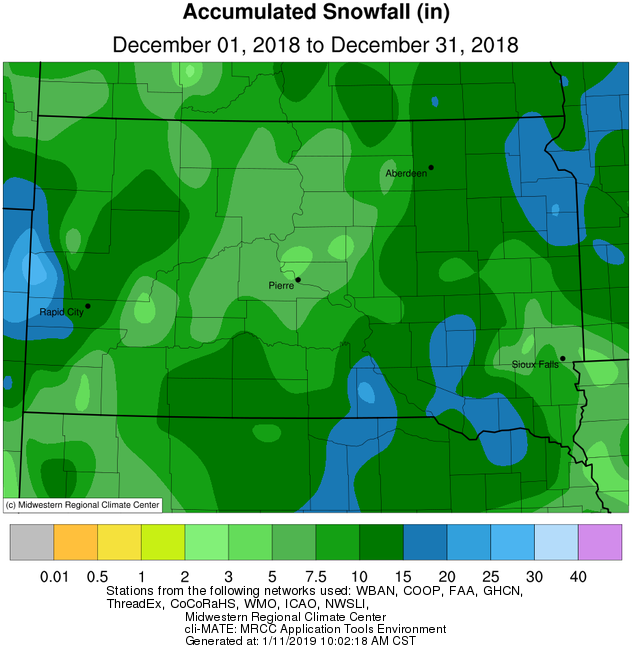
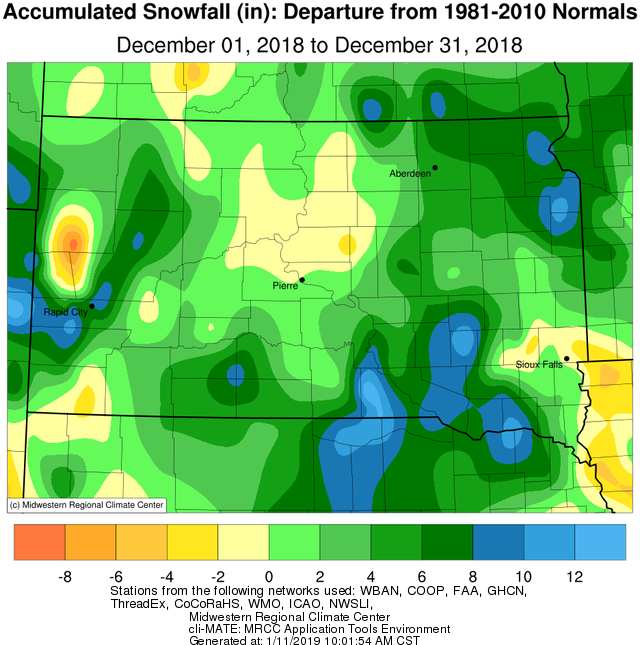
Snowfall totals (left) and departures (right) during December 2018, courtesy of the Midwestern Regional Climate Center. Note: Values at Watertown are in error and should be higher.
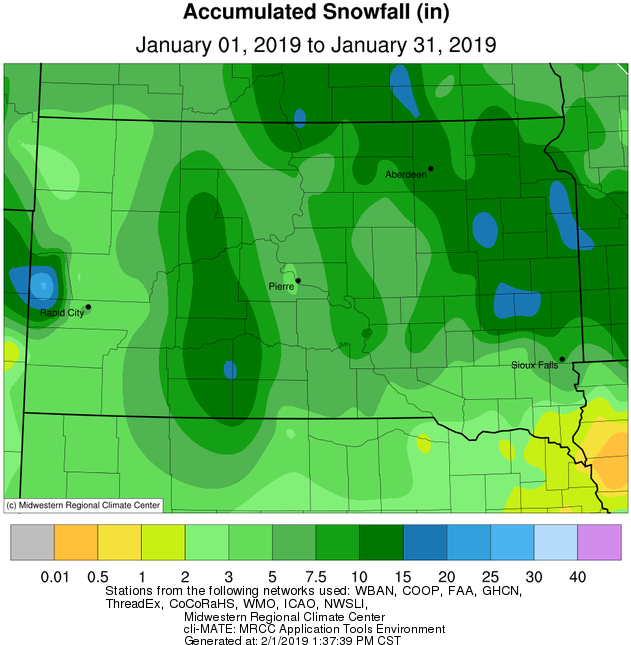
The first half of January 2019 was largely mild and dry, however a change in pattern took hold through the second half. On a whole, much of the area finished below average by 1-5 degrees with near average temperatures across portions of central and north central South Dakota. Arctic, even historic cold gripped the area January 30th and 31st. Record daily cold low and high temperatures were set across much of northeastern South Dakota and west central Minnesota on the 30th and 31st. Some of the coldest readings were -40 F in Britton, -38 F in Summit, -37 in Aberdeen, -37 in Eureka and -33 F in Watertown. Many areas spent around 60 hours (over 2 days) below zero. Winds were a factor as well, leading to exceptionally cold wind chills including -59 F at Sisseton, -58 F in Graceville, -57 F in Ortonville, -56 in Wheaton and -54 in Watertown. This event was part of a much larger historic outbreak of air that extended from the Dakotas through MN, WI, IL, MI, etc.
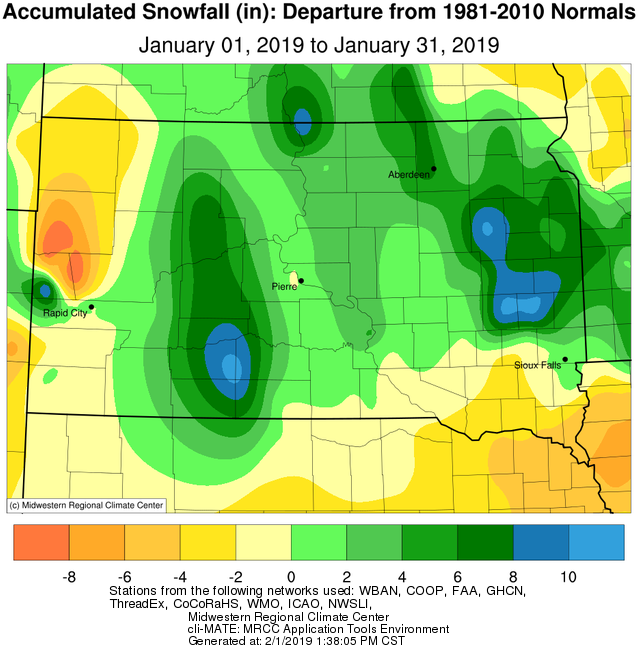
In terms of precipitation/snowfall, much of the area finished above average. Some areas of northeastern South Dakota finished 4-10 inches of snow above average. Again, much of this fell during a more active pattern during the second half of the month. Two systems of note impacted the area. The first, on the 18th, produced a general 2-6” of snow fell mainly across central and eastern South Dakota. The second, on the 27-28th, produced a general swath of 2-6” of snow across northeastern South Dakota and west central Minnesota. This system also produced significant winds with gusts of 60-70 mph and blizzard conditions mainly across/near the James River Valley. The onset of this blizzard was very rapid, which contributed to many accidents on the roadways.
|
January 2019 |
||||
|
Temperature Data |
Aberdeen |
Sisseton |
Wheaton |
Watertown |
|
Warmest Temperature / Date |
42°/ 5th |
42°/ 4, 5th |
43°/ 4th |
39°/ 7th |
|
Coldest Temperature / Date |
-37°/ 30th |
-31°/ 31st |
-30°/ 30, 31st |
-34°/ 30th |
|
Average High / Departure from Normal |
20.1°/ -2.4° |
17.1°/ -5.9° |
15.8°/ -3.6° |
18.3°/ -3.9° |
|
Average Low / Departure from Normal |
-0.3°/ -1.8° |
-1.0°/ -3.3° |
0.0°/ -0.6° |
0.0°/ -3.1° |
|
Monthly Average / Departure from Normal |
9.9°/ -2.1° |
8.1°/ -5.0° |
7.9°/ -2.1° |
9.1°/ -3.6° |
|
Precipitation Data |
||||
|
Monthly Precipitation / Departure from Normal |
1.0”/+0.53” |
0.67”/+0.24” |
0.38”/-0.44” |
0.93”/+0.41” |
|
Most Precipitation in 24 hours / Date |
0.41”/ 27th |
0.27”/ 27th |
0.18”/ 27th |
0.45”/18th |
|
Monthly Snowfall / Departure from Normal |
12.7” / +6.3” |
10.4” / +2.0” |
7.5” / -1.5” |
12.4” / +7.1” |
|
Most Snow in 24 hours / Date |
5.2” / 18th |
4.4” / 27th |
3.6” / 27th |
6.2” / 18th |
|
Temperature Data |
Pierre |
Kennebec |
Mobridge |
Timber Lake |
|
Warmest Temperature / Date |
47°/ 4, 5th |
47°/ 4, 7th |
52°/ 4th |
48°/ 4th |
|
Coldest Temperature / Date |
-20°/ 30th |
-18°/ 19, 30th |
-26°/ 29th |
-22°/ 30th |
|
Average High / Departure from Normal |
28.6°/ -1.4° |
28.7°/ -3.2° |
26.0°/ +0.0° |
25.8°/ -2.3° |
|
Average Low / Departure from Normal |
10.1°/ +0.3° |
9.0°/ -1.1° |
7.3°/ +1.2° |
7.3°/ -0.5° |
|
Monthly Average / Departure from Normal |
19.7°/ -0.2° |
19.0°/ -2.0° |
16.7°/ +0.7° |
16.7°/ -1.3° |
|
Precipitation Data |
||||
|
Monthly Precipitation / Departure from Normal |
0.54”/ +0.12” |
0.39”/+0.0” |
0.64”/+0.35” |
0.61”/+0.18” |
|
Most Precipitation in 24 hours / Date |
0.46”/ 18th |
0.33”/ 18th |
0.19”/18, 21st |
0.31”/ 18th |
|
Monthly Snowfall / Departure from Normal |
6.0 / +1.3” |
6.5” / +1.7” |
8.1” / +3.1” |
6.0” / +0.4” |
|
Most Snow in 24 hours / Date |
5.0”/ 18th |
5.5” / 18th |
3.5” / 18th |
3.2” / 18th |
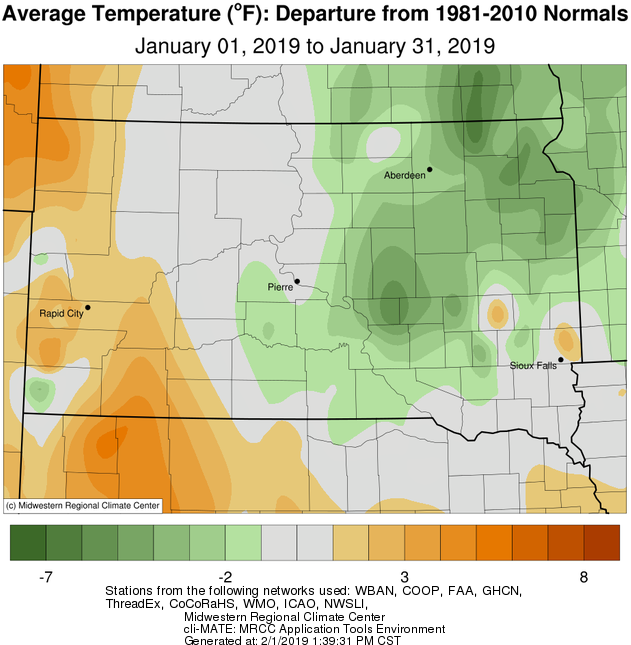
Mean temperature departure from normal, courtesy of the Midwestern Regional Climate Center
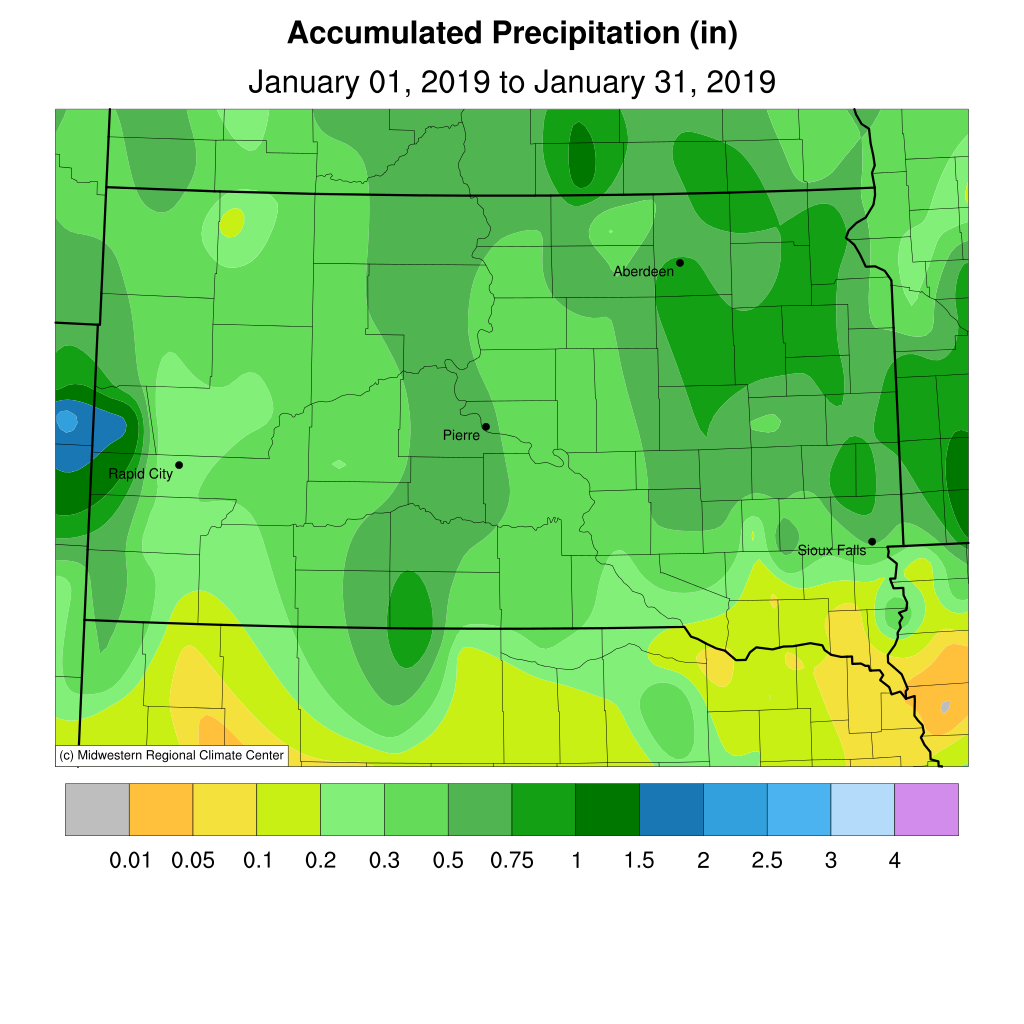
Precipitation totals, courtesy of the Midwestern Regional Climate Center
Snowfall totals, courtesy of the Midwestern Regional Climate Center
Snowfall departures, courtesy of the Midwestern Regional Climate Center

