September 2021 finished above average temperature-wise across the area, generally by 1 to 4 degrees. Aberdeen recorded their 10th warmest September on record, Sisseton tied for their 6th warmest, and Timber Lake ranked 6th as well. The hottest day of the month for nearly everyone was on Tuesday the 28th, and daily records were set at Aberdeen, Sisseton, Pierre and Mobridge among other locations. Aberdeen’s 94° high was the 6th latest 94° day on record (96 on Oct 5, 1963), Sisseton’s 91° was the 7th latest 91° day (Oct 11, 2015), and Watertown, Pierre, Mobridge and Timber Lake recorded highs that were all their respective 9th latest. The hottest temperatures on the 28th were actually recorded further north in North Dakota – Dickinson recorded a high of 100°, which is the latest 100° reading by any North Dakota station on record. Conversely, the coolest morning of the month for many occurred on the 25th, when temperatures dipped into the low 40s and low 30s. As a result, frost was observed across portions of north central and northeastern South Dakota. Watertown actually jumped from their coldest temp of the month (37° on the 25th) to their warmest (89° on the 26th) in just ~35 hours!
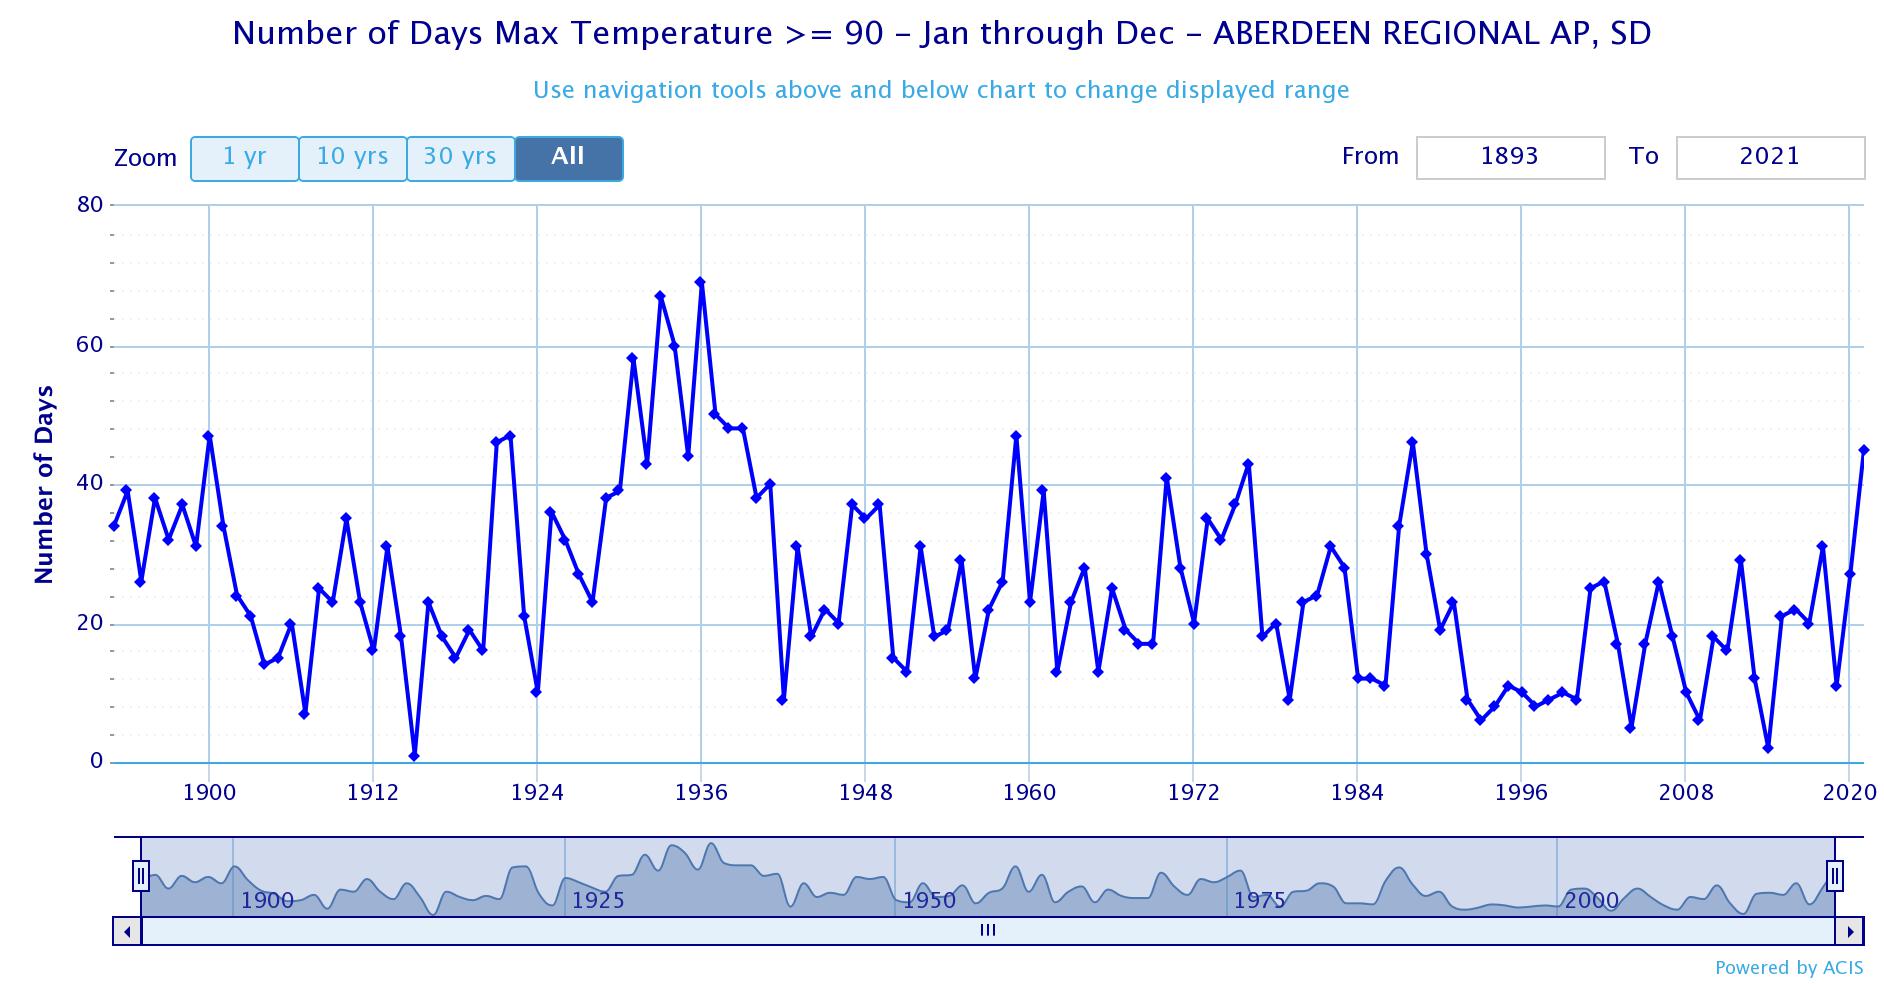
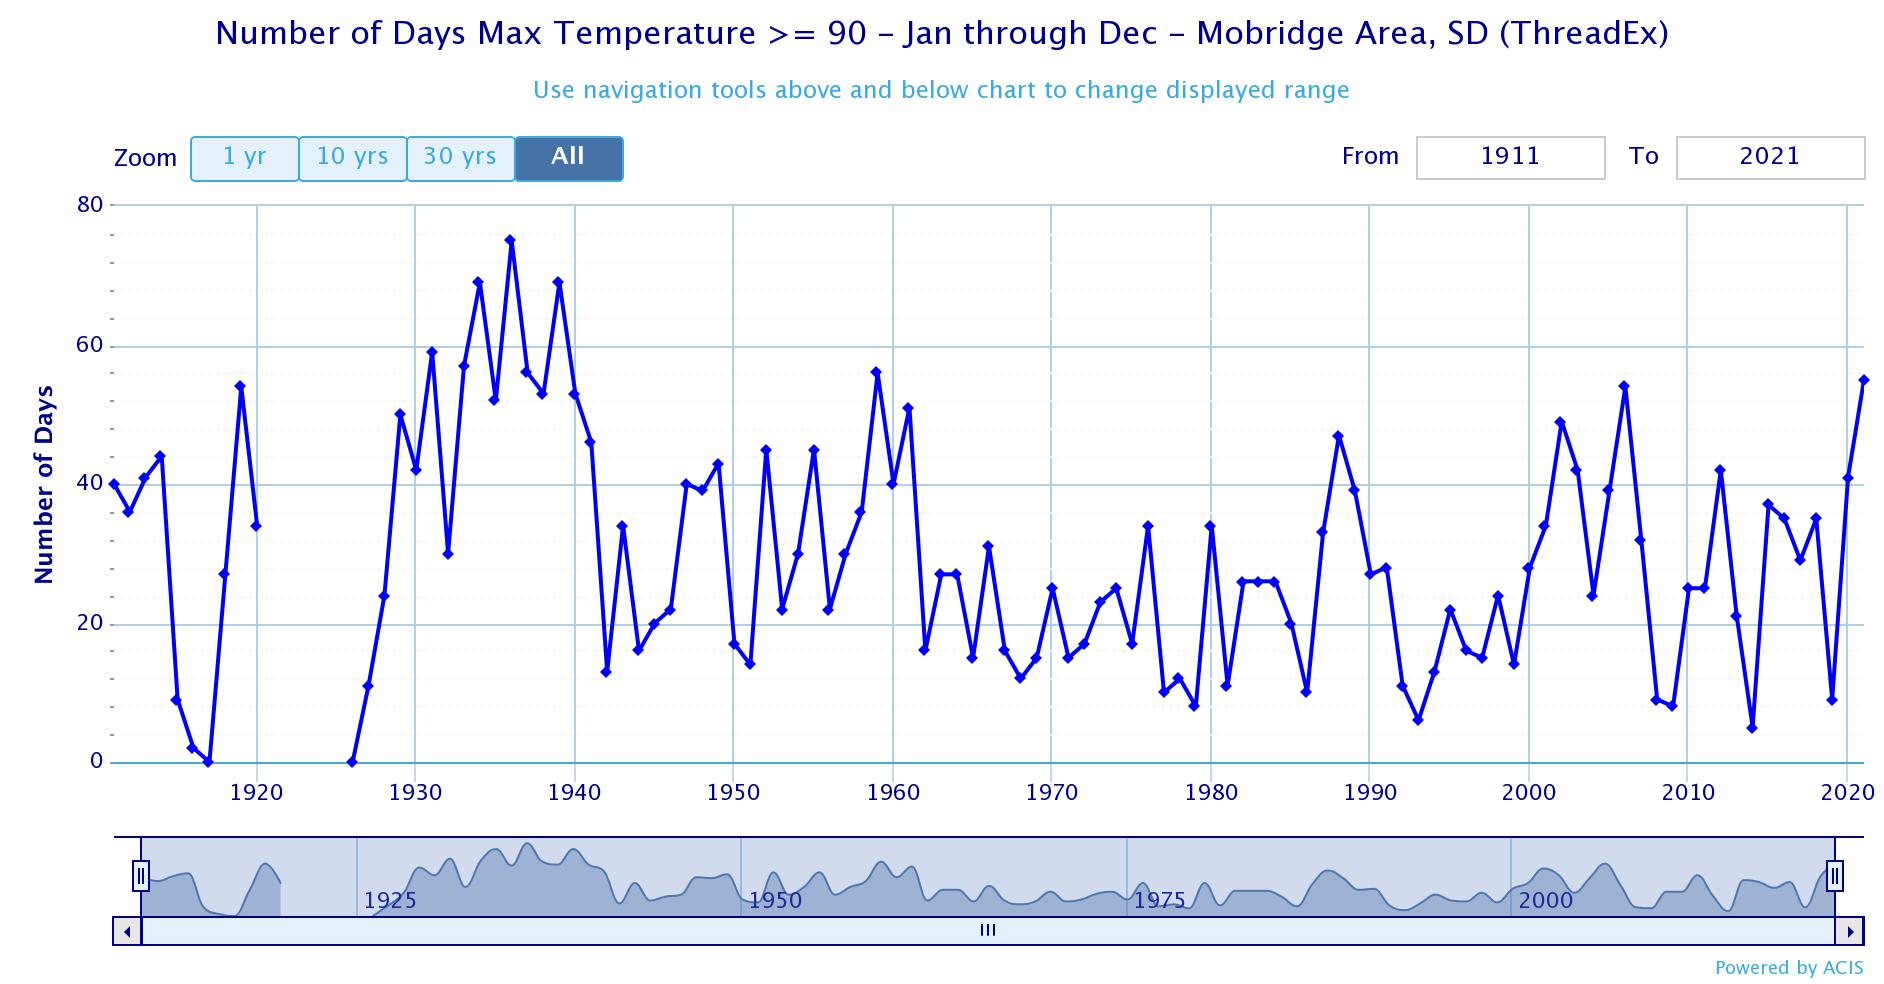
Looking at the warm season on the whole, the total number of 90° days this year at Aberdeen stands at 45 which is the most since 1988 (46) and ranks as the 13th most since records began in 1893 (5th if you don’t count the 1930s, which account for the top 7); Pierre has had 58 days which ranks as tied 14th most since records began in 1933; Mobridge has had 55 which is the most since 1959 with (56) and ranks as the 8th most since records began in 1911 (2nd if you don’t count the 1930s, which account for 6 of the top 7); Timber Lake has had 49 which is the most since 1939 (50) and ranks as the tied 7th most since records began in 1911 (tied 3rd if you don’t count the 1930s); Sisseton has had 30 which is the most since 1988 (38).
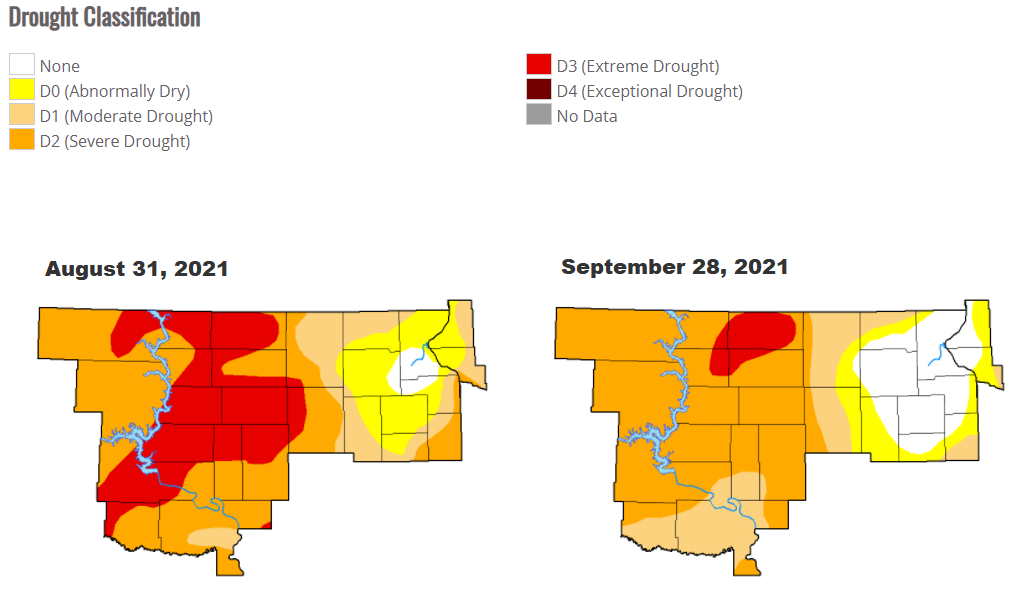
As for precipitation, total amounts for the month finished near average with the exception being a swath of above normal values from south central SD to west central MN. This was largely thanks to a widespread heavy rain event on the 2nd, when Watertown and Sisseton both set daily records. Kennebec finished with 5.15” of rain in September, which ranks as their 2nd wettest September on record (5.5” in 1996), and Sisseton finished with their 10th wettest. Impressively, Sisseton recorded 10.76” of rain from August 7th through September 13th. Despite a general improvement in drought conditions through the month across the area, much of central SD remained in Severe to Extreme Drought, and fire weather conditions remained an issue. Despite only two severe thunderstorm warnings issued by this office this September, there were several non-thunderstorm wind gusts of 50 to 60 mph on the 19-20th, mainly across central South Dakota.
|
September 2021 |
||||
|
Temperature Data |
Aberdeen |
Sisseton |
Wheaton |
Watertown |
|
Warmest Temperature / Date |
94 / 28th |
91 / 26, 28th |
90 / 28th |
89 / 26th |
|
Coldest Temperature / Date |
31 / 25th |
41 / 25th |
42 / 25th |
35 / 25th |
|
Average High / Departure from Normal |
79.2 / +4.3 |
78.1 / +4.6 |
75.4 / +2.5 |
75.4 / +3.8 |
|
Average Low / Departure from Normal |
50.0 / +3.2 |
51.3 / +3.3 |
51.5 / +1.3 |
51.1 / +2.5 |
|
Monthly Average / Departure from Normal |
64.6 / +3.7 |
64.7 / +3.9 |
63.5 / +2.0 |
63.3 / +3.2 |
|
Precipitation Data |
|
|
|
|
|
Monthly Precipitation / Departure from Normal |
2.05 / +0.06 |
4.21 / +1.76 |
3.41 / +0.51 |
3.01 / +0.56 |
|
Most Precipitation in 24 hours / Date |
1.44 / 2nd |
1.92 / 2nd |
1.95 / 2nd |
1.57 / 2nd |
|
Monthly Snowfall / Departure from Normal |
0.0 / +0.0 |
0.0 / +0.0 |
0.0 / +0.0 |
0.0 / +0.0 |
|
Most Snow in 24 hours / Date |
N/A |
N/A |
N/A |
N/A |
|
Temperature Data |
Pierre |
Kennebec |
Mobridge |
Timber Lake |
|
Warmest Temperature / Date |
95 / 28th |
95 / 28th |
92 / 28th |
93 / 18, 19th |
|
Coldest Temperature / Date |
37 / 25th |
38 / 28th |
32 / 25th |
37 / 25th |
|
Average High / Departure from Normal |
79.9 / +2.4 |
82.3 / +2.0 |
79.1 / +2.6 |
81.9 / +5.8 |
|
Average Low / Departure from Normal |
52.9 / +3.2 |
52.4 / +2.9 |
51.7 / +1.8 |
50.6 / +2.5 |
|
Monthly Average / Departure from Normal |
66.4 / +2.8 |
67.4 / +2.5 |
65.4 / +2.2 |
66.3 / +4.2 |
|
Precipitation Data |
|
|
|
|
|
Monthly Precipitation / Departure from Normal |
1.88 / +0.14 |
5.15 / +3.43 |
1.21 / -0.31 |
0.85 / -0.68 |
|
Most Precipitation in 24 hours / Date |
0.89 / 2nd |
3.51 / 2nd |
0.68 / 13th |
0.48 / 1st |
|
Monthly Snowfall / Departure from Normal |
0.0 / +0.0 |
0.0 / +0.0 |
0.0 / +0.0 |
0.0 / +0.0 |
|
Most Snow in 24 hours / Date |
N/A |
N/A |
N/A |
N/A |
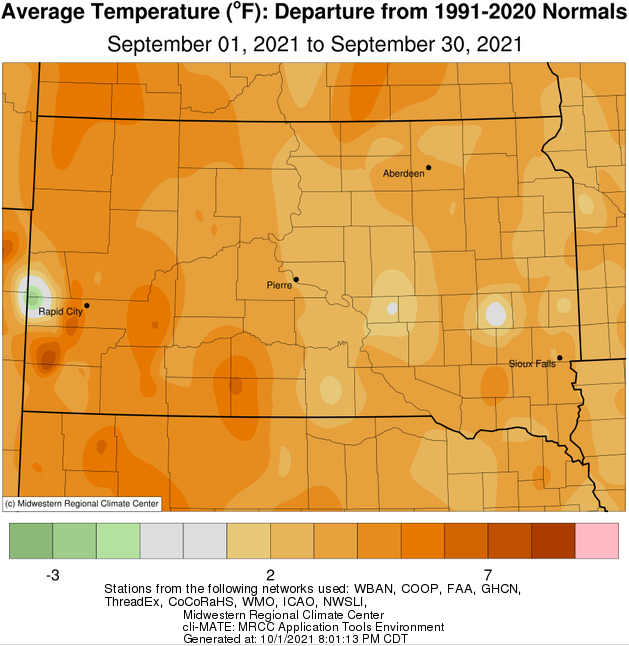
Average temperature departures from normal for September 2021, courtesy of the Midwestern Regional Climate Center
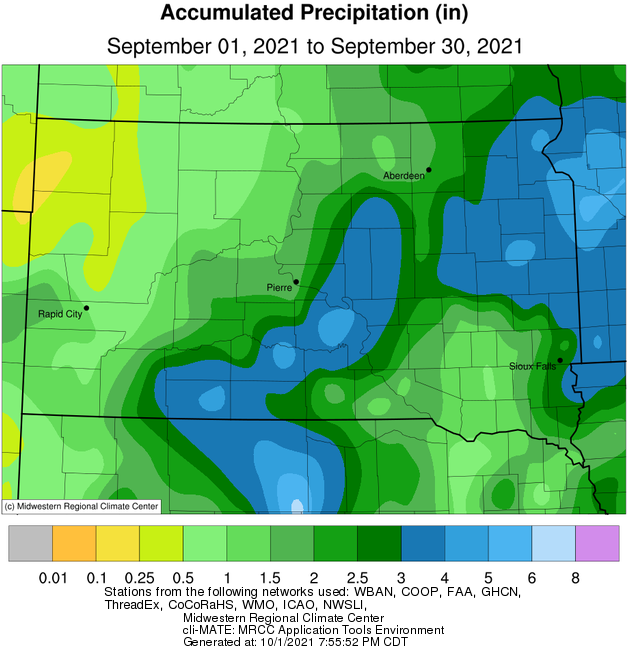
Total precipitation for September 2021, courtesy of the Midwestern Regional Climate Center
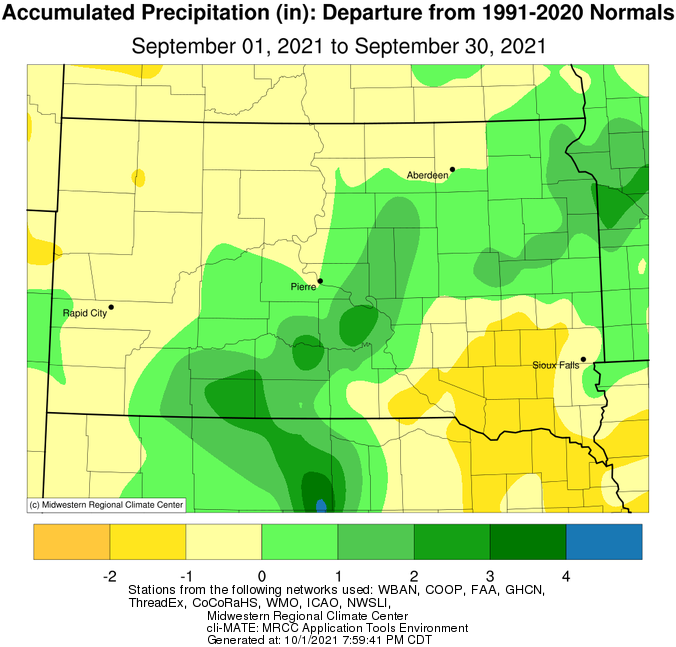
Precipitation departures from normal for September 2021, courtesy of the Midwestern Regional Climate Center
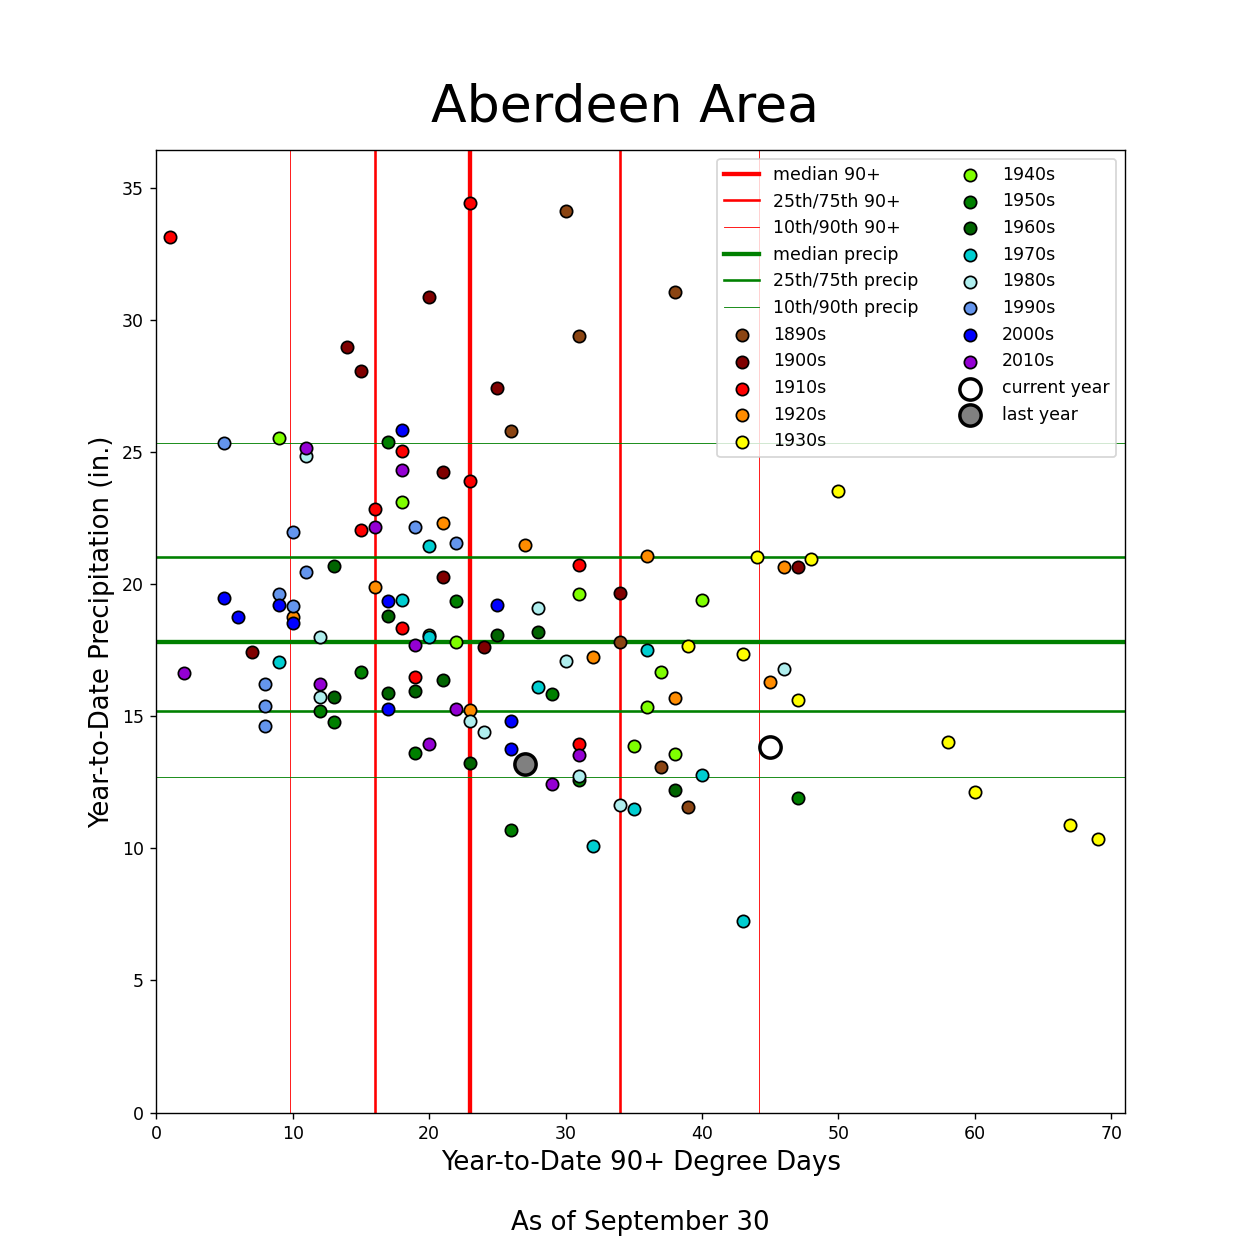
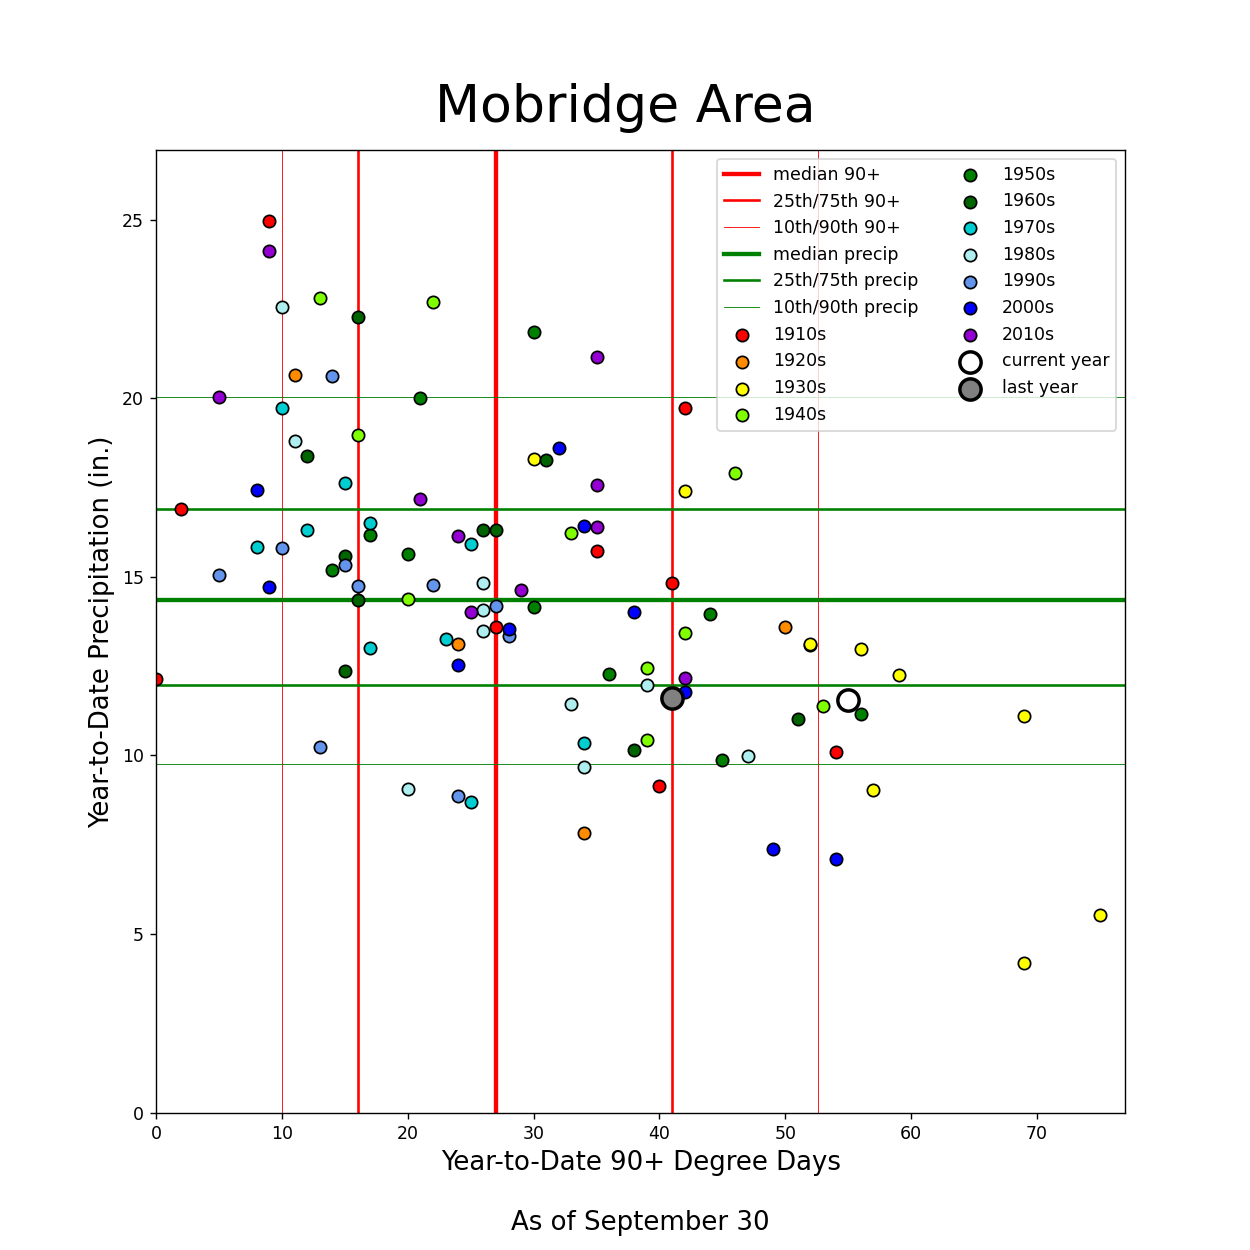
Year-to-date information (as of Sept 30) regarding number of 90+ degree days (horizontal axis) and precipitation totals (vertical axis) for Aberdeen and Mobridge. The large white dot represents this year, whereas the smaller dots other years in the historical database. The intersection of the thick red and thick green lines represents a climatologically normal year, so the further away from this center the more anomalous the year. This information for additional locations can be found here.
Graph showing the number of 90+ degree days by year at Aberdeen and Mobridge.
Drought conditions around the beginning (left) and end (right) of the month, from the US Drought Monitor.
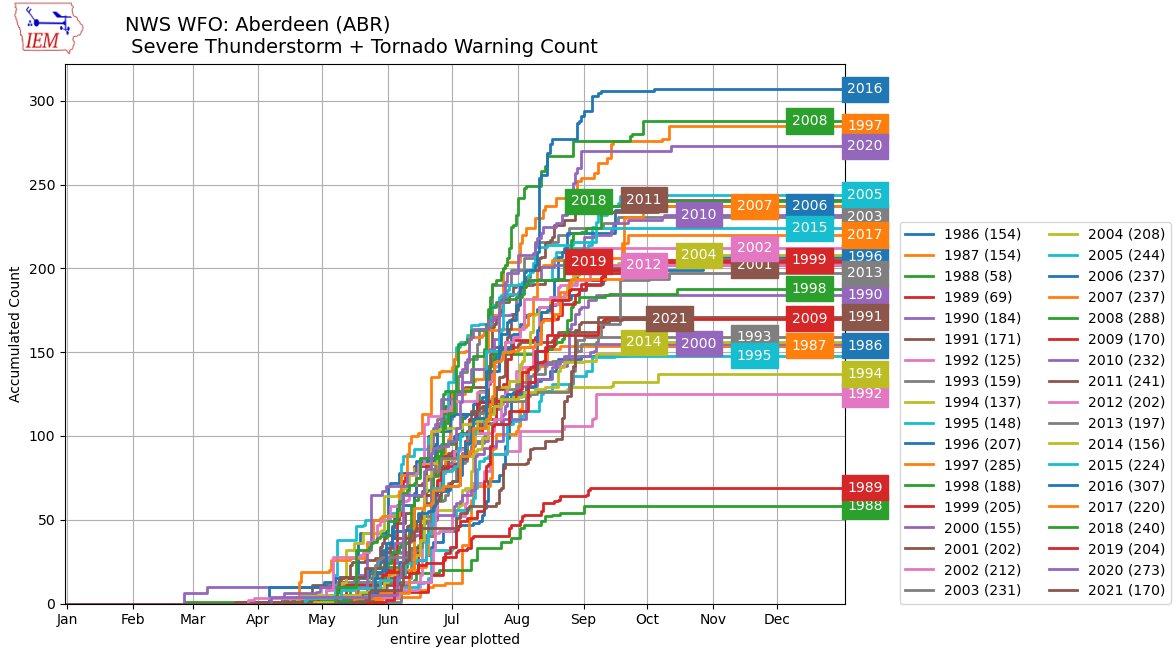
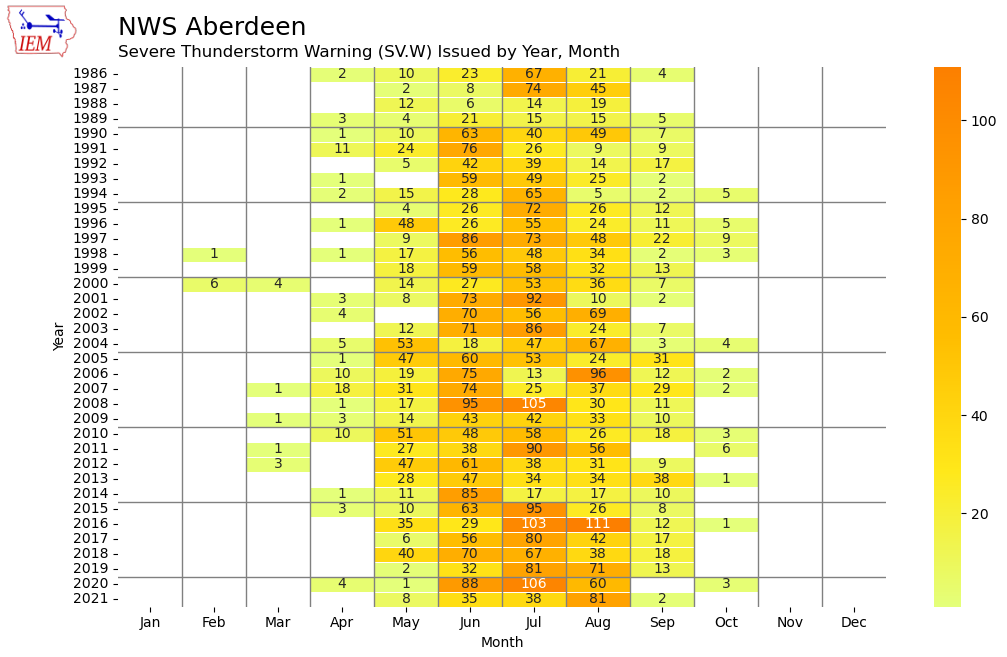
Top plot: combined Severe Thunderstorm and Tornado Warnings issued by NWS Aberdeen, SD since 1986 (35 year record). Bottom plot: number of Severe Thunderstorm Warnings issued per month per year. Both courtesy of ISU's Iowa Environmental Mesonet. 2021 has had the fewest warnings since 2014.