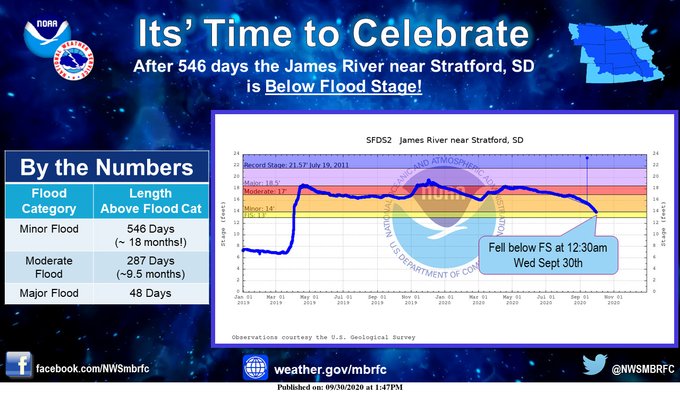
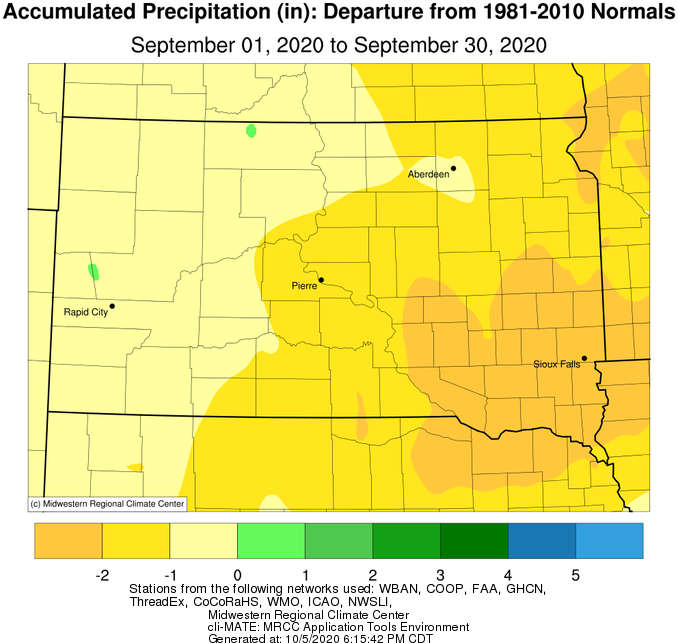
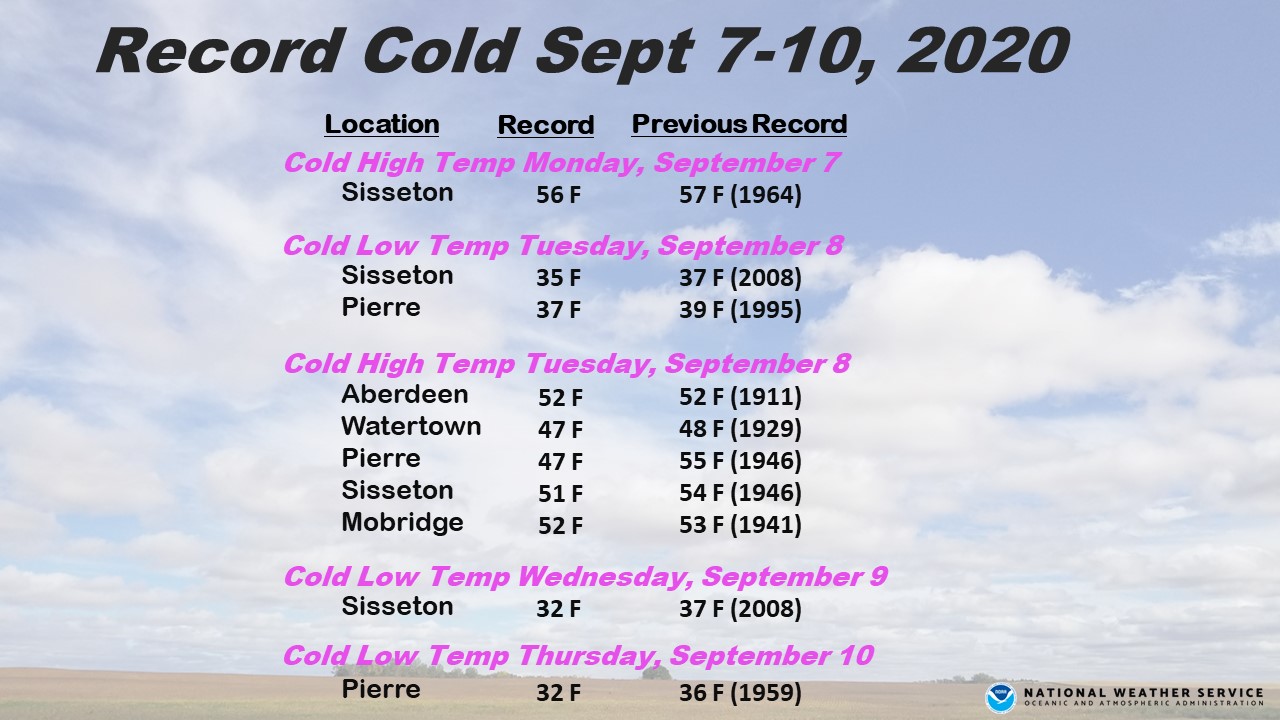
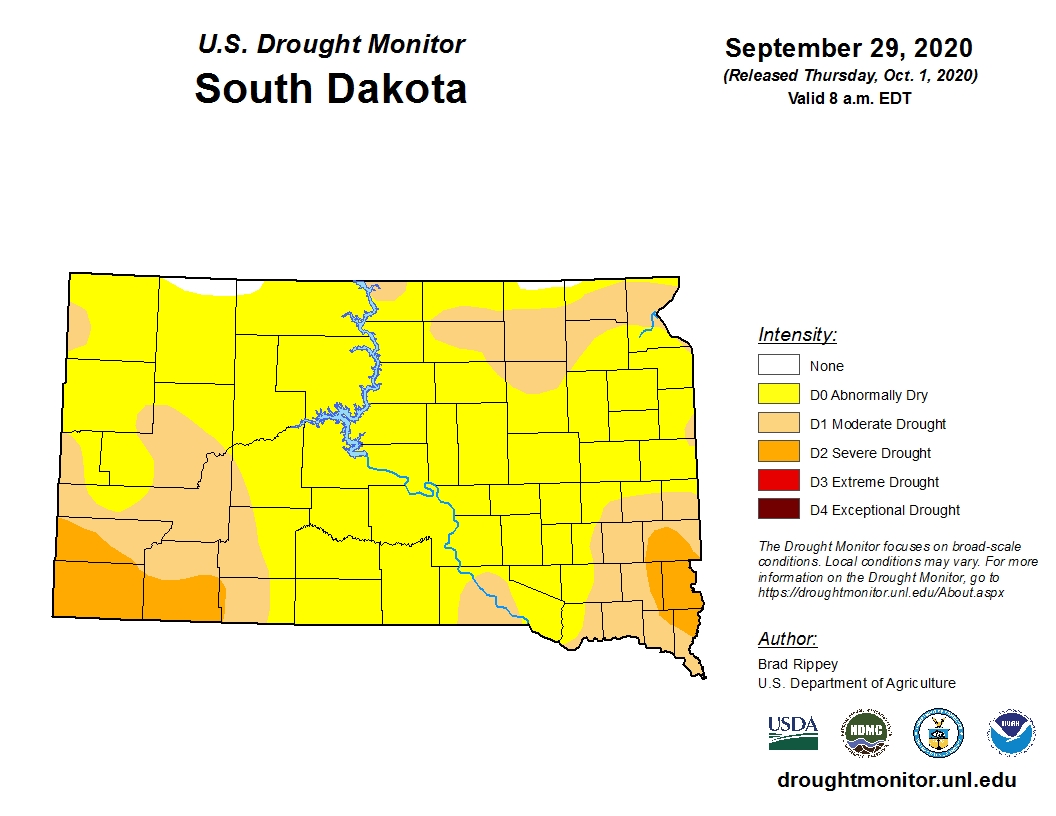
September 2020 finished close to average temperature-wise on a whole across the area. That said, there were some large temperature swings. Namely, a record cold stretch from the 7th through the 11th in which many observed their first frost of the season (fairly early climatologically speaking), and a much above average stretch from the 20th through the 26th. Very little in the way of precipitation fell, with all locations recording between 0 and 3 inches of below average rainfall, and abnormally dry and/or moderate drought conditions persisted as a result. Thanks to the dry conditions, the James River at Stratford finally fell below flood stage during the early morning of the 30th, after a record 546 consecutive days which began on April 3rd, 2019. Several windy days with gusts of 40-60 mph occurred towards the end of the month, which raised fire weather concerns. Smoke from significant California fires drifted aloft across the Northern Plains for many days this September as well, thanks to upper-level winds. There were a couple days where enough smoke made it to the surface to reduce visibility below 6 miles for some, including on the 20th at Aberdeen and Watertown. Also of note this September, no reports of severe weather were logged. This was the first time since 2011 where our weather forecast office didn’t issue a single convective warning (severe thunderstorm or tornado), and only the 4th time since 1986.
|
September 2020 |
||||
|
Temperature Data |
Aberdeen |
Sisseton |
Wheaton |
Watertown |
|
Warmest Temperature / Date |
87 / 2, 21, 22nd |
85 / 21, 22nd |
85 / 22nd |
84 / 22nd |
|
Coldest Temperature / Date |
32 / 9, 10th |
32 / 9th |
35 / 9, 10th |
32 / 10th |
|
Average High / Departure from Normal |
74.0 / +1.9 |
71.9 / -0.3 |
70.1 / -1.0 |
70.7 / +0.1 |
|
Average Low / Departure from Normal |
46.4 / +0.7 |
46.7 / -0.6 |
47.8 / +0.2 |
47.6 / +0.2 |
|
Monthly Average / Departure from Normal |
60.2 / +1.3 |
59.3 / -0.4 |
59.0 / -0.3 |
59.1 / +0.1 |
|
Precipitation Data |
|
|
|
|
|
Monthly Precipitation / Departure from Normal |
1.54 / -0.65 |
1.05 / -1.49 |
0.78 / -2.31 |
1.05 / -1.59 |
|
Most Precipitation in 24 hours / Date |
0.70 / 7th |
0.72 / 11th |
0.49 / 11th |
0.48 / 7th |
|
Monthly Snowfall / Departure from Normal |
N/A |
N/A |
N/A |
N/A |
|
Most Snow in 24 hours / Date |
N/A |
N/A |
N/A |
N/A |
|
Temperature Data |
Pierre |
Kennebec |
Mobridge |
Timber Lake |
|
Warmest Temperature / Date |
97 / 14th |
94 / 2, 14th |
96 / 2nd |
91 / 2nd |
|
Coldest Temperature / Date |
32 / 10th |
32 / 10th |
31 / 9th |
27 / 9th |
|
Average High / Departure from Normal |
77.8 / +1.3 |
81.4 / +2.2 |
76.0 / +2.1 |
75.7 / +0.7 |
|
Average Low / Departure from Normal |
48.1 / -1.1 |
47.7 / -1.6 |
48.3 / +0.7 |
46.5 / -0.9 |
|
Monthly Average / Departure from Normal |
63.0 / +0.1 |
64.9 / +0.6 |
62.2 / +1.5 |
61.3 / +0.1 |
|
Precipitation Data |
|
|
|
|
|
Monthly Precipitation / Departure from Normal |
0.29 / -1.58 |
0.43 / -1.34 |
1.01 / -0.53 |
0.82 / -0.62 |
|
Most Precipitation in 24 hours / Date |
0.17 / 7th |
0.25 / 8th |
0.88 / 7th |
0.74 / 7th |
|
Monthly Snowfall / Departure from Normal |
N/A |
N/A |
N/A |
N/A |
|
Most Snow in 24 hours / Date |
N/A |
N/A |
N/A |
N/A |
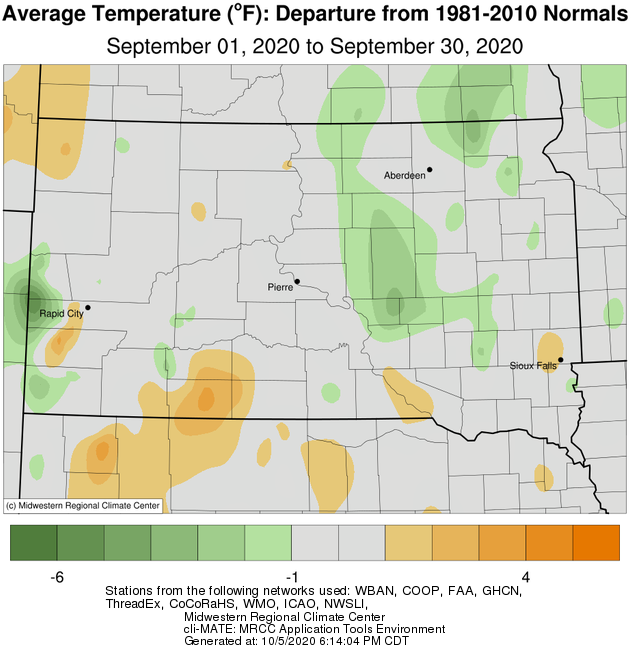
Average September temperature departures from normal, from the Midwestern Regional Climate Center
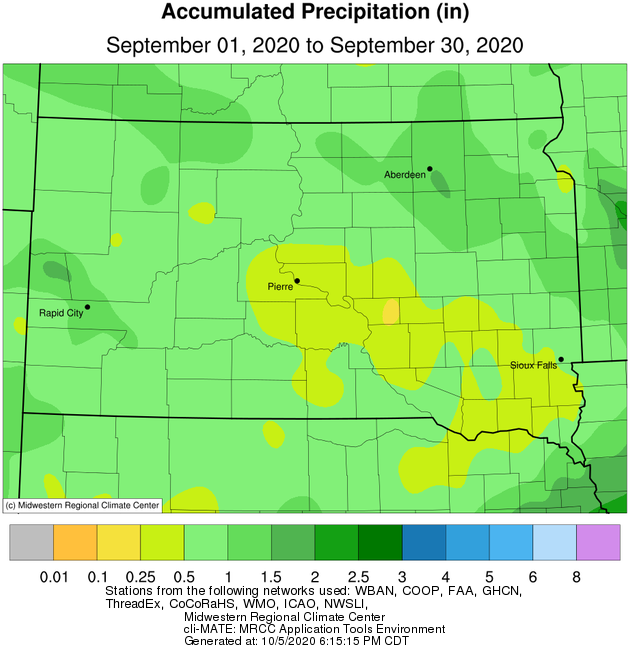
Total September precipitation (left) and departures from normal (right), from the Midwestern Regional Climate Center
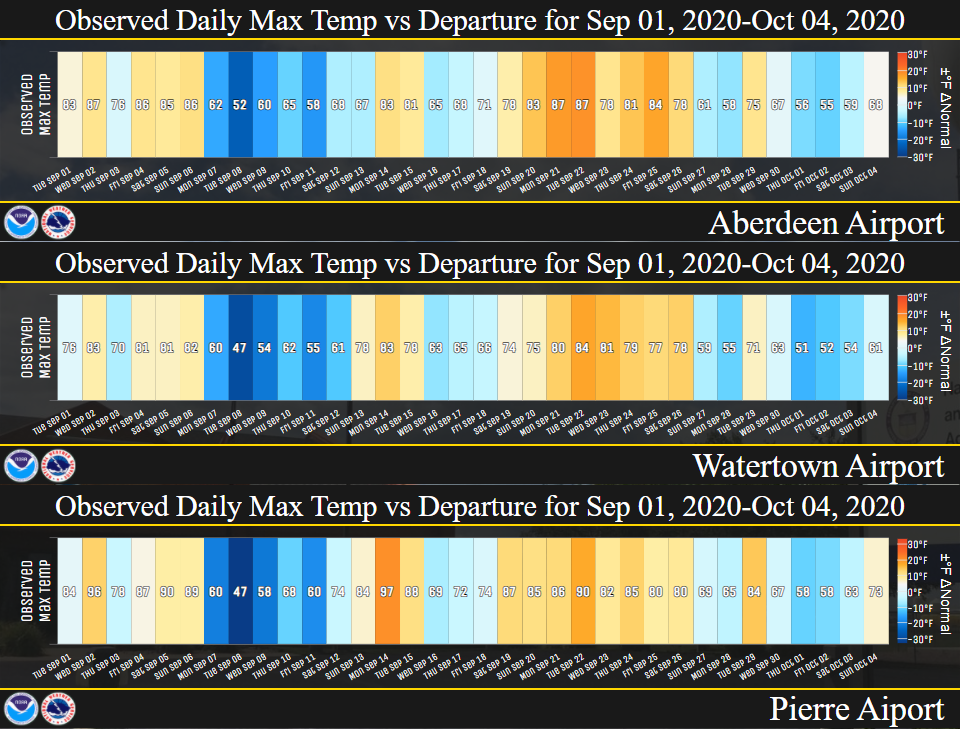
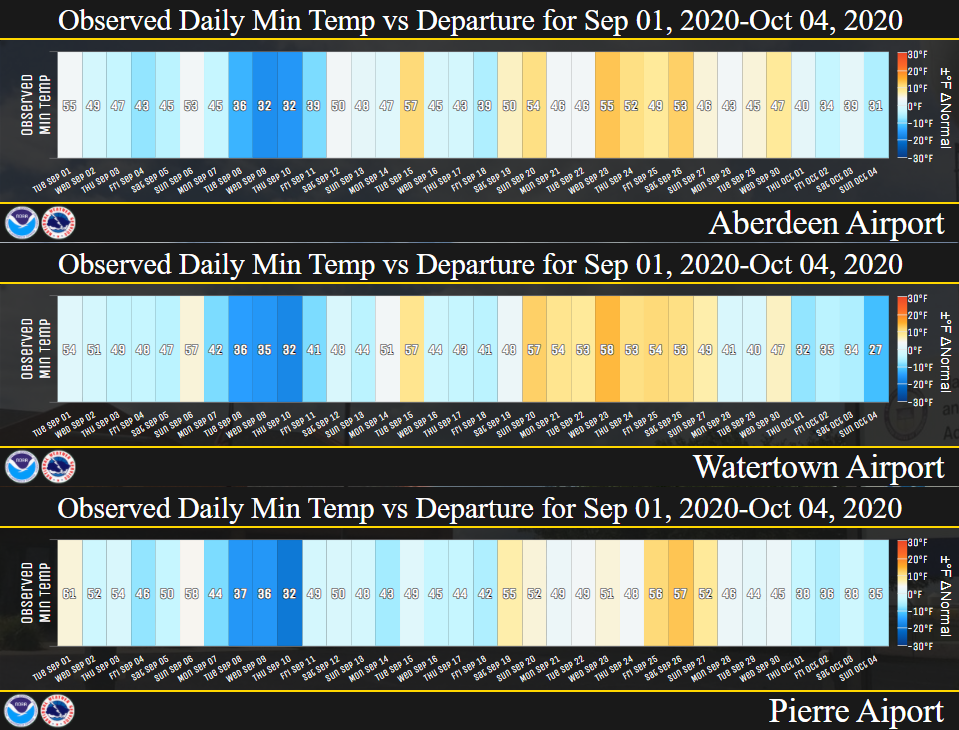
Daily high (top graphic) and low (bottom graphic) temperatures (values) and departures from normal (colors) during September for Aberdeen, Watertown and Pierre
Daily cold records set from the 7th through the 10th
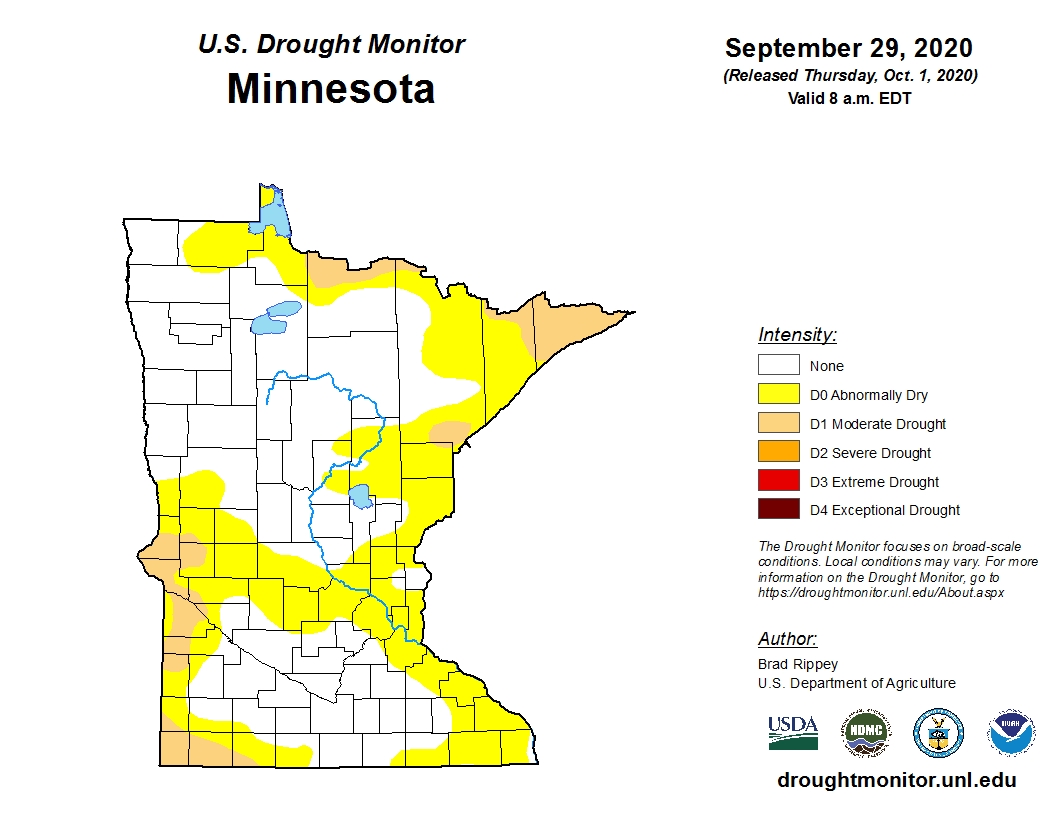
Drought conditions as of September 29th for South Dakota and Minnesota
Record hydrograph for the James River at Stratford. Graphic created by the NWS Missouri Basin River Forecast Center