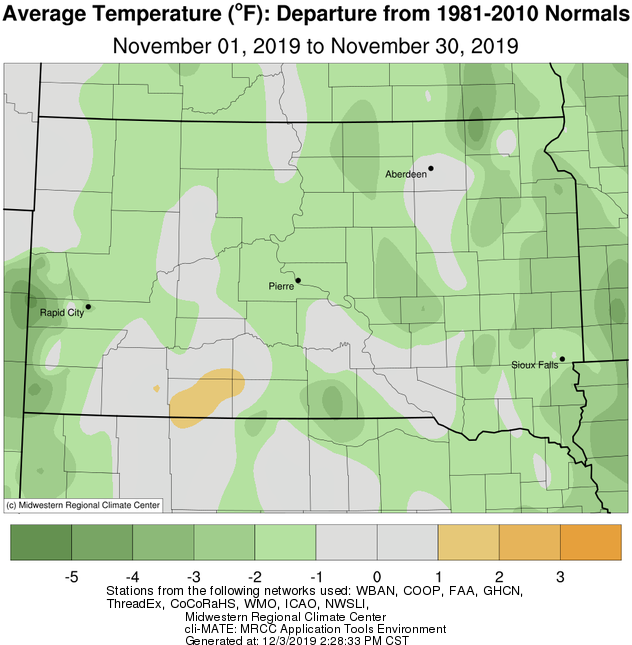
November 2019 was a tale of two halves in terms of temperatures. The area started out much below average (Sisseton set a record low max temp of 13 F on the 11th and a record low temp of 0 F on the 12th), but then flipped to much above average. The end result was near average temperatures on a whole for the month.
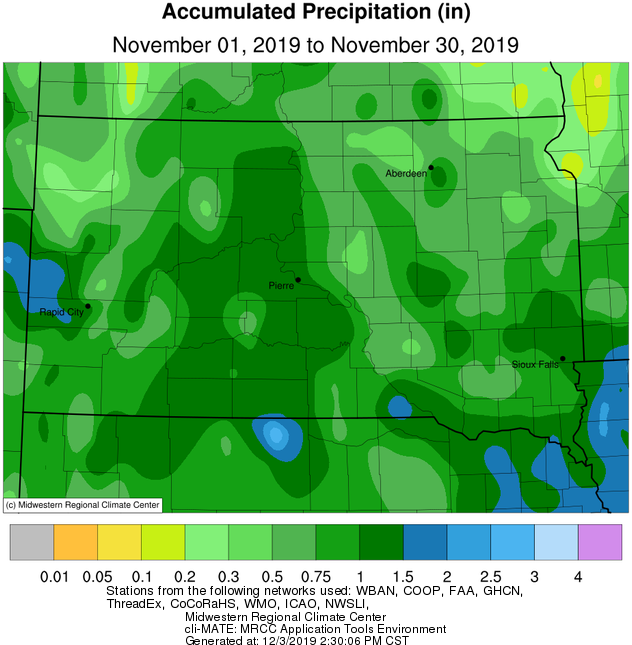
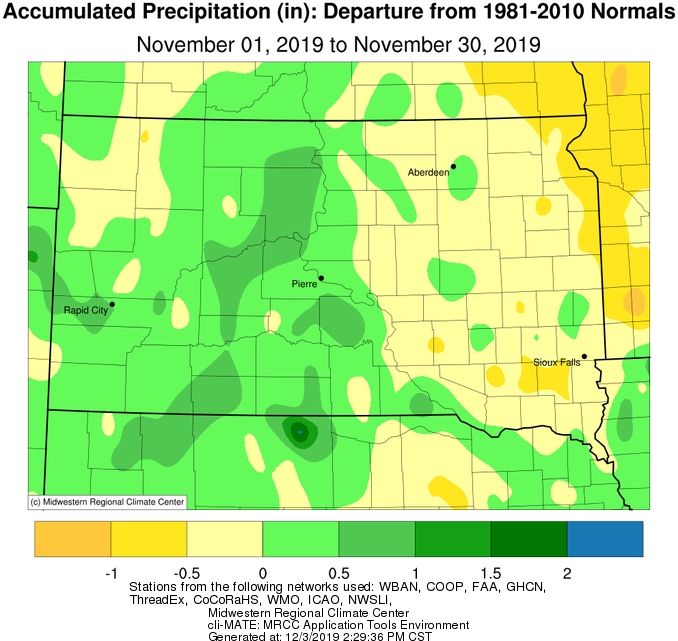
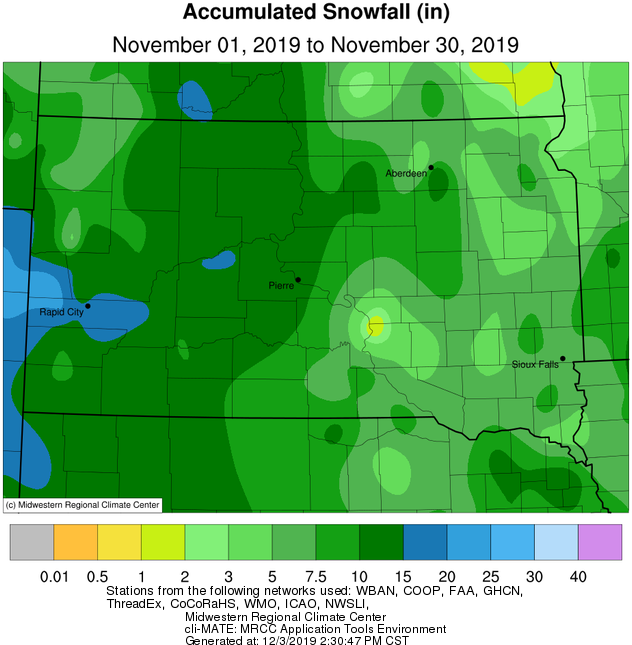
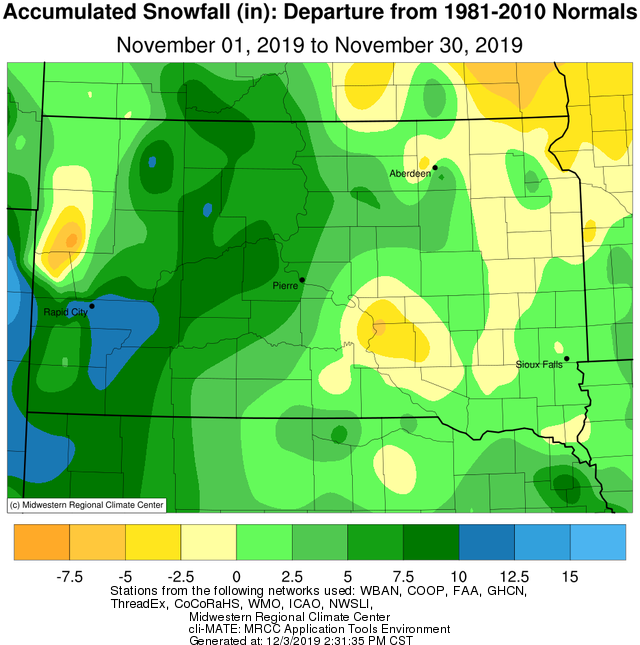
November was predominantly quite dry, and the whole area would have finished below average for the month in terms of precipitation and snow if not for a major storm at the end of the month. As it turns out, much of central South Dakota finished above average in both regards, far northeastern South Dakota and west central Minnesota finished below average, and those in-between finished near normal. The major storm in reference here is the Nov 29-Dec 1 Post-Thanksgiving winter storm, when significant impacts resulted from heavy snow and strong winds (for more: https://www.weather.gov/abr/Nov29-Dec1Post-ThanksgivingWinterStorm). Several daily records were broken. For precipitation: In Aberdeen, 0.21" of liquid equivalent fell on the 29th (0.21 in 2016) and 1.09" of liquid equivalent fell on teh 30th (0.55" in 2000); in Sisseton, 0.44" fell on the 30th (0.32" in 2015); in Mobridge, 0.13" fell on the 29th (0.11" in 2011) and 0.77" fell on the 30th (0.25" in 2015). For snow: In Aberdeen, 14.3" of snow fell on the 30th (10.5" in 2000); in Sisseton, 7.8" of snow fell on the 30th (4.5" in 2015); in Mobridge, 6.2" of snow fell on the 30th (3" in 1985). Thanks in large part to this storm, Aberdeen ranked 8th for snowiest November on record with 17.7”, Kennebec 8th with 14.5”, Timber Lake 7th with 12.6”, Pierre 6th with 11.6” and Mobridge 6th with 12.2”. Amazingly, after being impacted by both the October 10-12th and Nov 29-Dec1st winter storms, Eureka has already reported 29.6” of snow for the season as of *Dec 3rd*. Their average for the whole season is 43.2”.
This winter storm and other precipitation events this month further contribute to an incredibly wet year, and add to concerns about potential spring 2020 flooding. Updated rankings for total year-to-date precipitation through November 30th:
Aberdeen: 29.48” ranks 11th, Wheaton: 30.08” ranks 11th, Watertown: 32.34” ranks 2nd (38.67” in 1977), Timber Lake: 29.61” ranks 2nd (33.45” in 1915), Pierre: 29.94” ranks 2nd (31.80” in 1997), Mobridge: 28.83” ranks 1st (26.76” in 1915), Sisseton: 33.89” ranks 1st (32.21” in 2005), Kennebec: 34.99” ranks 1st (29.65” in 1915)
Updated rankings of total yearly precipitation through November 30th (every additional hundredth of precipitation from now through the remaining 31 days of the calendar year will only add to these rankings/records):
Wheaton: 30.08” ranks 12th, Aberdeen: 29.48” ranks 11th, Timber Lake: 29.61” ranks 2nd (34.10” in 1915), Pierre: 29.94” ranks 2nd (31.85” in 1997), Watertown: 32.34” ranks 2nd (40.04” in 1977), Mobridge: 28.83” ranks 1st (26.86” in 1915), Sisseton: 33.89” ranks 1st (32.30 in 1993), Kennebec: 34.99” ranks 1st (30.25” in 1915)
|
November 2019 |
||||
|
Temperature Data |
Aberdeen |
Sisseton |
Wheaton |
Watertown |
|
Warmest Temperature / Date |
60°/ 24th |
54°/ 24th |
54°/17th, 25th |
50°/ 24th |
|
Coldest Temperature / Date |
-3°/ 11th |
0°/ 11th, 12th |
0°/ 12th |
-1°/ 12th |
|
Average High / Departure from Normal |
39.7°/ +0.1° |
37.1°/ -3.1° |
36.6°/ -2.0° |
36.4°/ -2.6° |
|
Average Low / Departure from Normal |
20.1°/ +1.2° |
21.3°/ -0.2° |
20.9°/ +0.5° |
20.7°/ +0.1° |
|
Monthly Average / Departure from Normal |
29.9°/ +0.6° |
29.2°/ -1.6° |
28.8°/ -0.7° |
28.5°/ -1.3° |
|
Precipitation Data |
||||
|
Monthly Precipitation / Departure from Normal |
1.66”/ +0.93” |
0.52”/ -0.06” |
0.24”/ -0.89” |
0.59”/ -0.17” |
|
Most Precipitation in 24 hours / Date |
1.09”/ 30th |
0.44”/ 30th |
0.18”/ 30th |
0.21”/ 30th |
|
Monthly Snowfall / Departure from Normal |
17.7”/ +10.7” |
8.4” / +1.1 |
1.8” / -2.8” |
3.1” / -1.8” |
|
Most Snow in 24 hours / Date |
14.3” / 30th |
7.8” / 30th |
1.8” / 30th |
1.8” / 30th |
|
Temperature Data |
Pierre |
Kennebec |
Mobridge |
Timber Lake |
|
Warmest Temperature / Date |
66°/ 9th |
66°/ 9th |
63°/ 24th |
57°/ 9th, 24th |
|
Coldest Temperature / Date |
-3°/ 11th |
-1°/ 12th |
-5°/ 11th |
-2°/ 11th |
|
Average High / Departure from Normal |
43.1°/ -1.0° |
44.8°/ -0.7° |
41.7°/ -1.1° |
39.6°/ -2.3° |
|
Average Low / Departure from Normal |
21.9°/ -1.4° |
22.4°/ -0.2° |
20.8°/ -0.3° |
21.1°/ -0.1° |
|
Monthly Average / Departure from Normal |
32.5°/ -1.2° |
33.6°/ -0.4° |
31.2°/ -0.7° |
30.4°/ -1.1° |
|
Precipitation Data |
||||
|
Monthly Precipitation / Departure from Normal |
1.07”/ +0.31” |
1.58”/ +0.86” |
1.34”/ +0.86” |
1.17”/ +0.93” |
|
Most Precipitation in 24 hours / Date |
0.31”/ 30th |
1.28”/ 30th |
0.77”/ 30th |
0.63”/ 30th |
|
Monthly Snowfall / Departure from Normal |
11.6” / +6.3” |
14.5” / +8.2 |
12.2” / +7.5 |
12.6” / +1.4 |
|
Most Snow in 24 hours / Date |
3.3” / 30th |
12.5” / 30th |
6.2” / 30th |
6.9” / 30th |
Monthly temperature departures on a whole, from the Midwestern Regional Climate Center
Monthly precipitation totals (left) and departures (right), from the Midwestern Regional Climate Center
Monthly snowfall totals (left) and departures (right), from the Midwestern Regional Climate Center
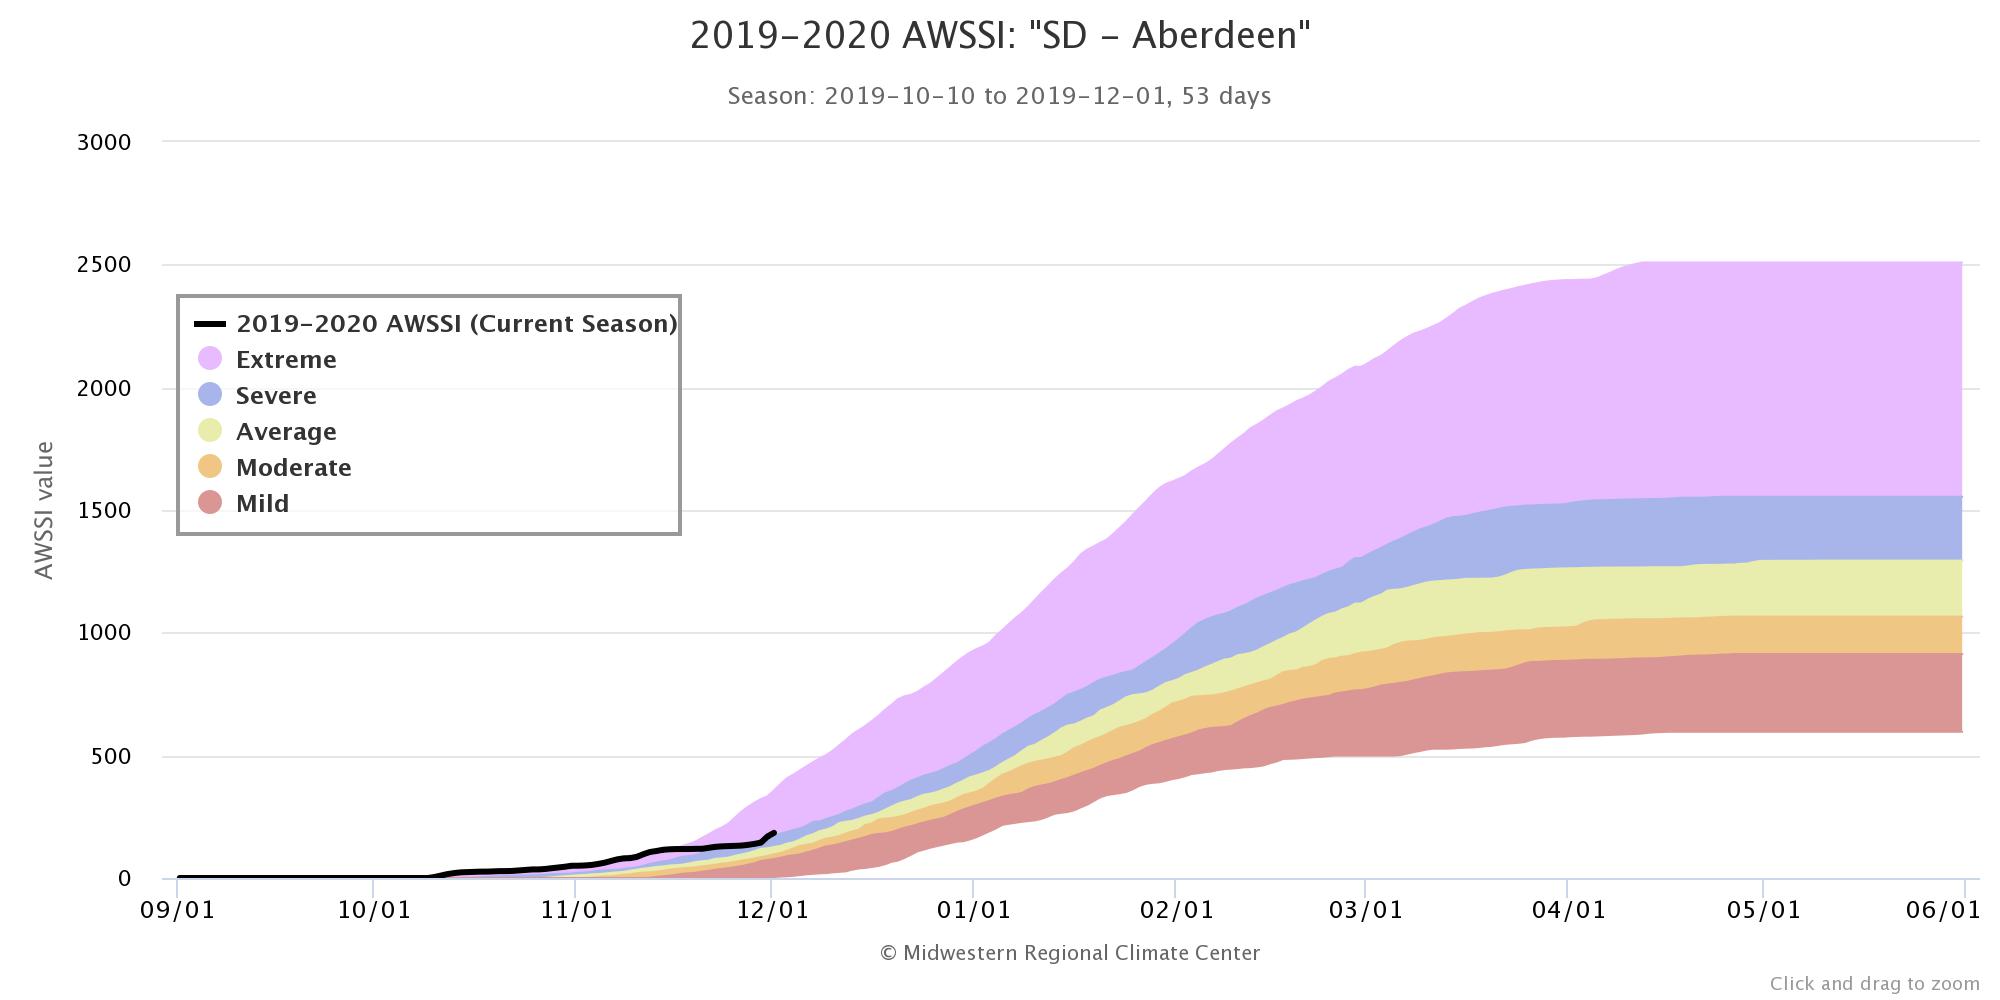
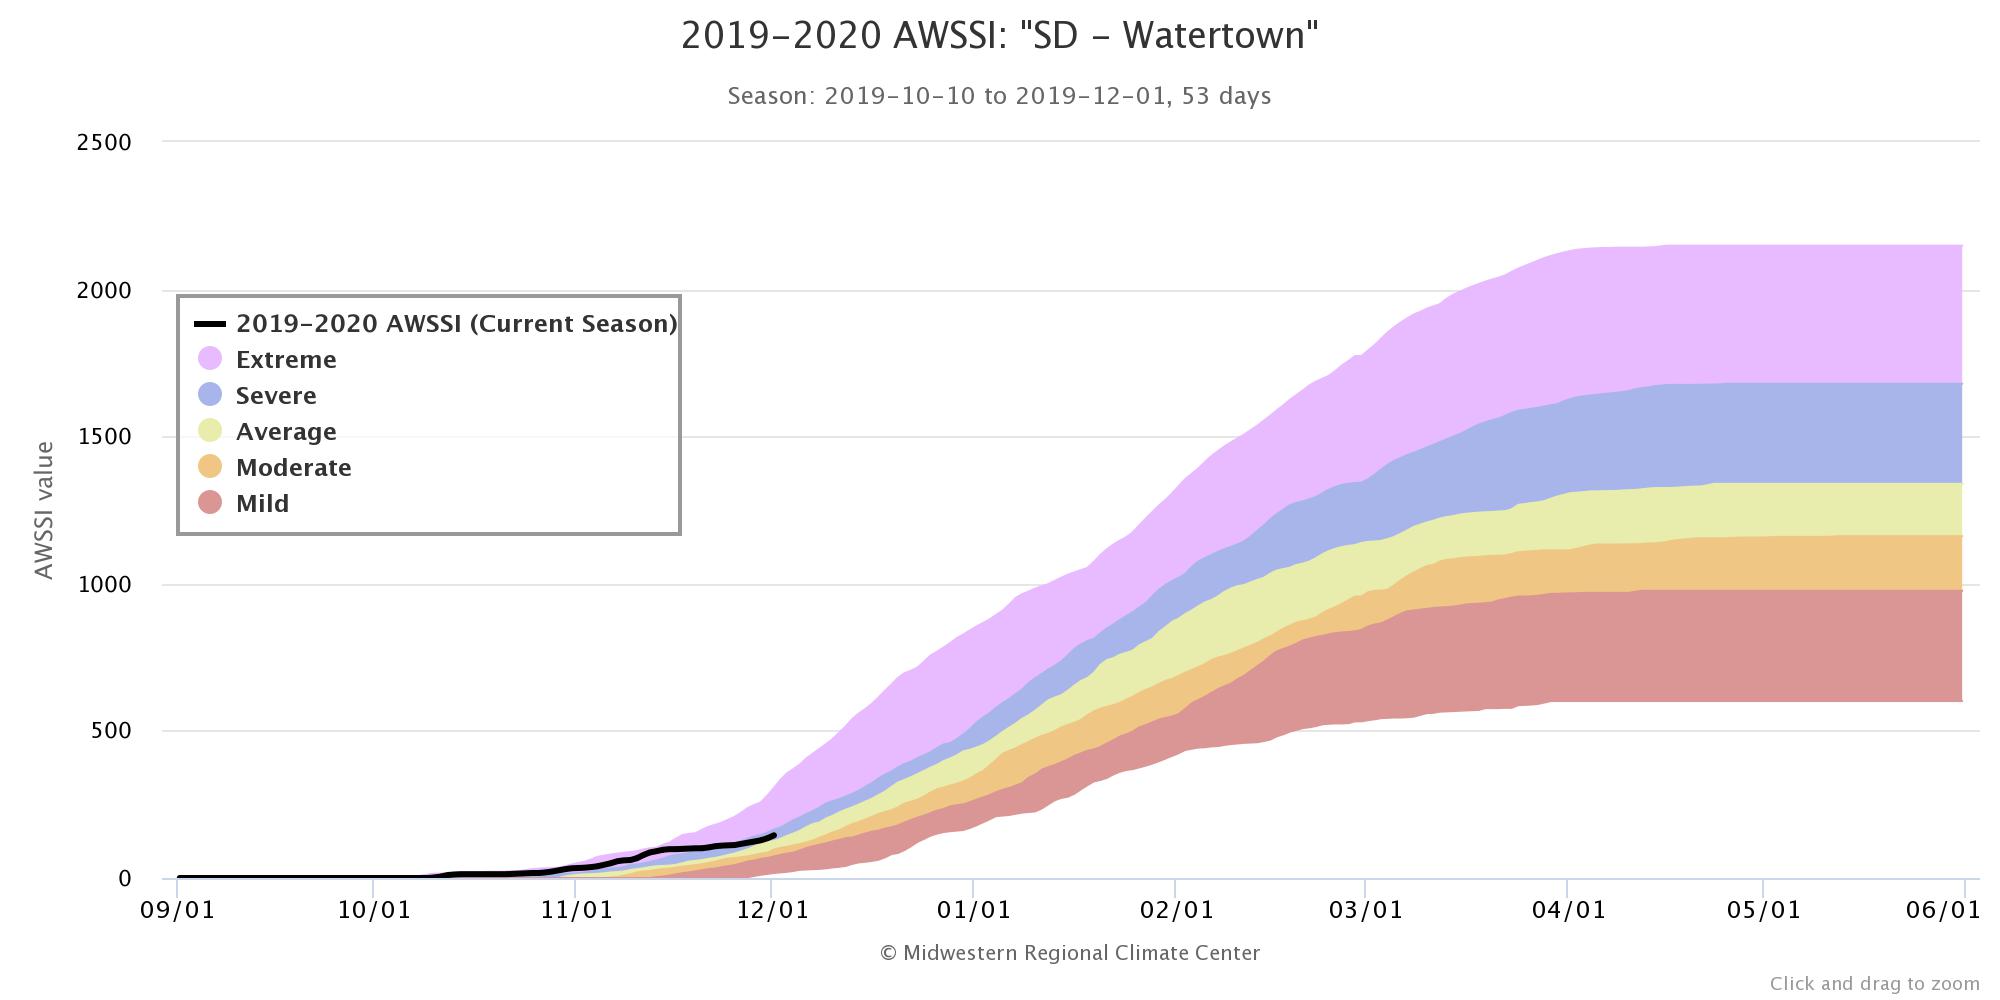
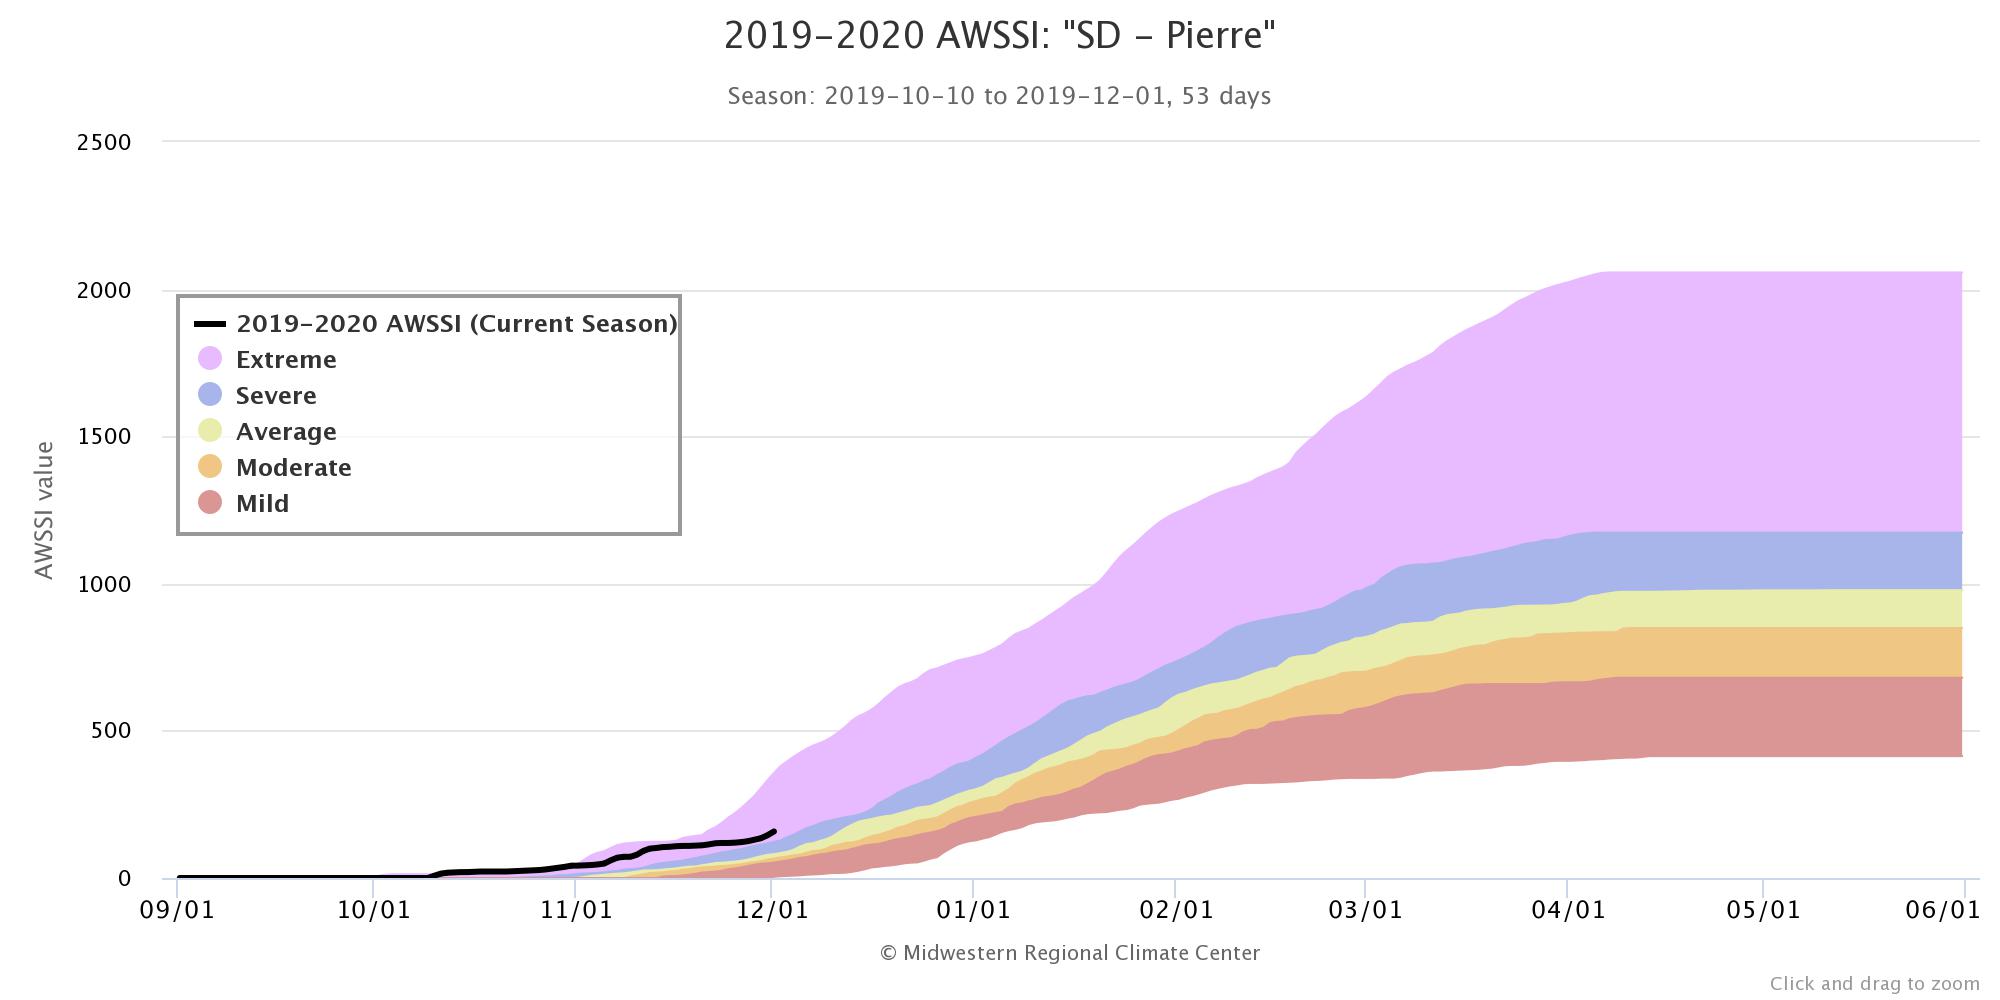
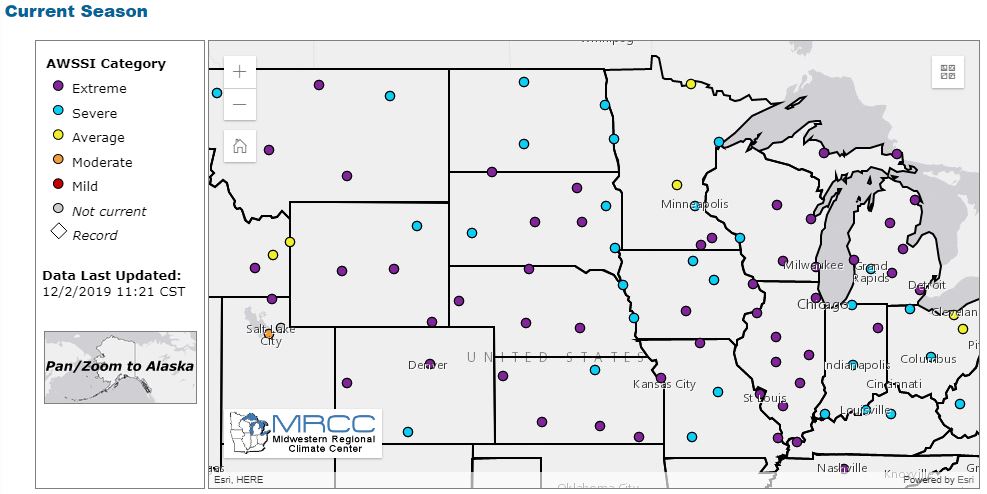
The Accumulated Winter Season Severity Index from the Midwestern Regional Climate Center ranks this season as "Severe" to "Extreme" across the region. This index takes into account max/min temperatures, snowfall, and snow depth or precipitation.
A more in-depth look at three specific sites, Aberdeen, Watertown and Pierre, can be found below: