Thanks to much above average temperatures from the 1-4th/5th and 21-28th (even a couple instances of daily record-breaking heat), July 2021 finished above average overall across the region by between 1 and 4 degrees. This will go down as the 6th warmest July on record at Mobridge. While dewpoints were low during the beginning of the month, they increased substantially by the end into the 70s. This lead to muggy conditions in addition to the heat, meaning high heat index values in the 100s for a number of days across the area. On July 28th, Aberdeen reached an air temperature of 101 F, and the inside of a vehicle at our office reached 127 F! A reminder how unsafe the inside of vehicles are for any period of time during the summer.
Pierre reached 100° F on 8 days this month, 4 of which were consecutive (25-28th), the longest streak since July 21-25th, 2007. Similarly, Mobridge reached 100° F 6 times, 3 consecutive (25-27th), the longest streak since July 21-25th, 2007. Aberdeen reached 90° F for 11 consecutive days (18-28th), which ties for the 7th longest streak on record. Furthermore, Aberdeen has observed 32 days this year with a high temperature of at least 90° F, which is already the most in any full year since 1988 (46 days total). Sisseton has observed 25 90° F days, already the most since 1988 (38 days total). Mobridge has observed 11 days this year with a high temperature of at least 100° F, which is already the most in any year since 1959 (12). Similarly, Aberdeen has already observed 7 100° F days, already the most since 1988 (14 total).
Precipitation-wise, while the area did see rounds of showers and thunderstorms through the month (including a widespread rain event on the 5-6th) totaling generally to between 1 and 4 inches, most locations finished below average. Severe weather was lacking as well, with only two more concentrated events: wind near the ND/SD border on the evening of July 23rd, and large to significantly large hail across the area on July 25th. Find much more information about the hail event at this event storm summary page: https://www.weather.gov/abr/July25LargeHail2021.
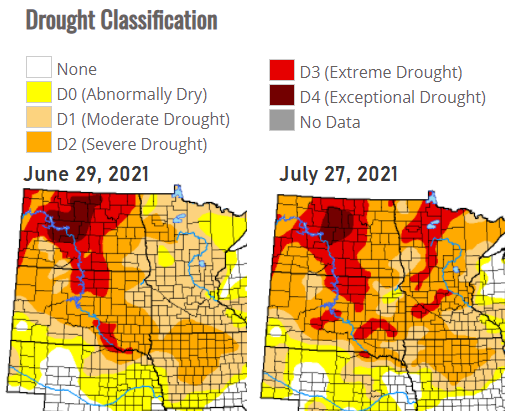
Drought conditions remained in place across the area, with only local improvement or worsening. North Central South Dakota remains the largest area affected by D3/Extreme Drought as of August 1st. Due to the heat and dry conditions, fire weather remained a concern through the month as well - many fires ignited across the area during/around the 4th of July due to fireworks. Finally, smoke transported aloft from Western US and Canadian wildfires was a common sight this July, leading to milky afternoon skies and red sunsets. A cold front swept smoke southward from Canadian fires, keeping it at the surface late in the month. As a result, July 29-30th featured reduced visibility to 1-2 miles or less, a strong smell of smoke, and unhealthy air quality for all people spending time outdoors, as determined by the Air Quality Index. Air quality alerts were in affect for some as well.
|
July 2021 |
||||
|
Temperature Data |
Aberdeen |
Sisseton |
Wheaton |
Watertown |
|
Warmest Temperature / Date |
101 / 28th |
98 / 23rd |
93 / 23rd |
98 / 28th |
|
Coldest Temperature / Date |
54 / 15th |
55 / 15th |
55 / 7th |
53 / 15th |
|
Average High / Departure from Normal |
88.3 / +3.4 |
85.8 / +2.7 |
84.0 / +1.6 |
84.2 / +2.2 |
|
Average Low / Departure from Normal |
62.4 / +2.7 |
62.2 / +2.4 |
63.2 / +0.8 |
61.3 / +1.3 |
|
Monthly Average / Departure from Normal |
75.3 / +3.0 |
74.0 / +2.6 |
73.6 / +1.2 |
72.8 / +1.8 |
|
Precipitation Data |
|
|
|
|
|
Monthly Precipitation / Departure from Normal |
1.43 / -1.66 |
2.81 / -0.68 |
3.20 / -0.32 |
2.68 / -0.37 |
|
Most Precipitation in 24 hours / Date |
0.51 / 6th |
1.03 / 23rd |
2.14 / 26th |
1.54 / 6th |
|
Monthly Snowfall / Departure from Normal |
0.0 / +0.0 |
0.0 / +0.0 |
0.0 / +0.0 |
0.0 / +0.0 |
|
Most Snow in 24 hours / Date |
N/A |
N/A |
N/A |
N/A |
|
Temperature Data |
Pierre |
Kennebec |
Mobridge |
Timber Lake |
|
Warmest Temperature / Date |
108 / 27th |
107 / 28, 29th |
104 / 3rd |
103 / 27th |
|
Coldest Temperature / Date |
56 / 11, 15th |
53 / 11th |
59 / 11, 13th |
57 / 7, 13th |
|
Average High / Departure from Normal |
92.1 / +3.8 |
92.3 / +2.6 |
90.9 / +3.5 |
88.8 / +2.9 |
|
Average Low / Departure from Normal |
64.0 / +2.4 |
62.9 / +1.5 |
66.0 / +4.4 |
62.8 / +3.4 |
|
Monthly Average / Departure from Normal |
78.0 / +3.1 |
77.8 / +2.2 |
78.5 / +4.0 |
76.0 / +3.3 |
|
Precipitation Data |
|
|
|
|
|
Monthly Precipitation / Departure from Normal |
2.39 / +0.00 |
3.15 / +0.31 |
2.08 / -0.25 |
2.10 / -0.75 |
|
Most Precipitation in 24 hours / Date |
0.82 / 5th |
1.16 / 6th |
0.62 / 5th |
1.12 / 6th |
|
Monthly Snowfall / Departure from Normal |
0.0 / +0.0 |
0.0 / +0.0 |
0.0 / +0.0 |
0.0 / +0.0 |
|
Most Snow in 24 hours / Date |
N/A |
N/A |
N/A |
N/A |
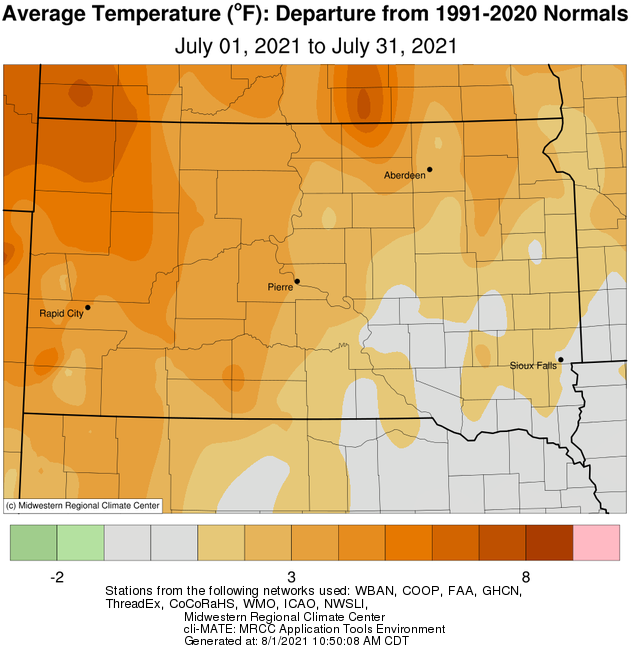
July 2021 averaged temperature's departure from normal, courtesy of the Midwestern Regional Climate Center
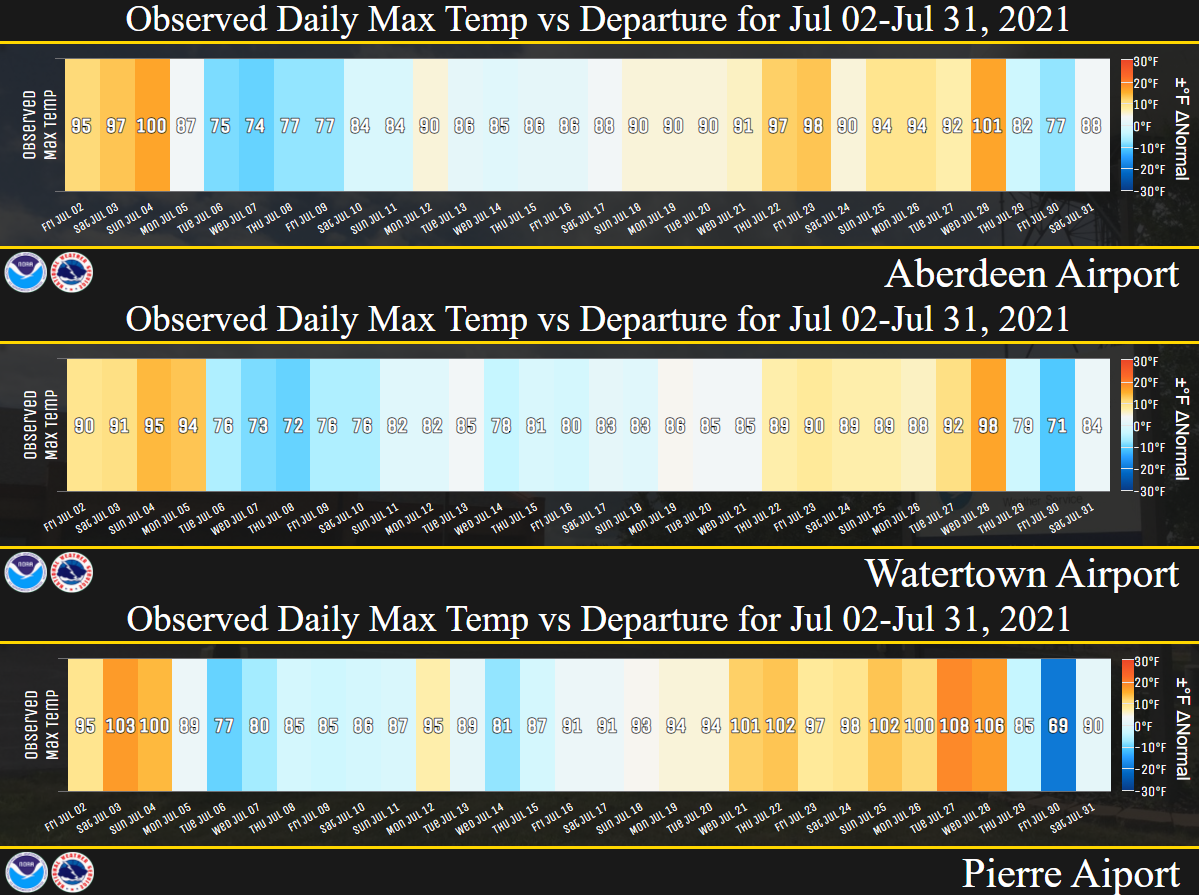
Daily high temperatures at Aberdeen, Watertown and Pierre (value) and their departures from normal (color shading)
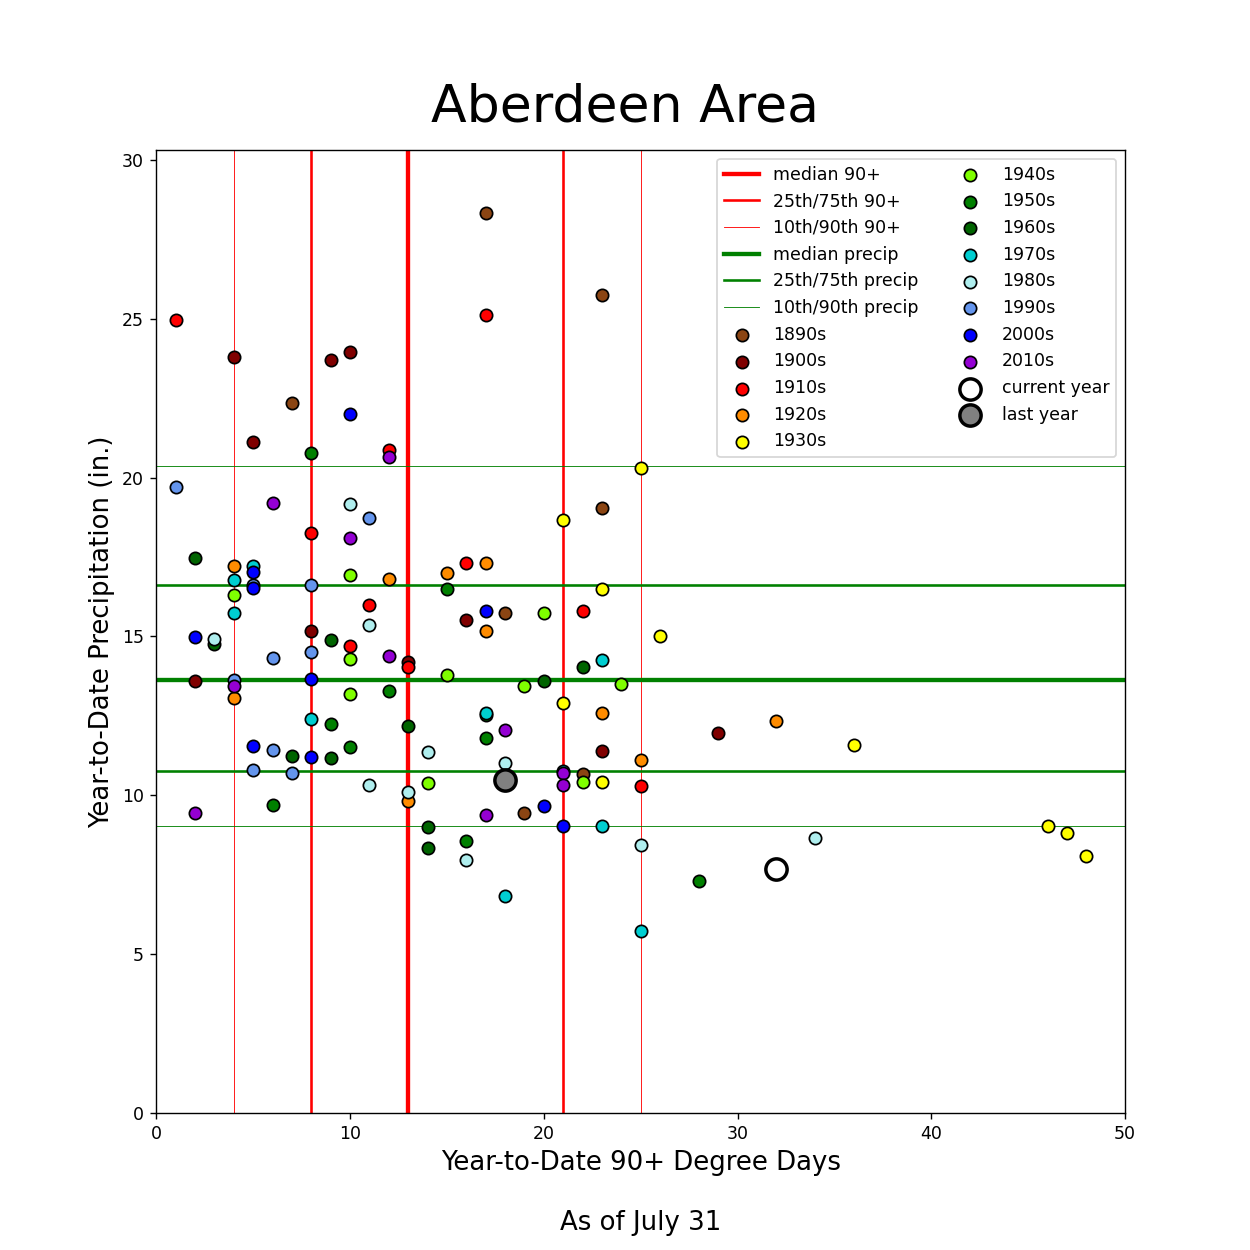
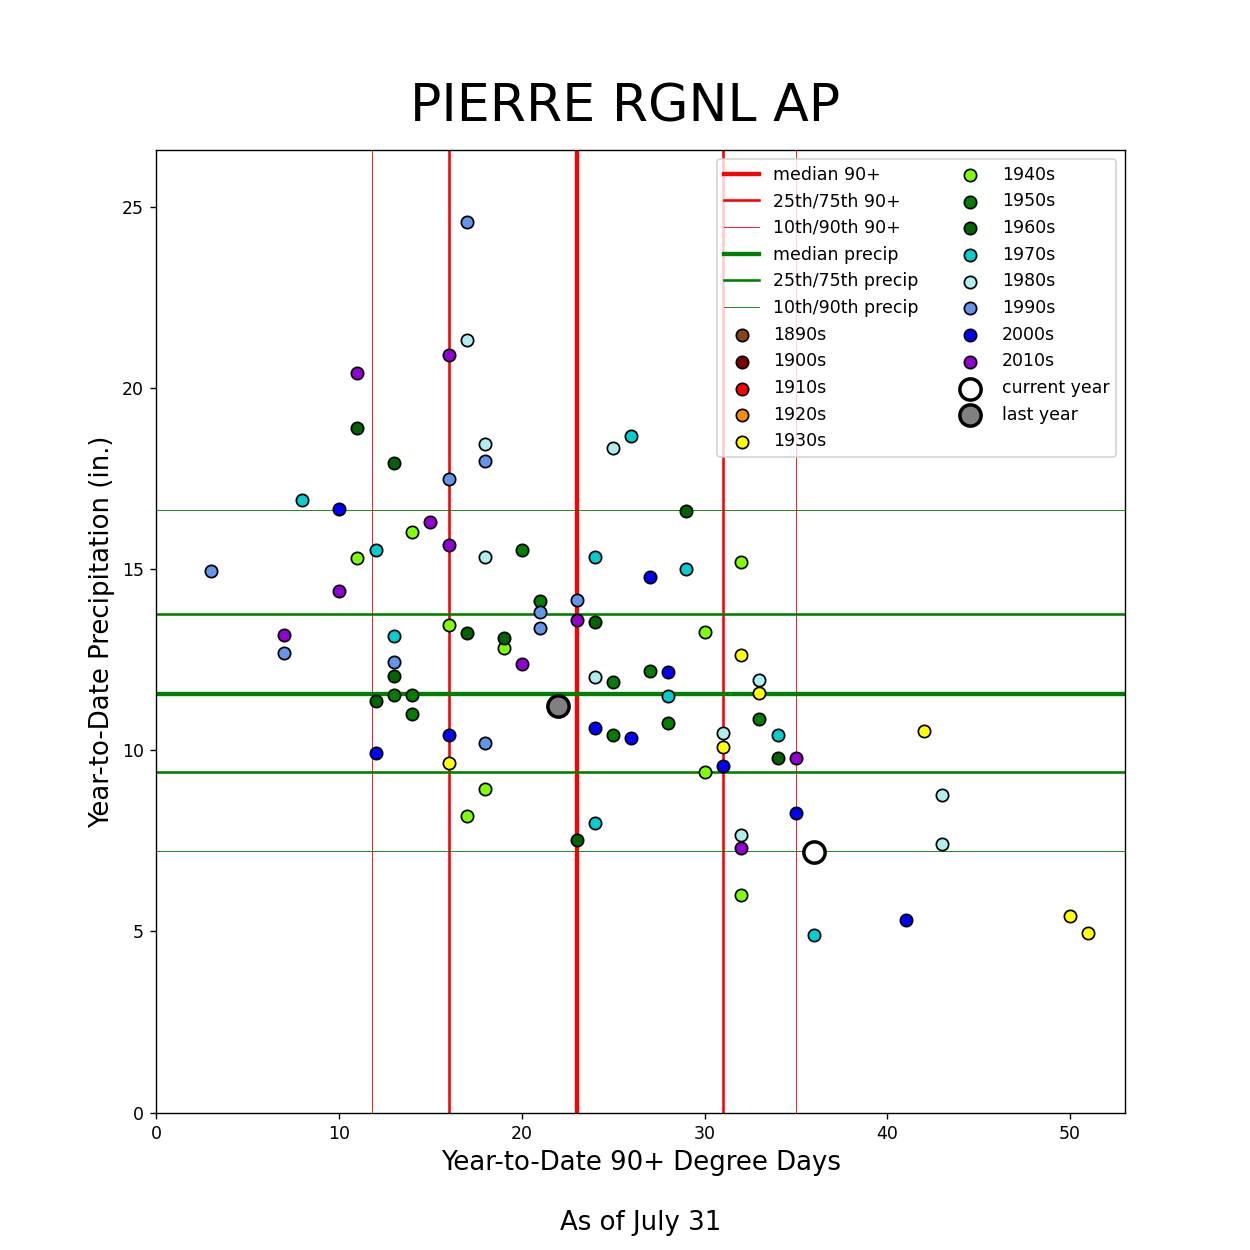
Year-to-date information (as of Aug 1) regarding number of 90+ degree days (horizontal axis) and precipitation totals (vertical axis) at Aberdeen and Pierre. The large white dot represents this year, whereas the smaller dots other years in the historical database. This information for additional locations can be found here
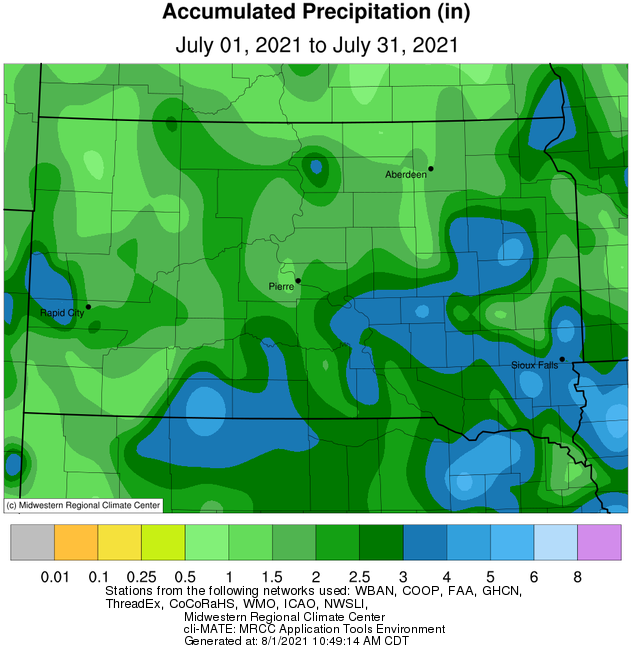
July 2021 total precipitation, courtesy of the Midwestern Regional Climate Center
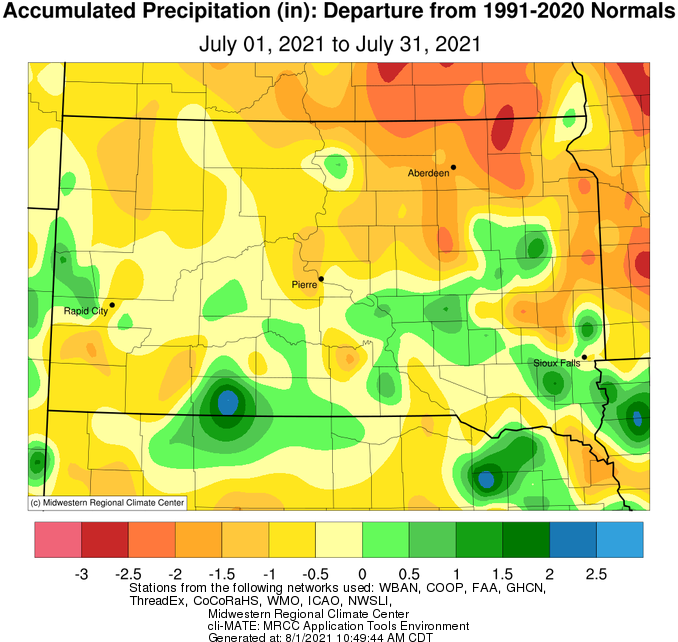
July 2021 total precipitation's departure from normal, courtesy of the Midwestern Regional Climate Center
A comparison of the US Drought Monitor across the region between roughly the start and end of July 2021
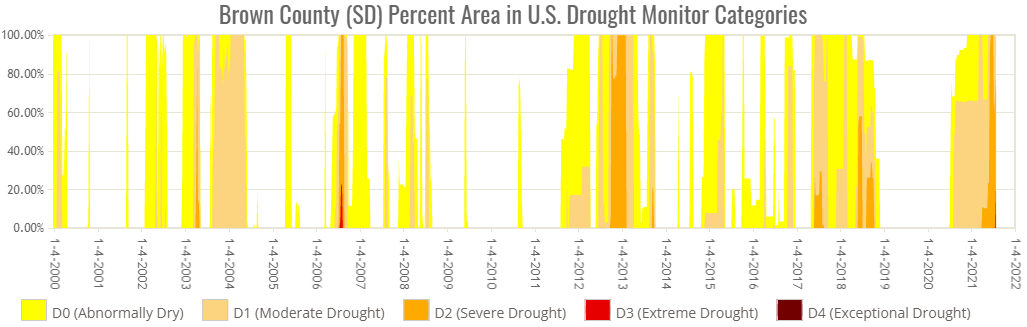
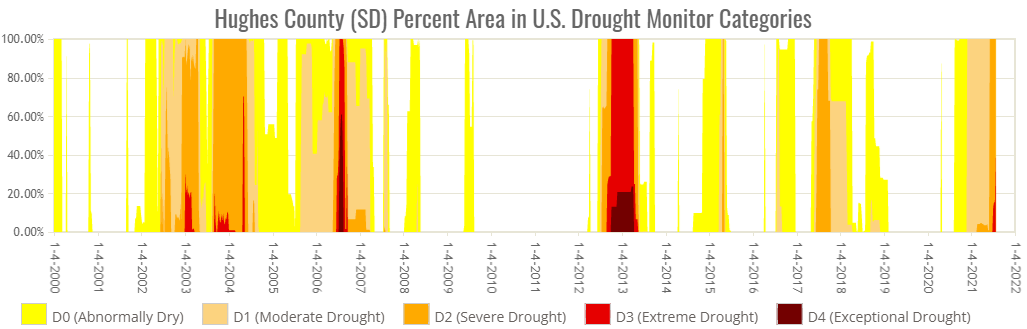
A US Drought Monitor Time Series for Brown and Hughes Counties (follow the link to select your own county). Time goes from left to right, from 2000 to the present, and the percent of coverage of drought across the selected county goes from the bottom to top. Furthermore, you can see the severity of drought, as depicted by color, and the specific coverage of each severity level as well. Notice for instance how this is the first time any portion of Brown County has been in Extreme/D3 Drought since 2006, and the first time that a portion of Hughes County has been in Extreme/D3 Drought *in July* since 2006.
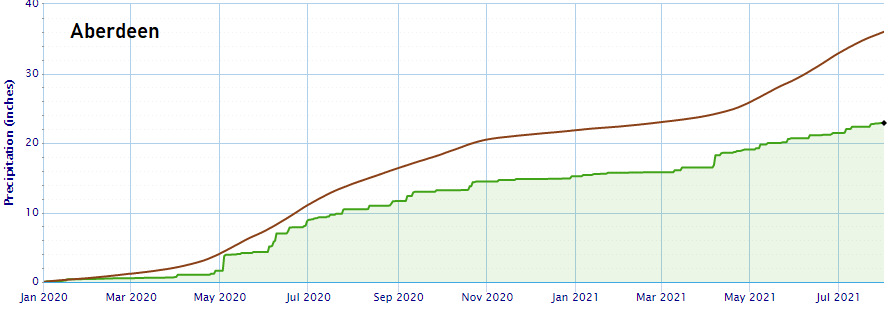
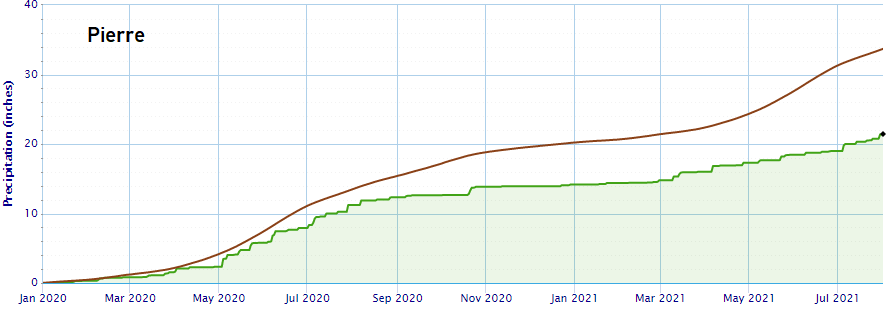
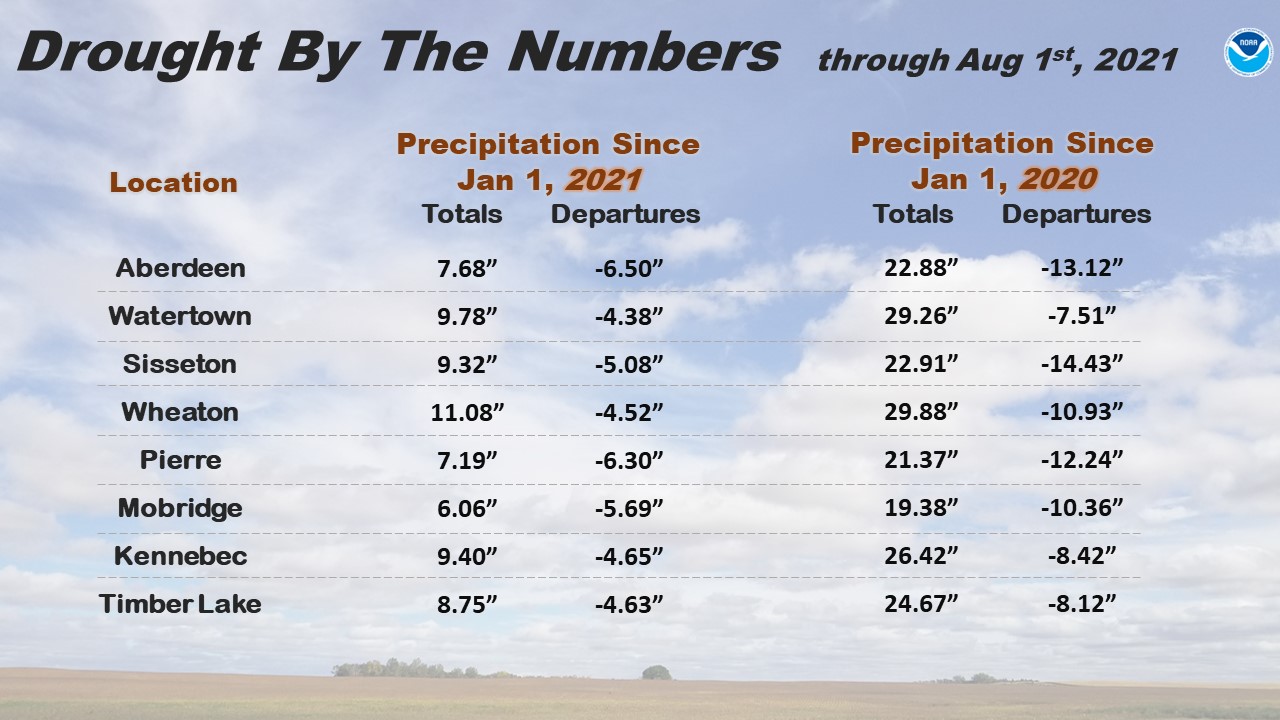
Precipitation totals and departures since January 1st of 2021 and 2020
Graph of observed precipitation and totals (green line) vs average precipitation over the same time period, since January 1, 2020 at Aberdeen and Pierre. The current drought has been two years in the making, following the wettest year on record state-wide (South Dakota) in 2019.