Despite starting generally warmer than normal, July 2018 finished cooler than normal to average out at near normal temperature-wise overall across the area. July 26th featured a record minimum high temperature at Watertown of 66 degrees.
Regarding precipitation, much of central South Dakota ranged from near normal to upwards of 2” below normal while northeastern South Dakota and west central Minnesota generally received above average rainfall; much above average in some cases. Britton recorded two 4+ inch rainfall events, on the 9-10th and 19-20th, which contributed to a monthly total of 10.39” (record July total is 10.83” in 1993). Sisseton recorded a total of 6.64” of rain with ranks as the 6th wettest July on record. A significant heavy rainfall and flooding event took place on the evening of July 2nd into the morning of July 3rd across portions of northern Hand and southern Spink counties. 11” was measured in a KELOLAND rain gauge before it overflowed 3 miles south-southwest of Polo. The probability for this type of rainfall to occur here is 0.1%. In other words, this is about as likely as being dealt a full house in 5 card poker, or getting a YAHTZEE on the first roll (https://hdsc.nws.noaa.gov/hdsc/pfds/pfds_map_cont.html?bkmrk=sd). Looking at it another way, this one 24 hour rainfall event nearly equaled what the area receives on average in all of May, June, July and August, the four wettest months of the year, combined (Miller: 11.36”). Drought conditions improved from D2 Severe to D1 Moderate throughout the course of the month across the James River Valley.
The most noteworthy severe weather event of the month occurred on the evening of July 3rd into the morning of July 4th. Significantly severe 96 mph wind gusts were recorded at Mobridge and ~10 miles west-northwest of Long Lake as a line of thunderstorms raced from Rapid City to Eagle Butte to Forbes, ND. Extensive damage, including structural damage, resulted in certain cases. More information can be found here: https://www.weather.gov/abr/July2-4SevereStorms
|
JULY 2018 |
||||
|
Temperature Data |
Aberdeen |
Sisseton |
Wheaton |
Watertown |
|
Warmest Temperature / Date |
99 / 11th |
95 / 8th |
93 / 8th |
91 / 11th |
|
Coldest Temperature / Date |
47 / 27th |
52 / 28th |
55 / 27, 28th |
50 / 29th |
|
Average High / Departure from Normal |
85.2 / +1.7 |
82.3 / -0.6 |
80.8 / -1.7 |
80.9 / +1.7 |
|
Average Low / Departure from Normal |
59.6 / +0.6 |
61.3 / +1.8 |
63.1 / +2.4 |
60.4 / +0.8 |
|
Monthly Average / Departure from Normal |
72.4 / +1.1 |
71.8 / +0.6 |
72.0 / +0.4 |
70.6 / +0.5 |
|
Precipitation Data |
||||
|
Monthly Precipitation / Departure from Normal |
3.64 / +0.62 |
6.64 / +3.06 |
5.14 / +1.94 |
3.35 / +0.33 |
|
Most Precipitation in 24 hours / Date |
1.18 / 4th |
1.77 / 19th |
1.59 / 20th |
0.65 / 19th |
|
Temperature Data |
Pierre |
Kennebec |
Mobridge |
Timber Lake |
|
Warmest Temperature / Date |
101 / 8th, 10th |
101 / 11th |
99 / 7th |
100 / 7th |
|
Coldest Temperature / Date |
50 / 27th |
51 / 27th |
50 / 27th |
49 / 27th |
|
Average High / Departure from Normal |
88.5 / -0.3 |
88.5 / -0.2 |
86.5 / -0.7 |
86.2 / +0.2 |
|
Average Low / Departure from Normal |
61.3 / -0.6 |
62.0 / 0.0 |
61.0 / +1.5 |
59.5 / -0.2 |
|
Monthly Average / Departure from Normal |
74.9 / -0.5 |
75.2 / -0.7 |
73.7 / +1.1 |
72.8 / 0.0 |
|
Precipitation Data |
||||
|
Monthly Precipitation / Departure from Normal |
0.52 / -2.09 |
6.05 / +3.56 |
1.34 / -1.36 |
4.79 / +2.17 |
|
Most Precipitation in 24 hours / Date |
0.51 / 18th |
3.20 / 18th |
0.40 / 22nd |
2.04 / 29th |
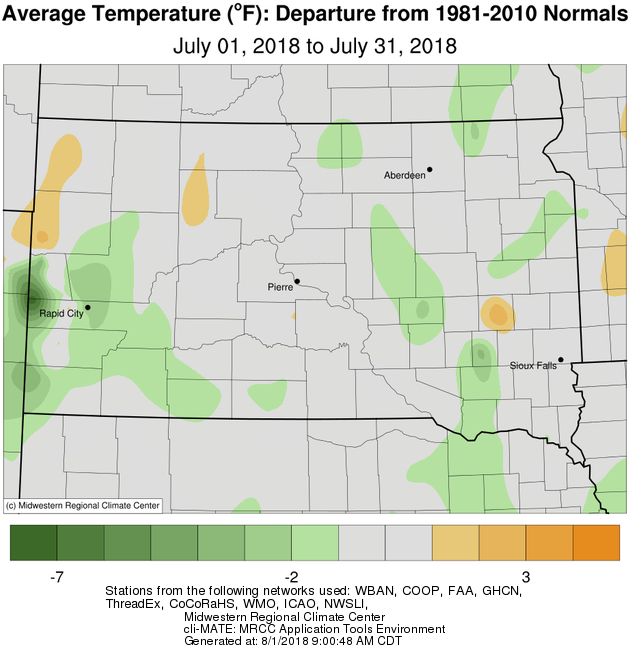
July 2018 temperature departures, from the Midwestern Regional Climate Center
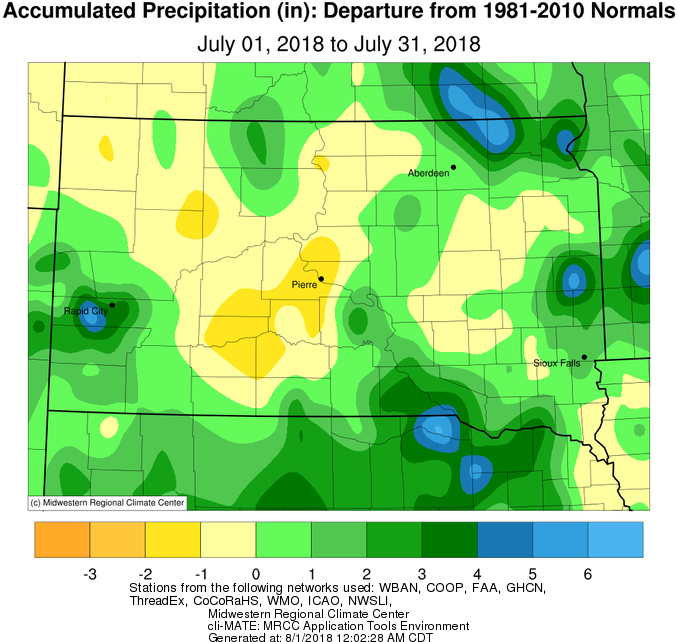
July 2018 precipitation departures, from the Midwestern Regional Climate Center
*This accumulated precipitation map uses observation networks which don't capture the locally heavy rainfall event across northern Hand & Hyde Counties on July 2nd. This is why it doesn't display on this departure map.*
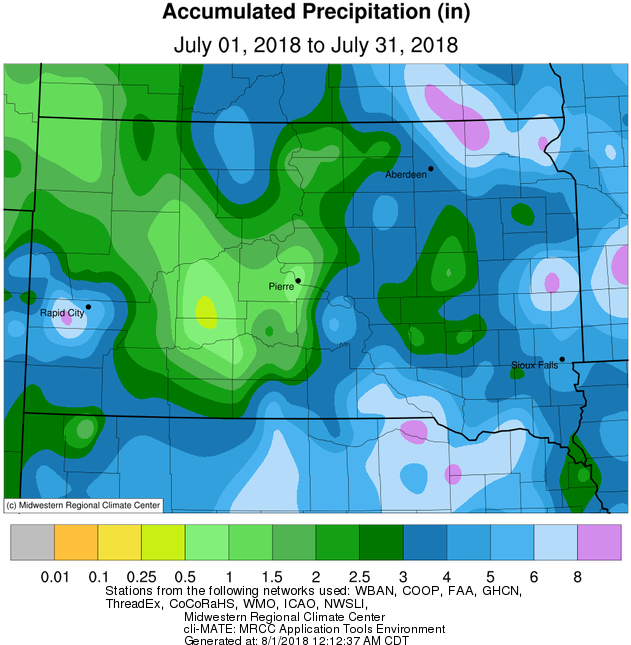
July 2018 precipitation totals, from the Midwestern Regional Climate Center