Heavy to excessive rainfall may produce additional flash flooding Wednesday across parts of the southern Plains where the greatest risk is along the Red River Valley into western Arkansas. Scattered severe thunderstorms are also possible centered on central Texas to eastern Oklahoma and western Arkansas. Large hail, damaging wind, and a few tornadoes will be possible. Read More >
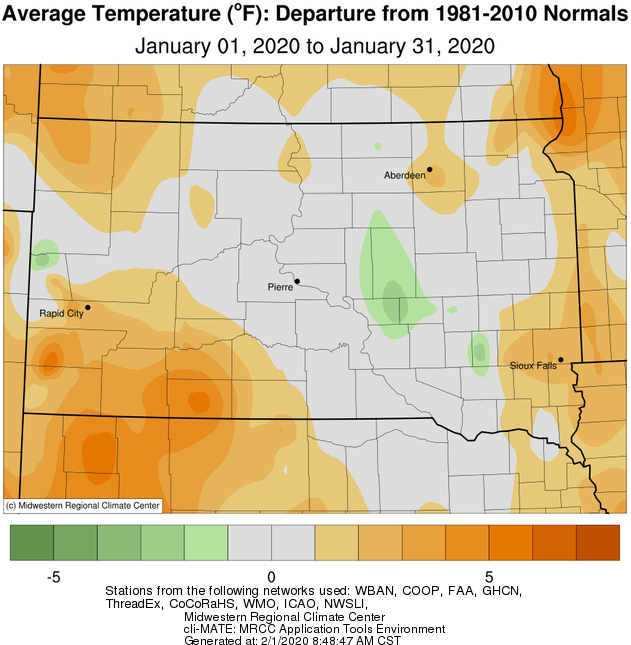
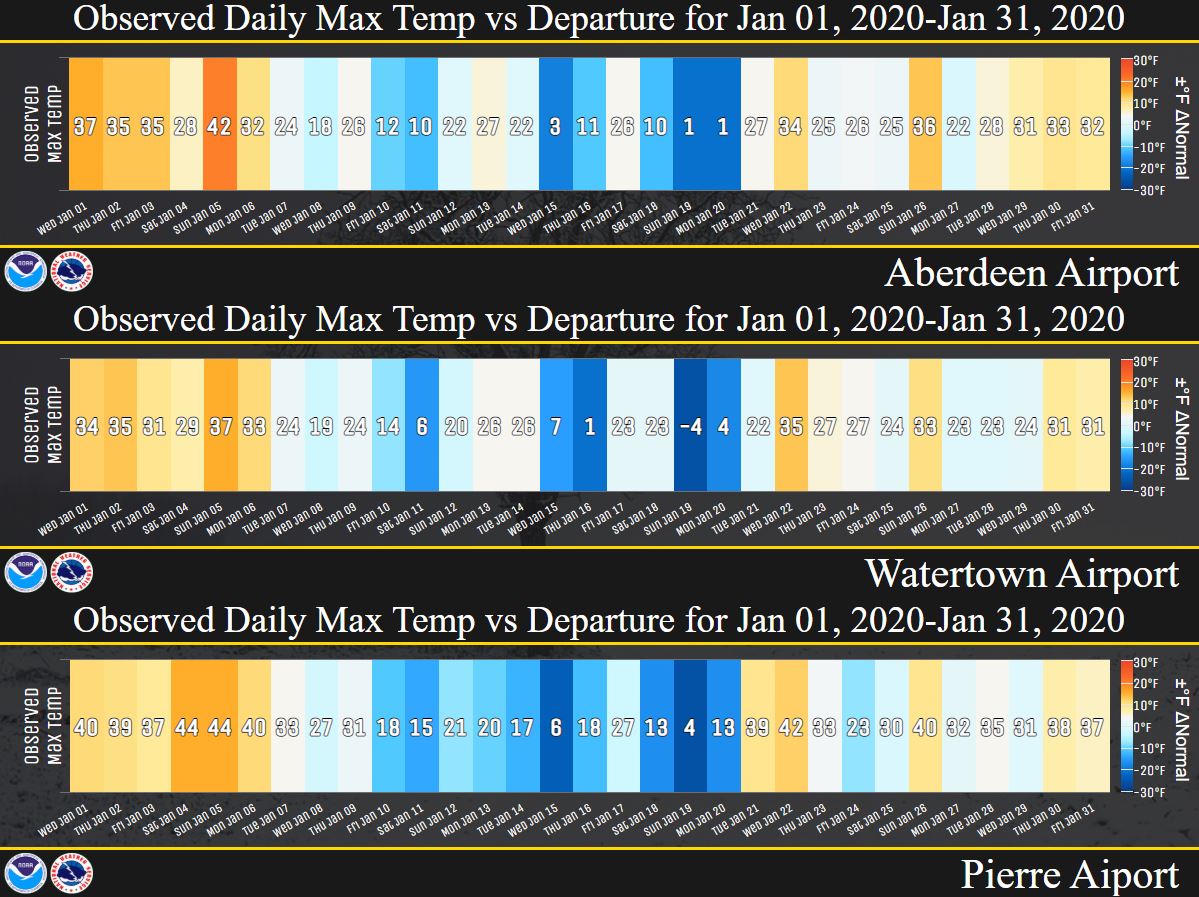
On a whole, January 2020 finished near normal as an average temperature-wise across the area. However, there were swings, namely, above average temperatures were in place generally in the beginning and ending thirds of the month while below average temperatures prevailed in-between. The coldest day of the month for most, January 16th, featured lows of -10 to -30 F. While warmer air moved in to end the month, it came at the cost of widespread persistent cloud cover, as well as consecutive mornings of dense freezing fog and/or freezing drizzle which resulted in slick roads and vehicle accidents.
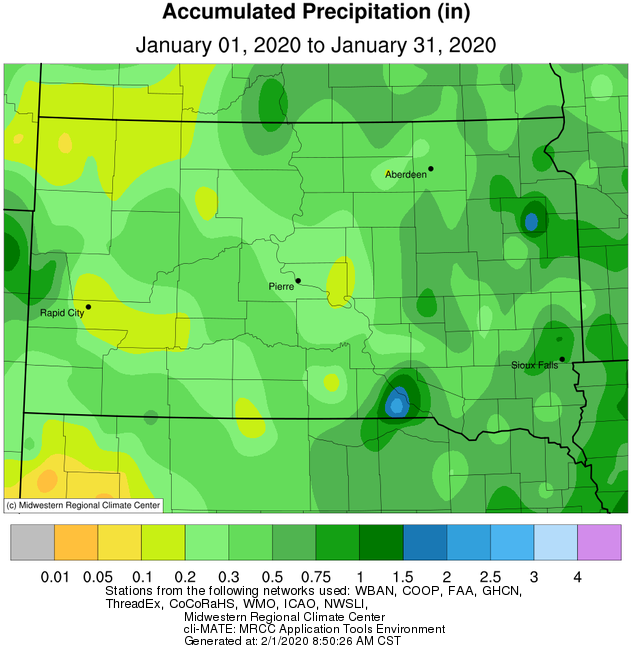
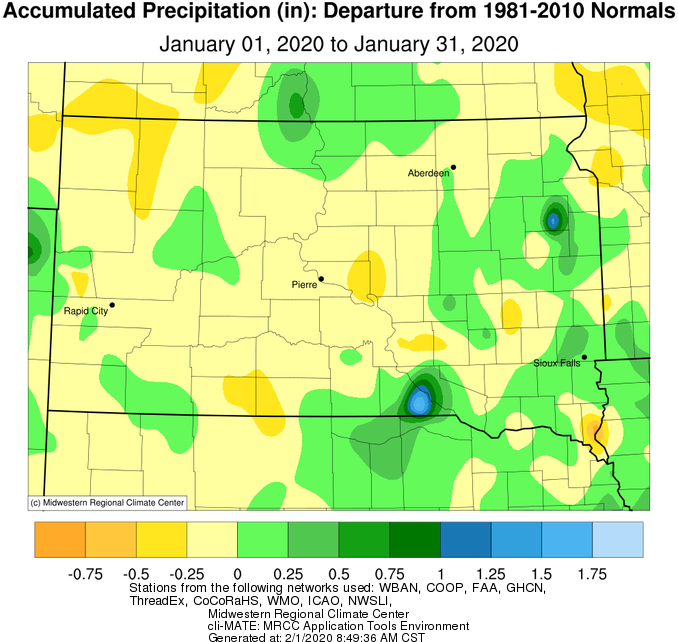
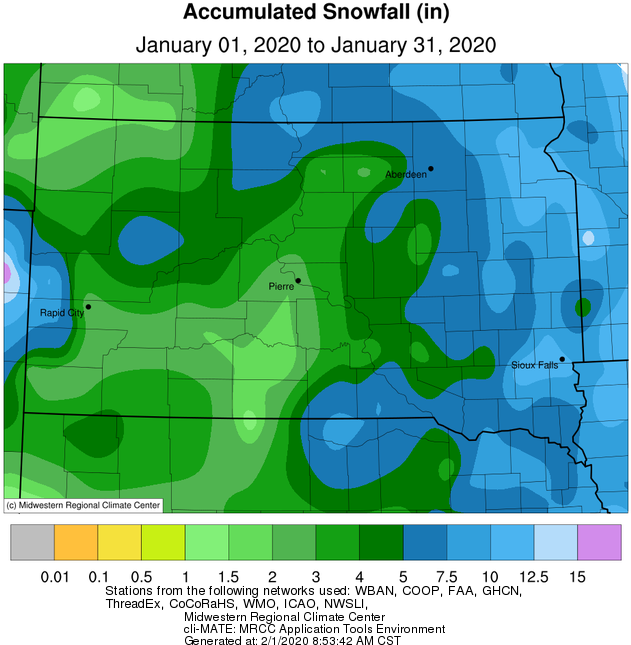
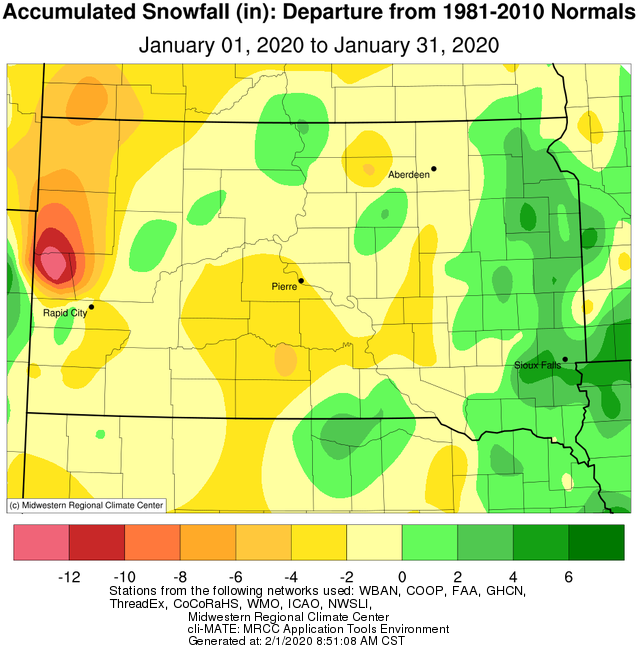
Precipitation and snowfall for the month finished slightly above average across eastern and portions of north central South Dakota, but much of the rest of the area finished near or slightly below average. Watertown tied a daily record for snow on January 3rd, of 3.5” (2009). While no widespread heavy snow event took place across the area, enough fell on the 17th to combine with strong winds on the 17th and 18th to produce widespread blizzard conditions. For more on this event, visit https://www.weather.gov/abr/January17-182020BlizzardSummary. Localized blizzard conditions occurred on a couple additional instances across downslope wind-prone areas on the western and eastern slopes of the Coteau this month, thanks in part to a substantial snow pack and cold air. The most notable of these events occurred mostly on the morning of the 21st, when localized wind gusts of 60+ mph were recorded. A stretch of I-29 was even closed for about an hour from Sisseton to Summit due to a jackknifed semi tractor-trailer.
|
January 2020 |
||||
|
Temperature Data |
Aberdeen |
Sisseton |
Wheaton |
Watertown |
|
Warmest Temperature / Date |
42 / 5th |
41 / 5th |
43 / 5th |
37 / 5th |
|
Coldest Temperature / Date |
-24 / 16th |
-21 / 11th |
-19 / 16th |
-22 / 16th |
|
Average High / Departure from Normal |
23.9 / +1.4 |
22.1 / -0.9 |
23.1 / +3.7 |
23.0 / +0.8 |
|
Average Low / Departure from Normal |
6.1 / +4.6 |
6.7 / +3.4 |
8.7 / +8.1 |
4.8 / +1.7 |
|
Monthly Average / Departure from Normal |
15.0 / +3.0 |
14.4 / +1.3 |
15.9 / +5.9 |
13.9 / +1.2 |
|
Precipitation Data |
|
|
|
|
|
Monthly Precipitation / Departure from Normal |
0.44 / -0.03 |
0.63 / +0.20 |
0.63 / -0.19 |
0.91 / +0.39 |
|
Most Precipitation in 24 hours / Date |
0.17 / 17th |
0.23 / 3rd |
0.26 / 18th |
0.24 / 30th |
|
Monthly Snowfall / Departure from Normal |
6.4 / +0.0 |
8.7 / +0.3 |
7.3 / -1.7 |
11.3 / +6.0 |
|
Most Snow in 24 hours / Date |
2.9 / 17th |
2.6 / 3rd |
2.8 / 17th |
3.5 / 3rd |
|
Temperature Data |
Pierre |
Kennebec |
Mobridge |
Timber Lake |
|
Warmest Temperature / Date |
44 / 4th, 5th |
43 / 5th |
44 / 1st, 4th |
44 / 5th |
|
Coldest Temperature / Date |
-10 / 10th, 16th |
-12 / 16th |
-19 / 16th |
-18 / 15th |
|
Average High / Departure from Normal |
28.6 / -1.4 |
30.1 / -1.8 |
26.4 / +0.4 |
25.3 / -2.8 |
|
Average Low / Departure from Normal |
12.5 / +2.7 |
12.5 / +2.4 |
9.8 / +3.7 |
8.9 / +1.1 |
|
Monthly Average / Departure from Normal |
20.5 / +0.6 |
21.3 / +0.3 |
18.1 / +2.1 |
17.1 / -0.9 |
|
Precipitation Data |
|
|
|
|
|
Monthly Precipitation / Departure from Normal |
0.32 / -0.10 |
0.22 / -0.17 |
0.35 / +0.06 |
0.36 / -0.07 |
|
Most Precipitation in 24 hours / Date |
0.10 / 23rd |
0.06 / 17th |
0.12 / 17th |
0.15 / 23rd |
|
Monthly Snowfall / Departure from Normal |
2.8 / -1.9 |
2.1 / -2.7 |
5.6 / +0.6 |
5.8 / +0.2 |
|
Most Snow in 24 hours / Date |
1.5 / 10th |
0.5 / 17th |
1.5 / 14th |
2.3 / 23rd |
Average temperature departures from normal during January 2020, from the Midwestern Regional Climate Center
Below is a chart featuring daily high temperatures (number value) as well as their departures from normal (blue shading is colder than average, orange is warmer than average) through January for Aberdeen, Watertown and Pierre, in that order.
Precipitation totals (left) and departures from normal (right) from January 2020 (note, erroneously high data in the Watertown area), from the Midwestern Regional Climate Center
Snowfall totals (left) and departures from normal (right) from January 2020, from the Midwestern Regional Climate Center
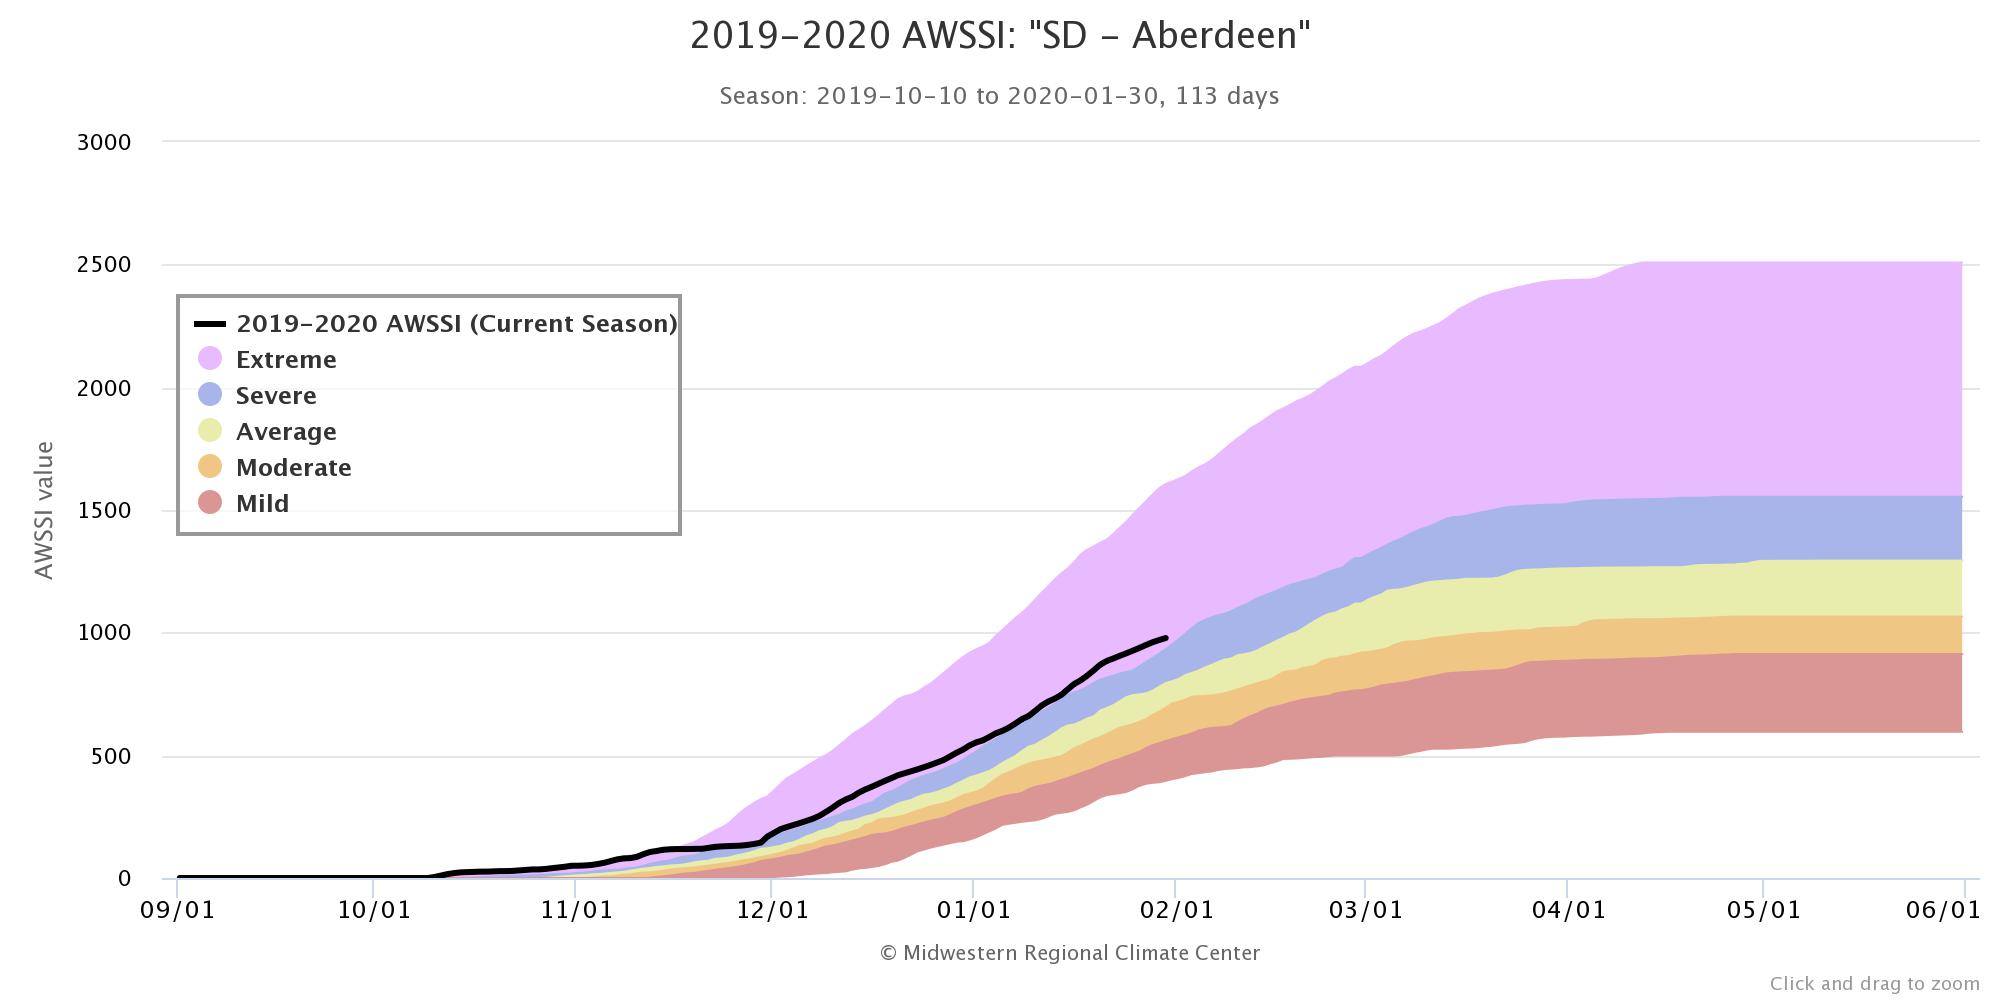
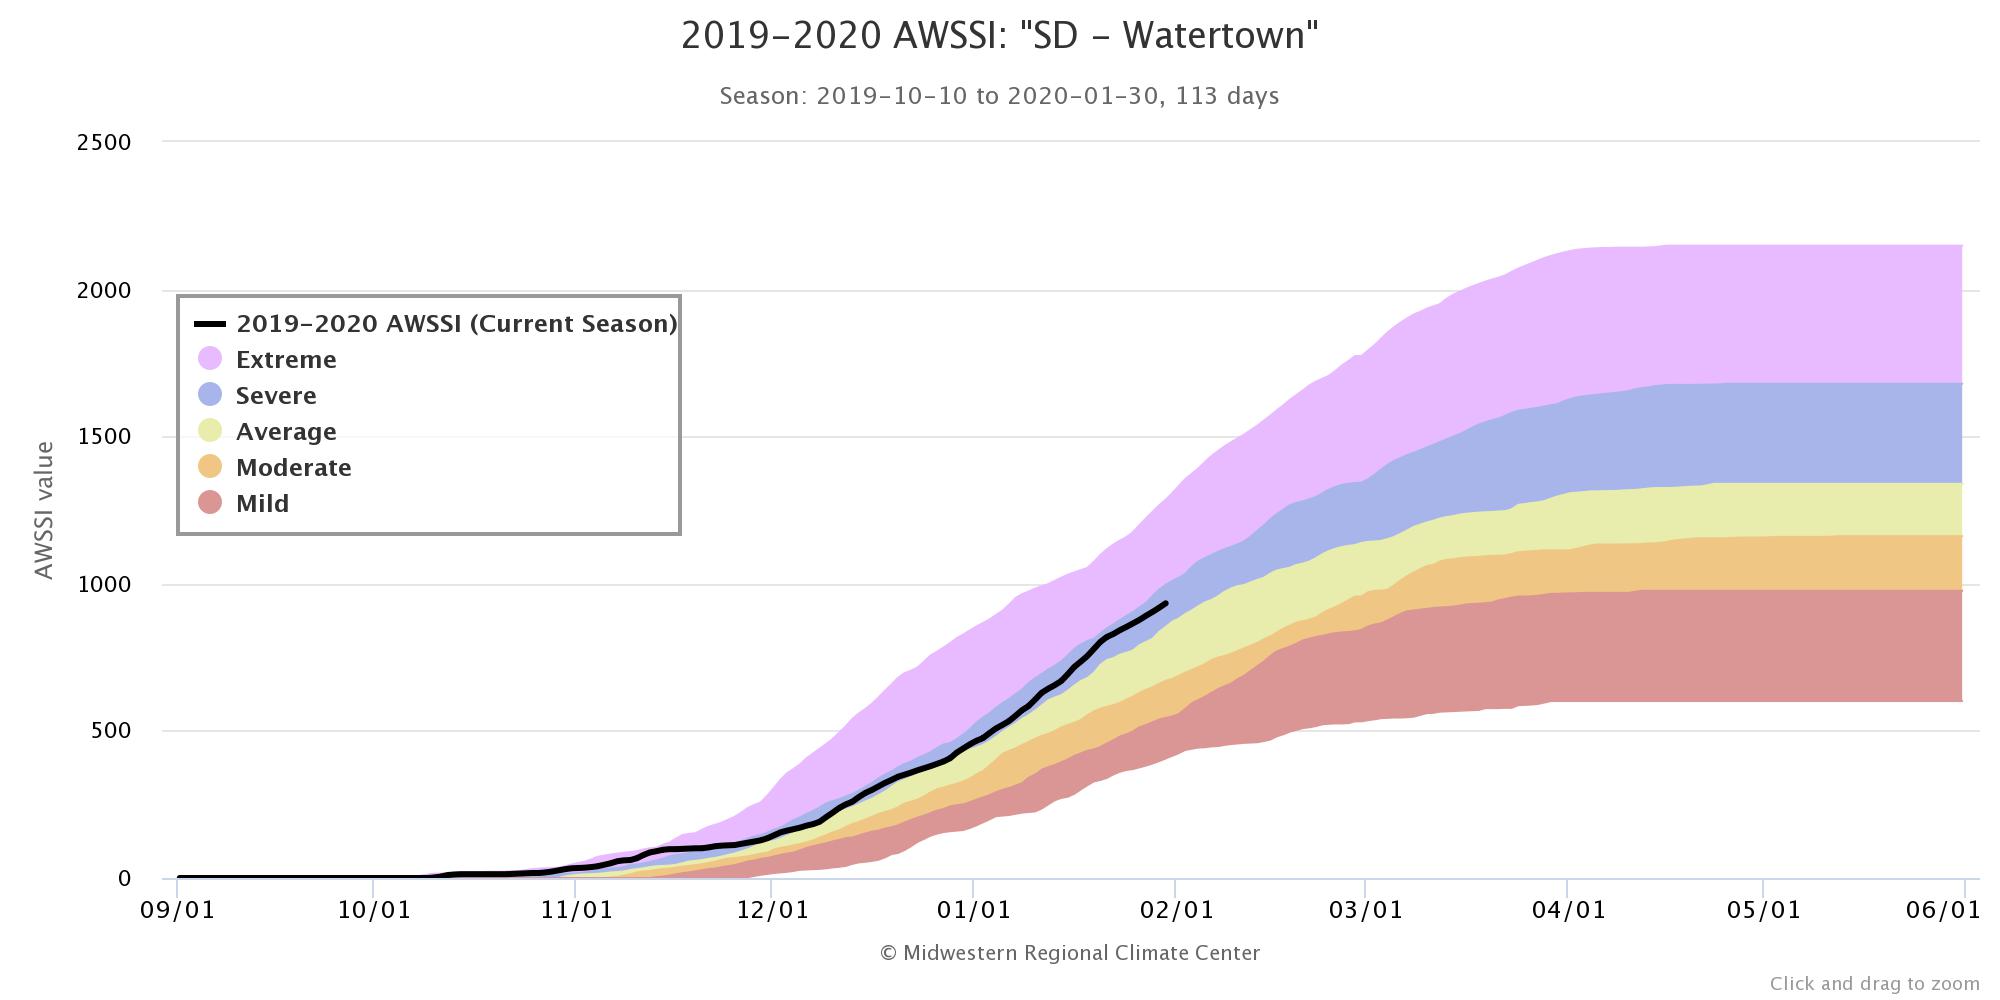
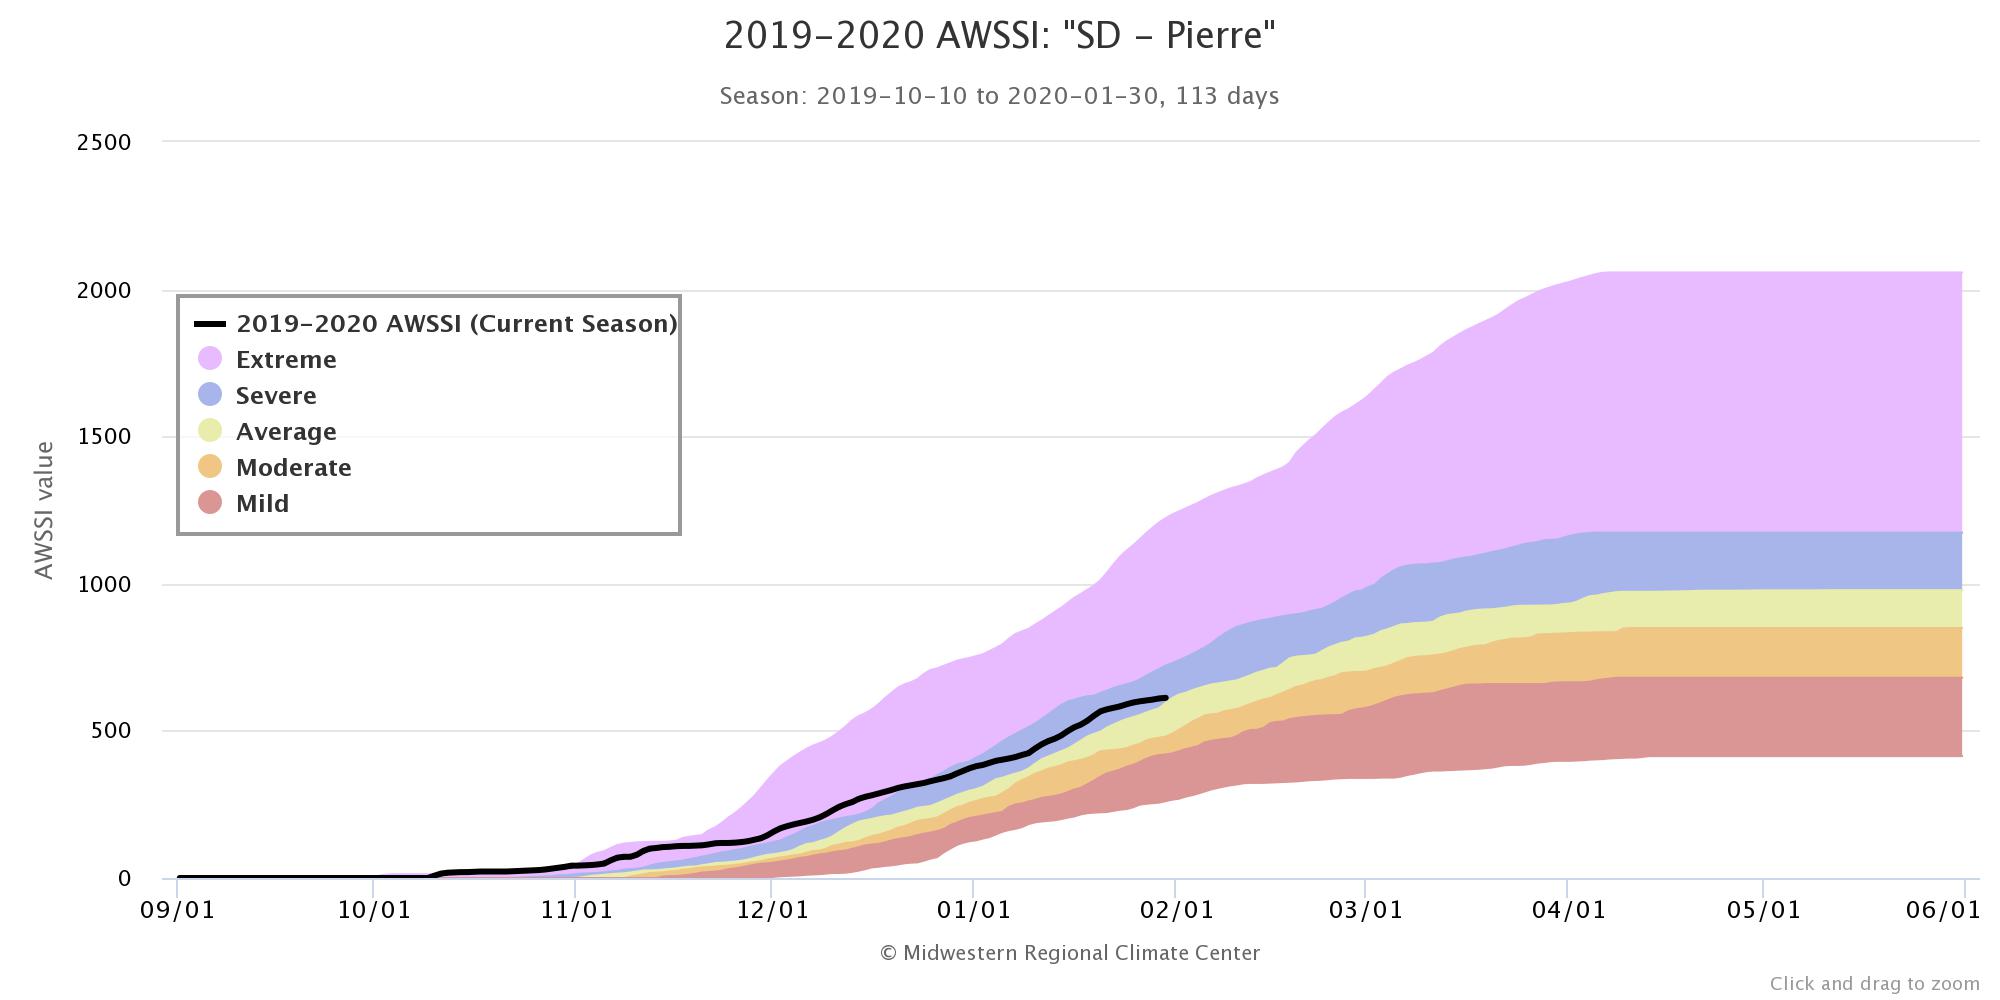
The severity of the 2019-2020 cold season, based on max/min temperature, snowfall, and snow depth or precipitation, has ranged widely from "Mild" to "Extreme" across the Northern Plains. Below is Accumulated Winter Season Severity Index information as of February 1st, from the Midwestern Regional Climate Center.
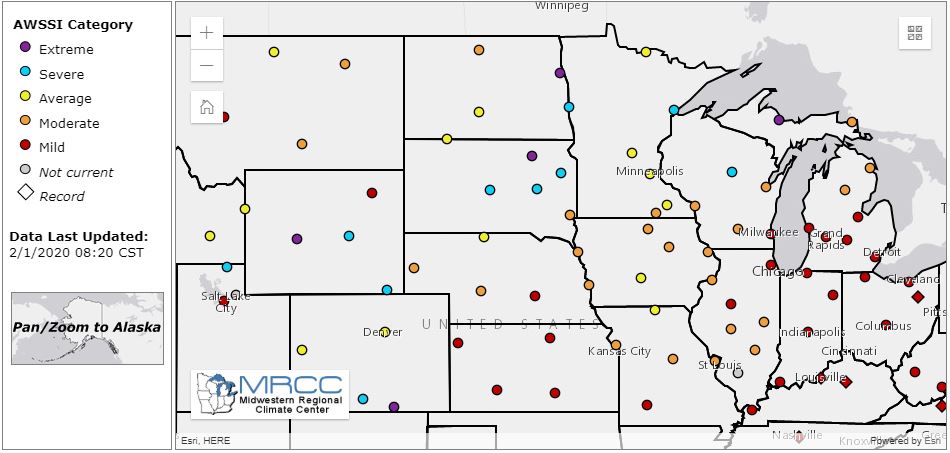
By clicking on the point locations above (on the MRCC website), you can find graphs detailing their Categories through time. Below are such graphs from Aberdeen, Watertown and Pierre, in that order.