February 2022 featured below average temperatures on the whole, from near normal near and west of the Missouri River to as much as 7 degrees for areas near the ND/MN/SD intersection. This hardly captures the full story however, this month even more so than usual, due to large fluctuations in temperatures over short periods of time due to several northwest to southeast-moving clipper-low pressure systems. 10 in fact, by our count, tracked across the region during the first two-thirds of the month alone, each one transporting milder air on southerly winds out ahead, and colder air on northerly winds behind (to varying degrees). Many locations recorded calendar day high temperatures around midnight at times, as the wind’s ability to transport air masses overpowered the traditional cycle driven by solar radiation.
While these low pressure systems brought their fair share of wind, very little in the way of moisture fell. Central South Dakota remained largely snow-free, and weather conditions promoted very high grassland fire danger several times. A couple wildfires did spread upon ignition, the largest of which (over 300 acres) in Jones County on Feb 18th, when wind gusts of 50-65 mph overtook the area. Blowing dust was observed across parts of the James River Valley as well. Meanwhile, portions of the northeastern part of the state held onto their snowpack, which helped keep them colder than they would have otherwise been.
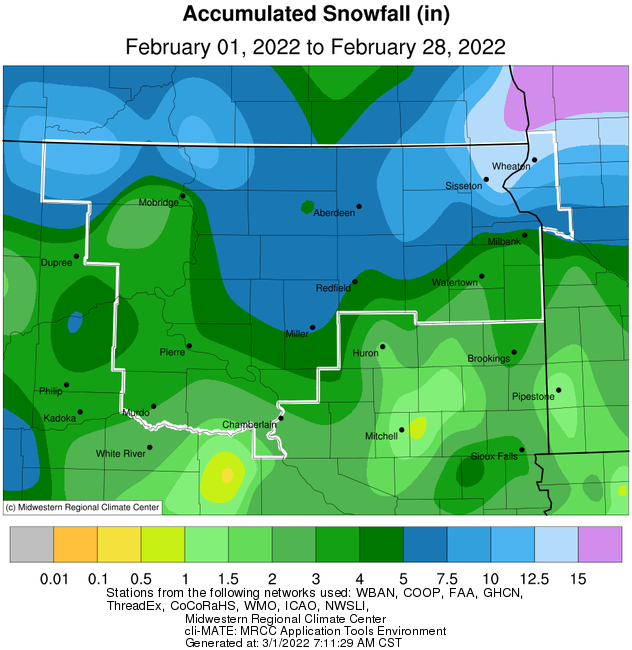
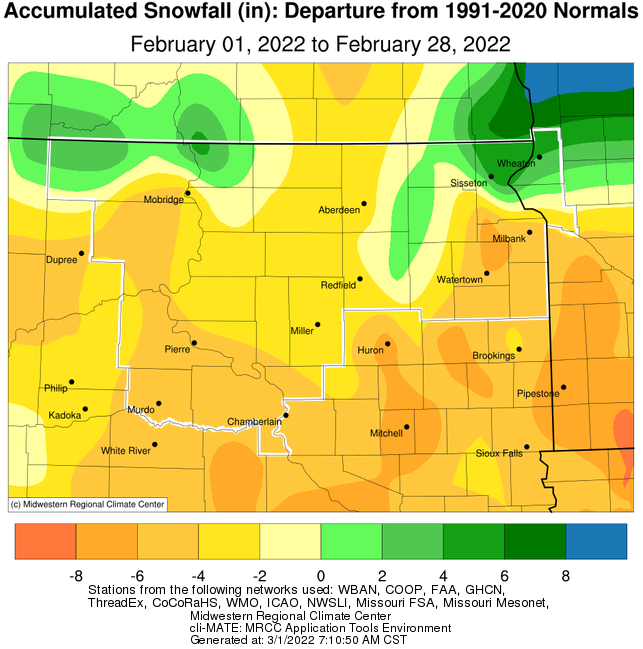
The most significant storm system of the month took place on the 20-22nd, when banded heavy snow was followed by additional accumulating snow, strong winds, blizzard conditions and several days of Arctic cold air and wind chills. Several daily precipitation, snowfall and cold high temperature records were set through this time – find much more information at https://www.weather.gov/abr/February20-22ndBandedSnowBlizzard2022. By the end of the month, much of the area finished with below average amounts of precipitation (by as much as around a half inch) and snowfall (by as much as around 6 inches). The exception being across portions of north central and northeastern SD as well as west central Minnesota.
|
February 2022 |
||||
|
Temperature Data |
Aberdeen |
Sisseton |
Wheaton |
Watertown |
|
Warmest Temperature / Date |
56 / 7th |
46 / 28th |
41 / 10th |
51 / 28th |
|
Coldest Temperature / Date |
-22 / 23rd |
-23 / 3rd |
-22 / 3, 4th |
-17 / 3rd |
|
Average High / Departure from Normal |
30.0 / +1.4 |
25.4 / -1.6 |
19.0 / -5.9 |
26.0 / +0.1 |
|
Average Low / Departure from Normal |
1.0 / -5.3 |
-0.3 / -8.4 |
-4.4 / -10.4 |
0.1 / -6.6 |
|
Monthly Average / Departure from Normal |
15.5 / -2.0 |
12.6 / -5.0 |
7.3 / -8.2 |
13.0 / -3.3 |
|
Precipitation Data |
|
|
|
|
|
Monthly Precipitation / Departure from Normal |
0.39 / -0.23 |
0.67 / -0.03 |
0.88 / +0.17 |
0.40 / -0.25 |
|
Most Precipitation in 24 hours / Date |
0.14 / 21st |
0.49 / 21st |
0.46 / 21st |
0.23 / 22nd |
|
Monthly Snowfall / Departure from Normal |
5.5 / -3.1 |
13.2 / +5.9 |
13.2 / +4.2 |
3.0 / -5.9 |
|
Most Snow in 24 hours / Date |
2.6 / 21st |
8.0 / 21st |
7.5 / 21st |
2.2 / 22nd |
|
Temperature Data |
Pierre |
Kennebec |
Mobridge |
Timber Lake |
|
Warmest Temperature / Date |
64 / 28th |
64 / 28th |
62 / 7th |
58 / 7, 19th |
|
Coldest Temperature / Date |
-18 / 23rd |
-18 / 25th |
-20 / 23rd |
-22 / 23rd |
|
Average High / Departure from Normal |
37.1 / +3.4 |
40.3 / +3.9 |
34.4 / +2.8 |
32.8 / +2.1 |
|
Average Low / Departure from Normal |
6.2 / -6.4 |
8.4 / -4.3 |
4.9 / -5.8 |
5.8 / -5.0 |
|
Monthly Average / Departure from Normal |
21.7 / -1.5 |
24.4 / -0.2 |
19.6 / -1.6 |
19.3 / -1.4 |
|
Precipitation Data |
|
|
|
|
|
Monthly Precipitation / Departure from Normal |
0.18 / -0.56 |
0.11 / -0.48 |
0.31 / -0.34 |
0.17 / -0.50 |
|
Most Precipitation in 24 hours / Date |
0.07 / 22nd |
0.05 / 22,24th |
0.20 / 21st |
0.11 / 21st |
|
Monthly Snowfall / Departure from Normal |
3.8 / -4.2 |
2.5 / -5.1 |
3.0 / -3.4 |
1.9 / -5.6 |
|
Most Snow in 24 hours / Date |
1.8 / 22nd |
1.5 / 22nd |
1.8 / 21st |
1.6 / 21st |
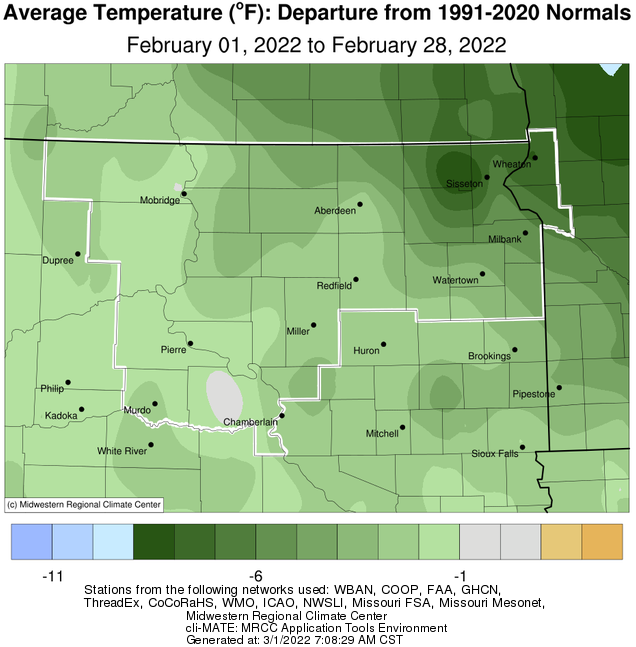
Average February 2022 temperature departure from normal, from the Midwestern Regional Climate Center
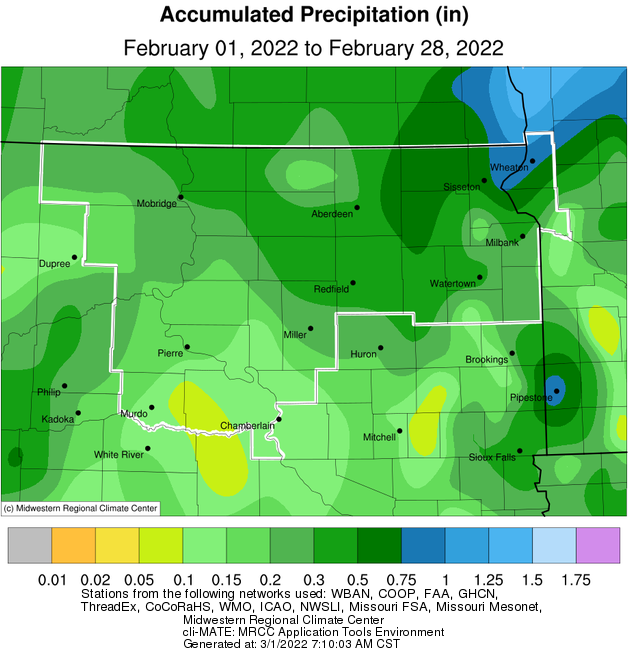
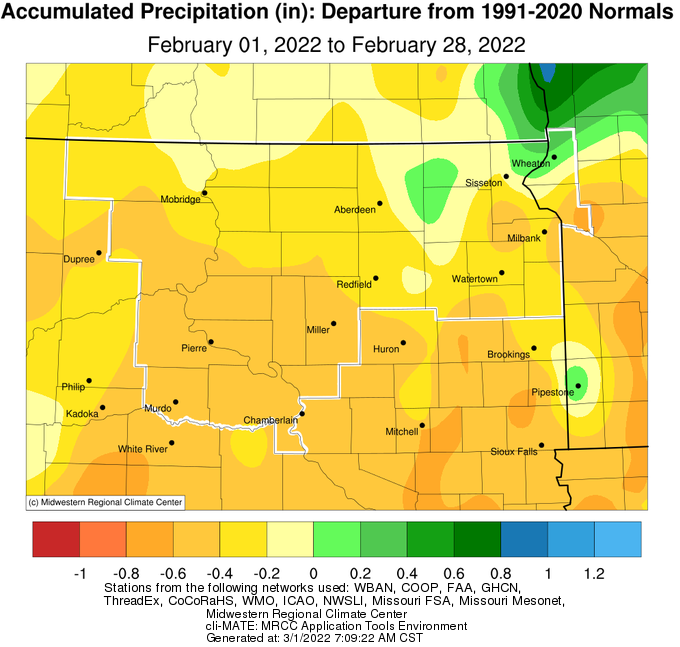
Total February 2022 precipitation (top) and departure from normal (bottom), from the Midwestern Regional Climate Center
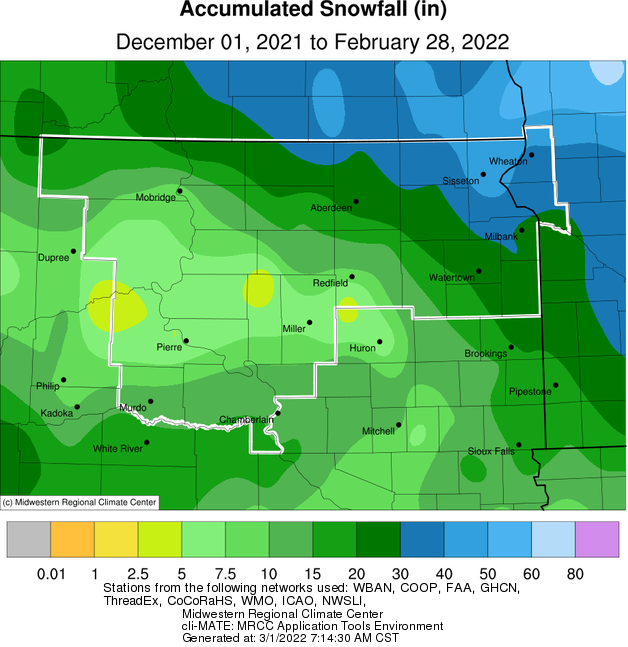
Total February 2022 snow (top) and departure from normal (bottom), from the Midwestern Regional Climate Center
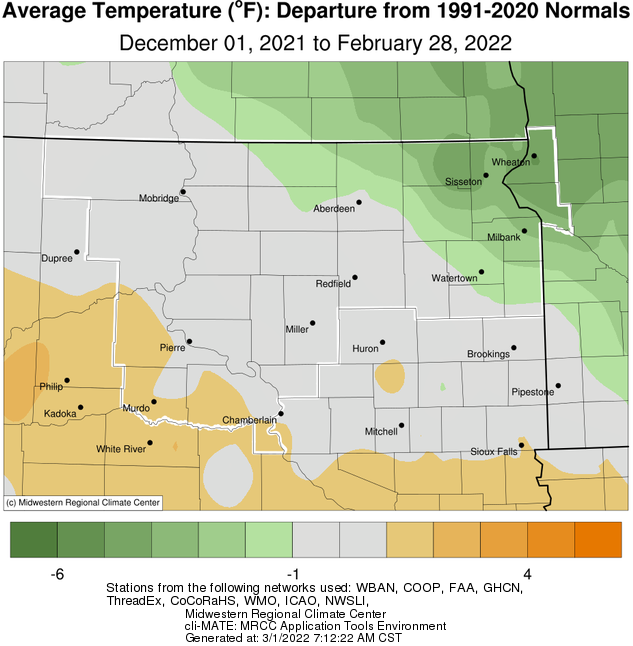
It was a tale of two meteorological winters (December 2021 through February 2022) across the area: far northeastern South Dakota and west central Minnesota observed below average temperatures and above average precipitation and snow, while central South Dakota observed near to slightly above average temperatures and below average precipitation and snow. Specifically, Sisseton recorded their 5th wettest meteorological winter on record with 3.48” of moisture (5.32” from 1951-1952), and 6th snowiest with 44.0” (71.5” in 2010-2011). Meanwhile, Pierre tied their 4th driest meteorological winter on record with just 0.32” of moisture (0.16” in 1982-1983), and recorded their 7th least snowy winter with 5.2” (0.6” in 1982-83). Less than just 200 miles made all the difference! A fairly persistent upper-level pattern was largely responsible – northwest flow aloft ushered in several storm systems which followed a similar track, keeping some areas generally colder and wetter while others milder and drier.
Meteorological Winter 2021-2022 (Dec-Feb) average temperature departure from normal, from the Midwestern Regional Climate Center
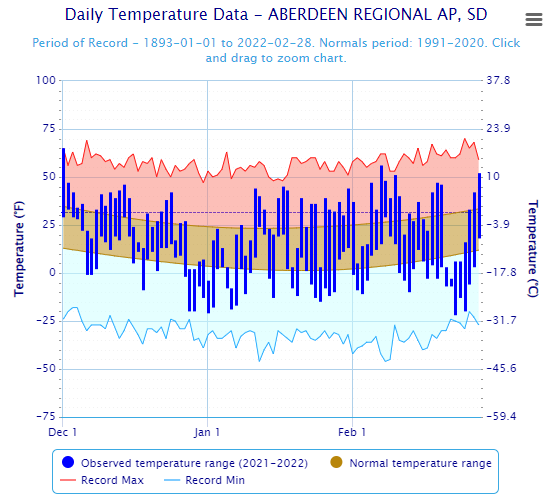
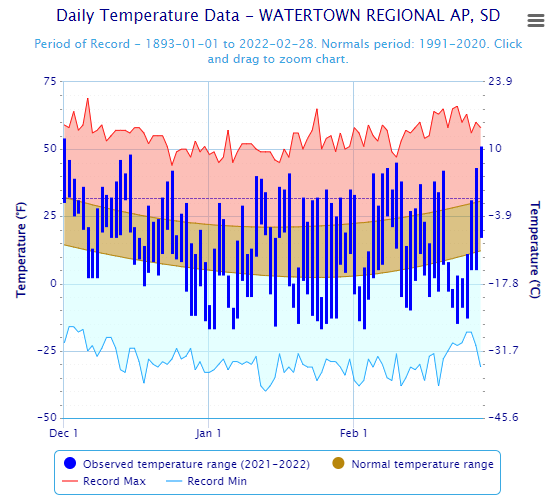
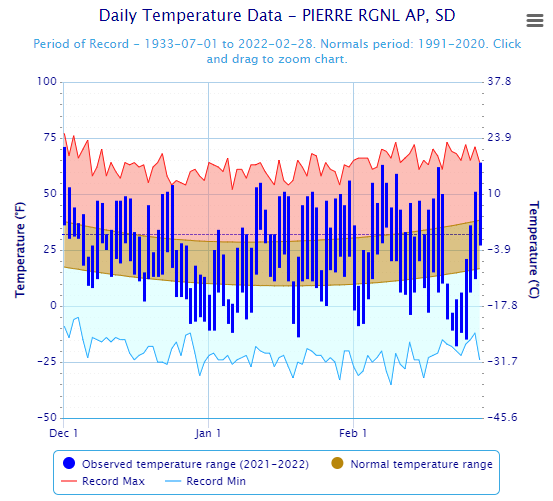
Daily observed highs (top of the vertical blue bars) and lows (bottom of the vertical blue bars) throughout the three meteorological winter months at Aberdeen, Watertown and Pierre respectively. This plot also shows these observed temperatures in the context of normal highs and lows (top and bottom of the tan shaded area) as well as daily record high and cold temperatures (top of the red and bottom of the blue shaded areas). Some perspective can be gained on just how widely temperatures fluctuated this winter, both within single days and from day to day. Specific numbers can be seen on an interactive version of this display, and for additional locations, here.
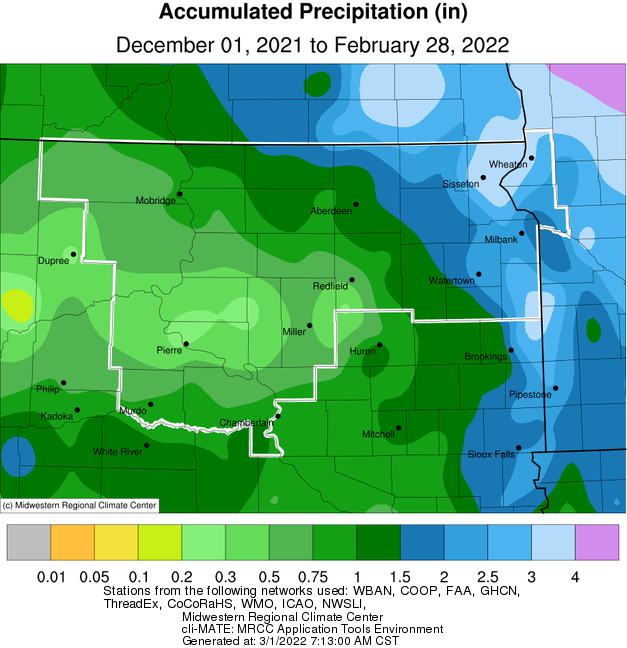
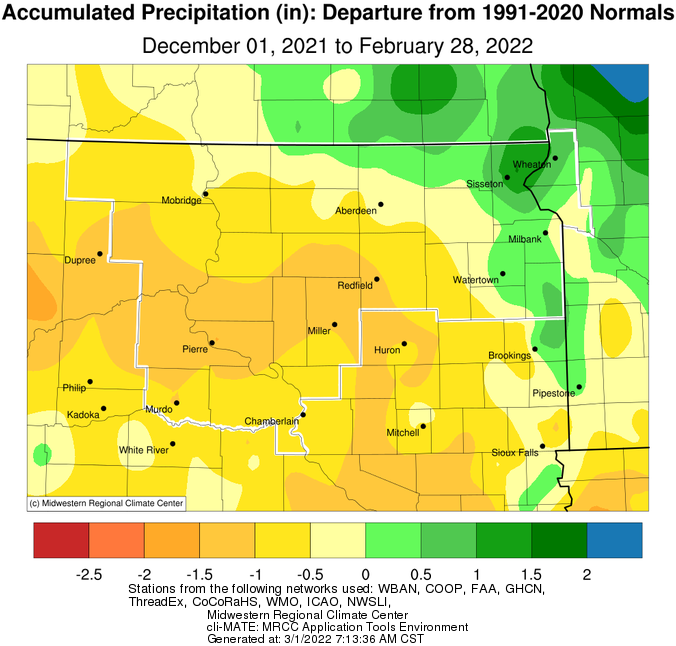
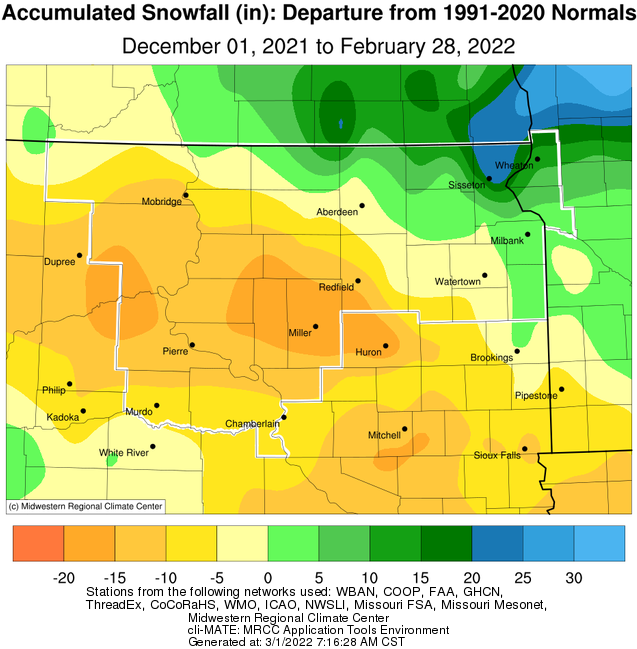
Meteorological Winter 2021-2022 (Dec-Feb) total precipitation (top) and departure from normal (bottom), from the Midwestern Regional Climate Center
Meteorological Winter 2021-2022 (Dec-Feb) total snow (left) and departure from normal (right), from the Midwestern Regional Climate Center
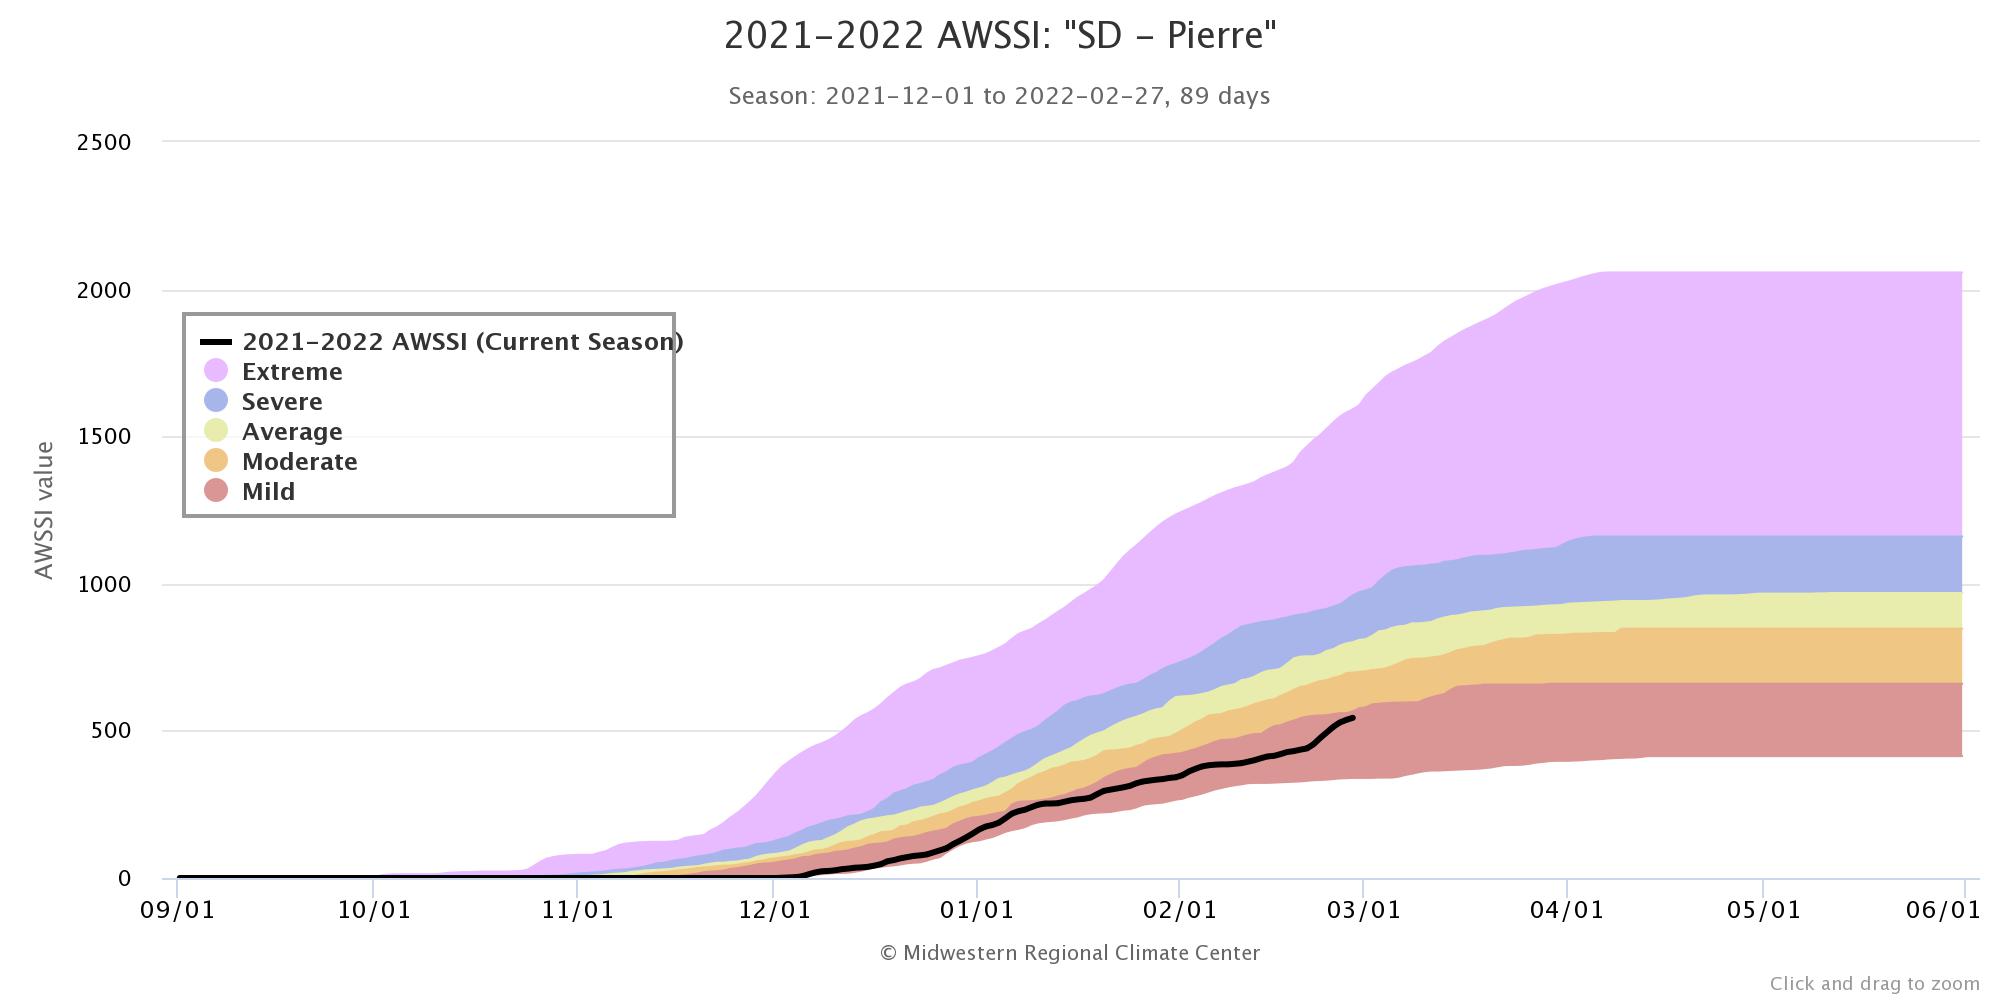
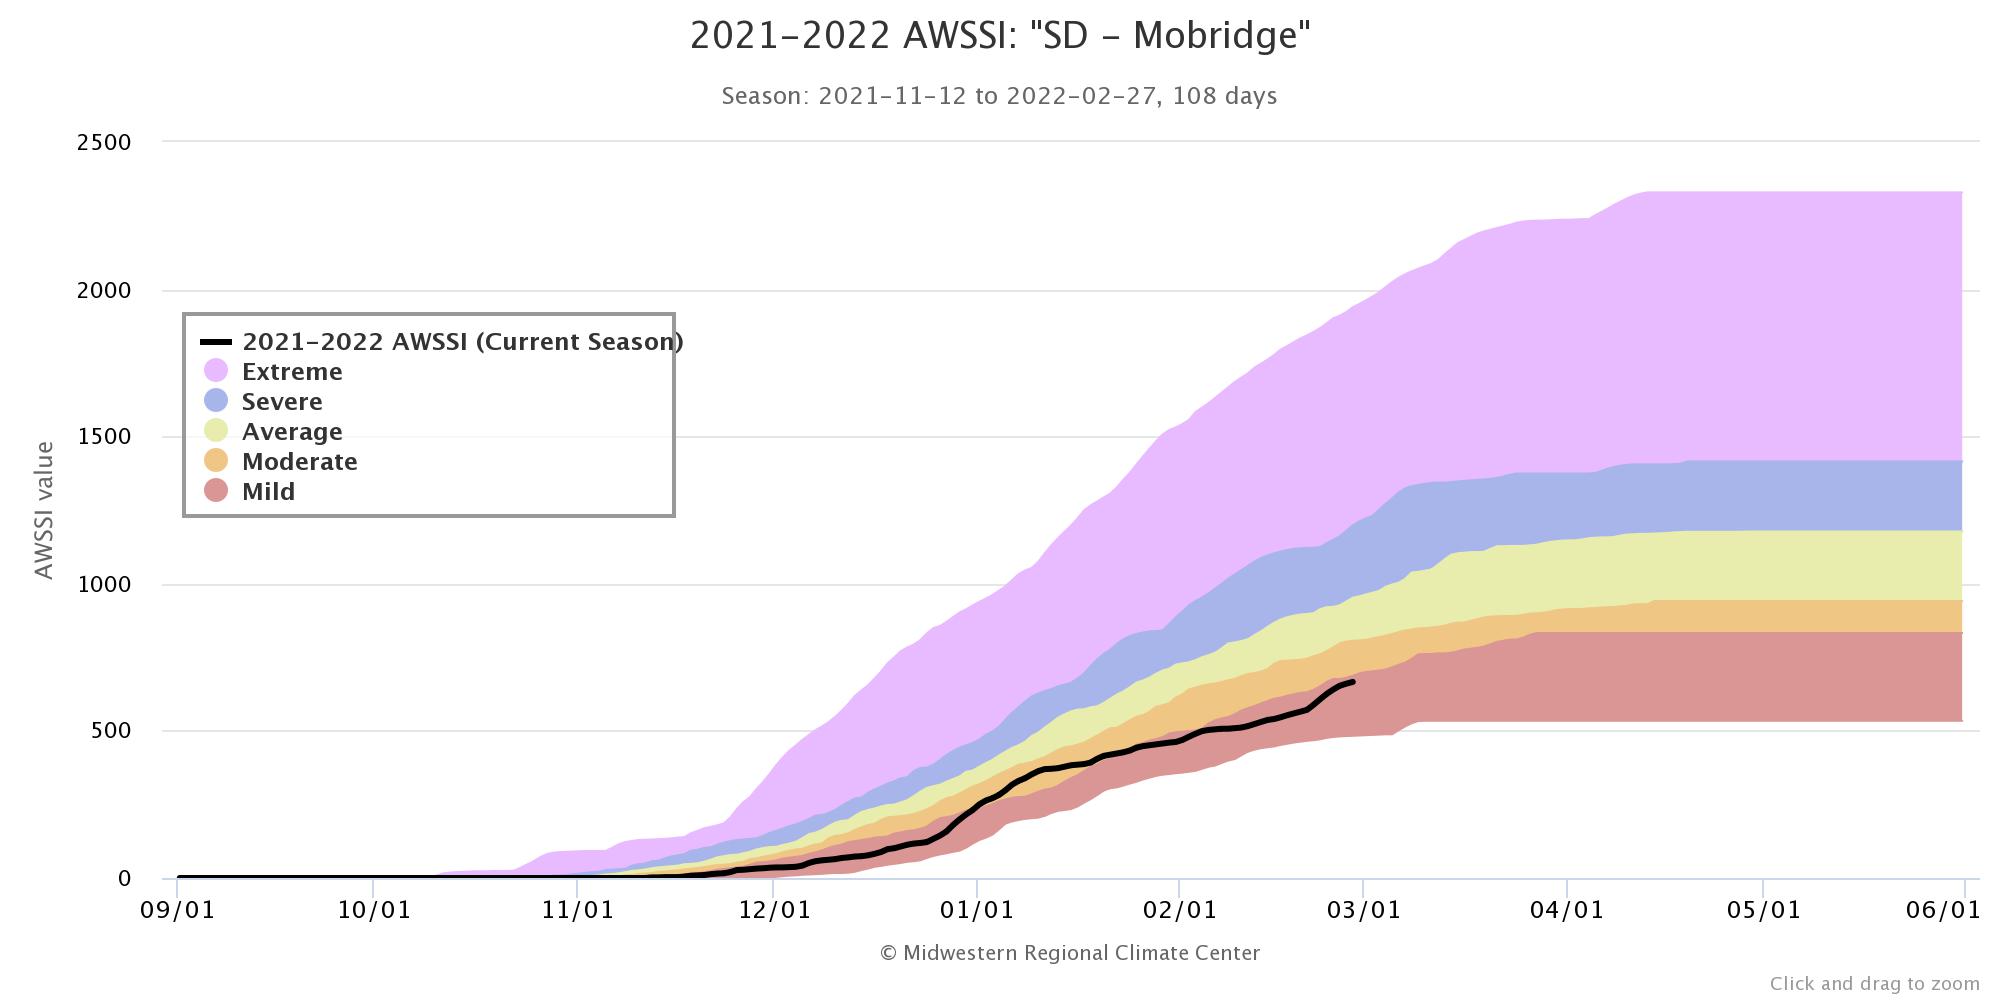
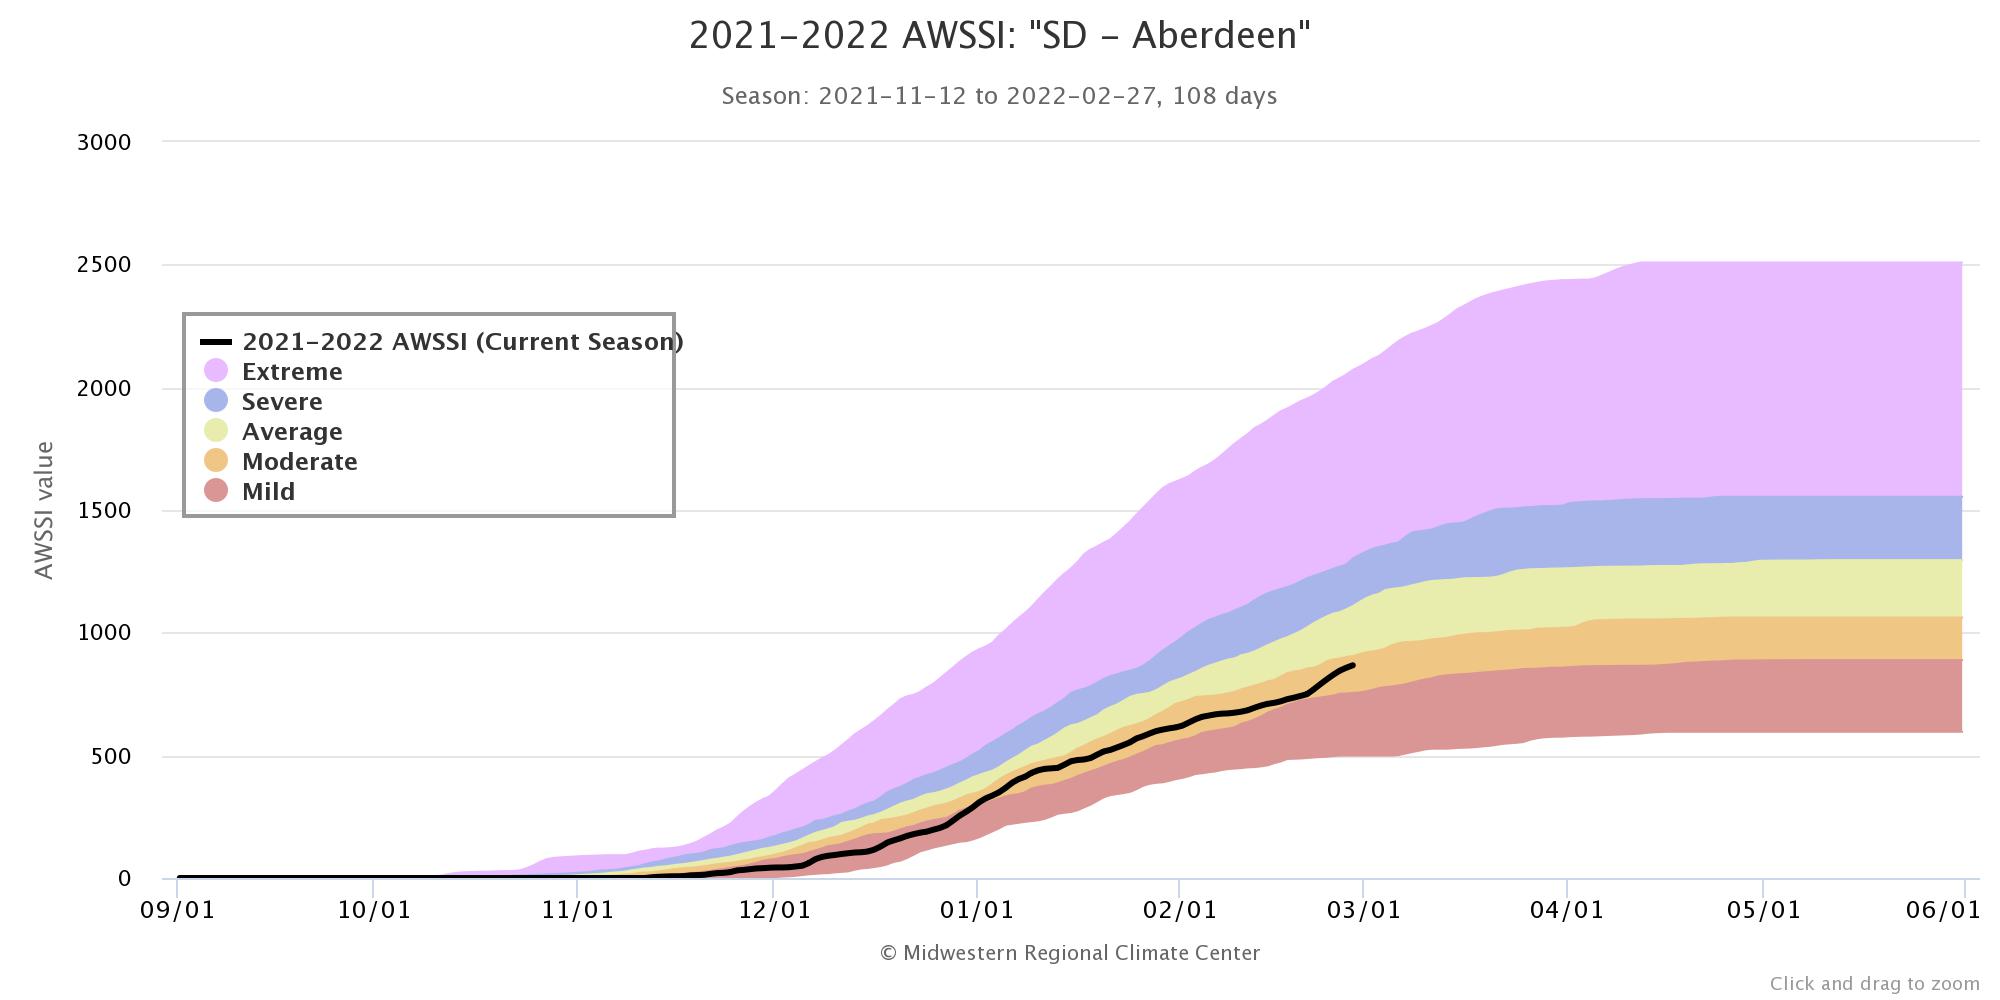
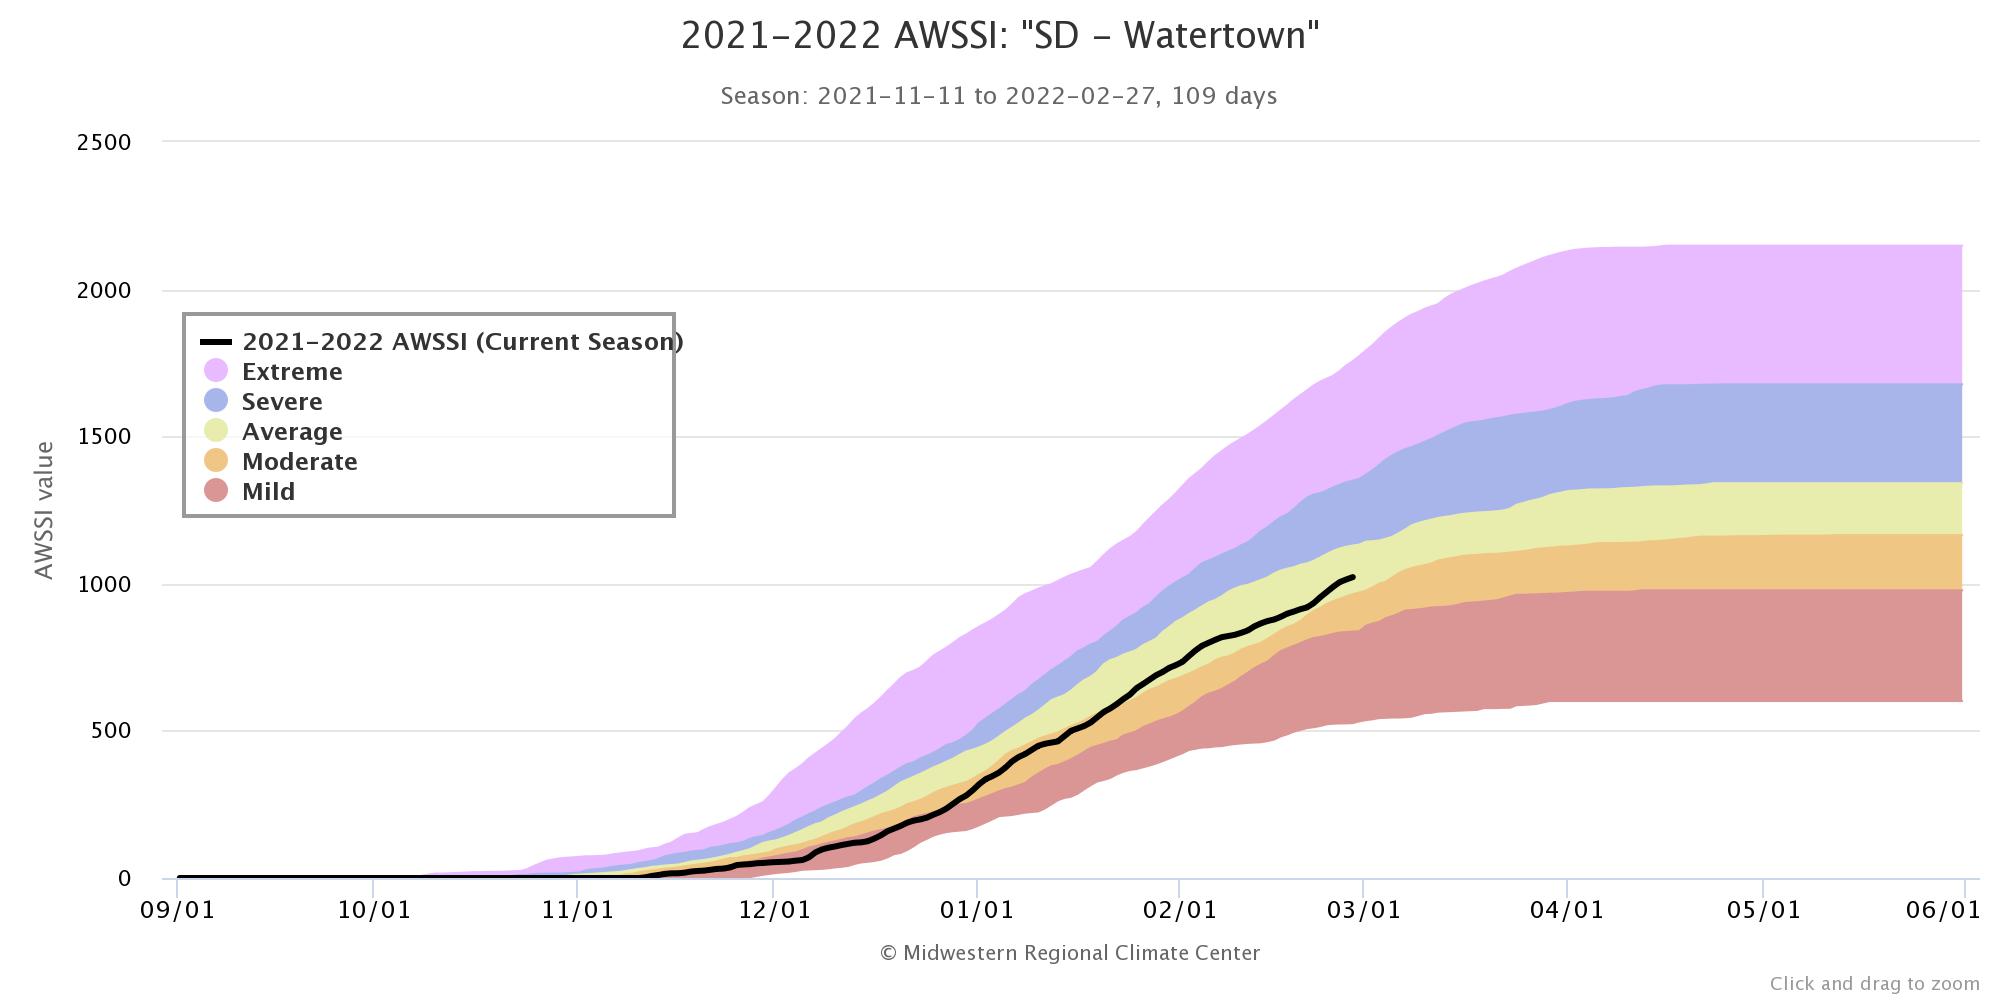
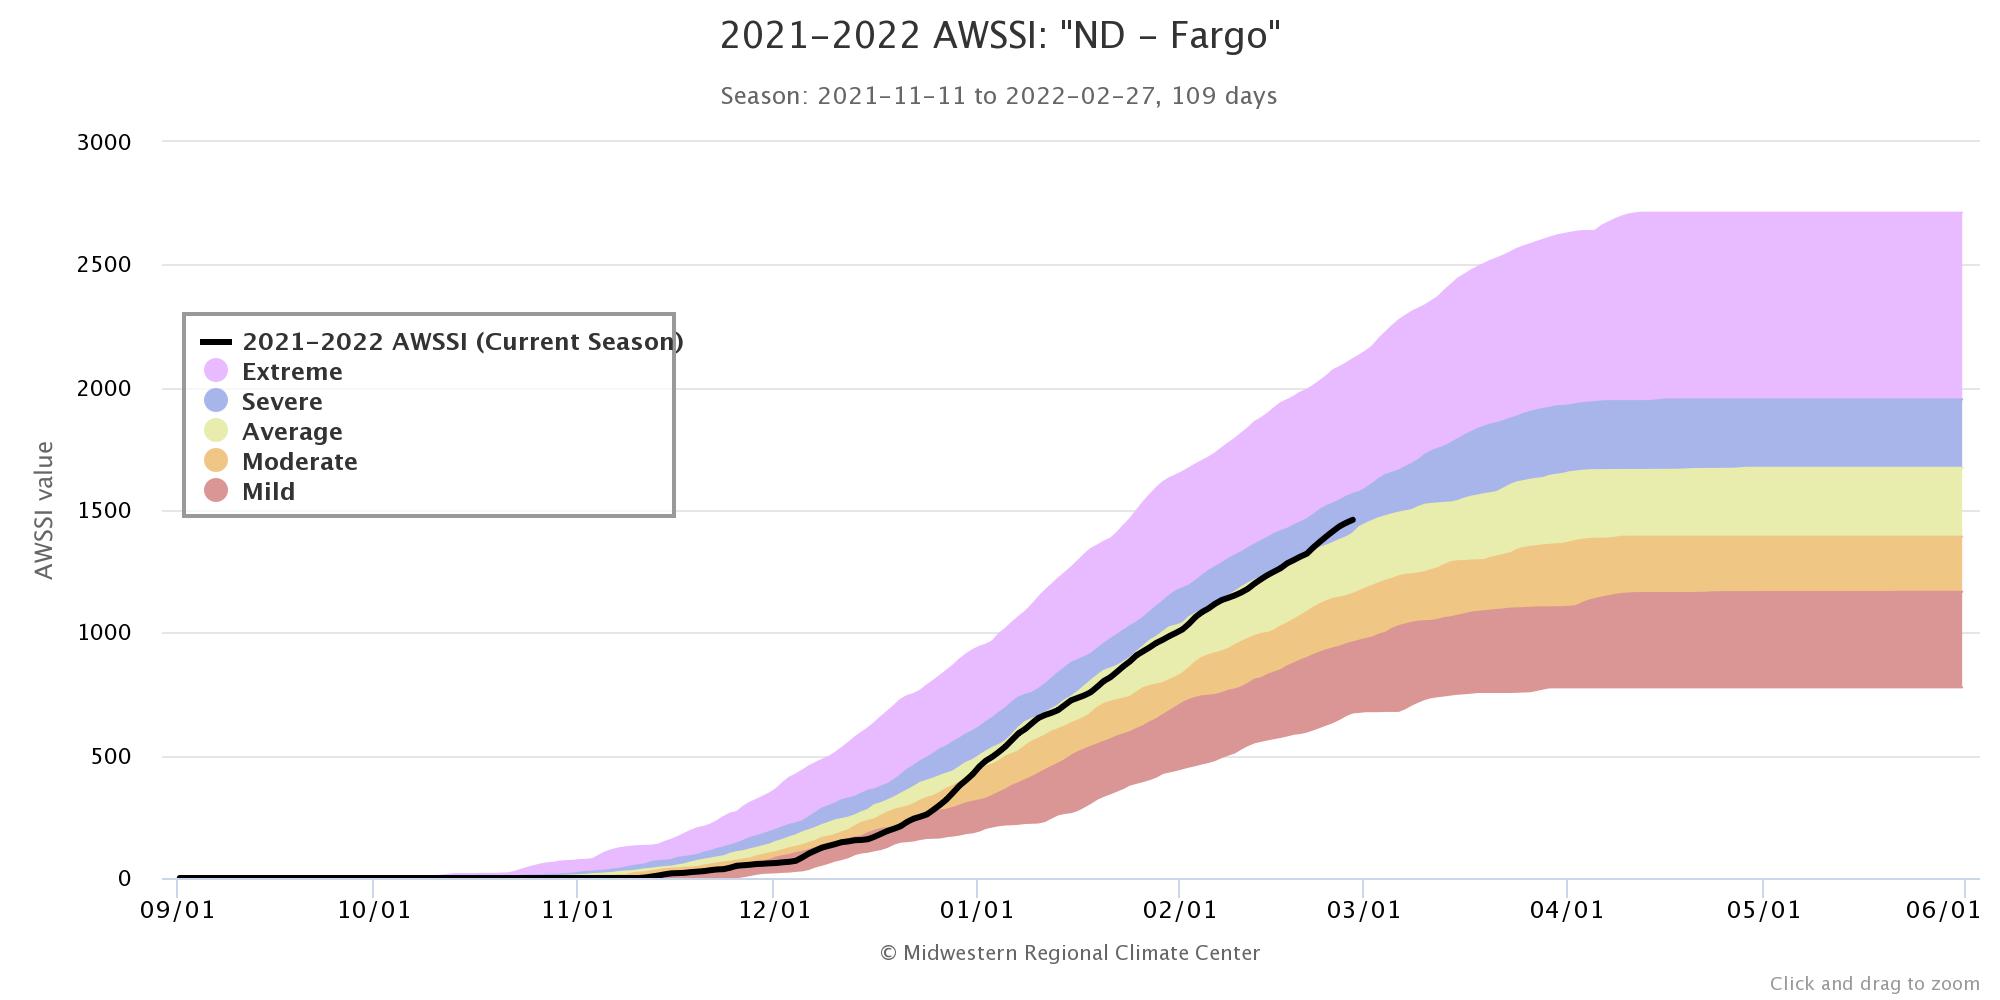
The Accumulated Winter Season Severity Index (AWSSI), from the MRCC, attempts to answer the question "How severe was this winter?" by comparing factors such as the intensity and persistence of cold weather, the amount of snow, and the amount and persistence of snow on the ground from this cold season to past seasons in the historical record for a select number of locations across the United States. Each location is then assigned a category - below is a snapshot as of March 1st. As you can see, Pierre, Mobridge and Aberdeen have had a "less severe than average" cold season thus far, whereas Watertown has generally had an "average" cold season. Areas further northeast though, such as at Fargo, ND, has had a "severe" cold season, and this category would likely apply to places like Sisseton as well.
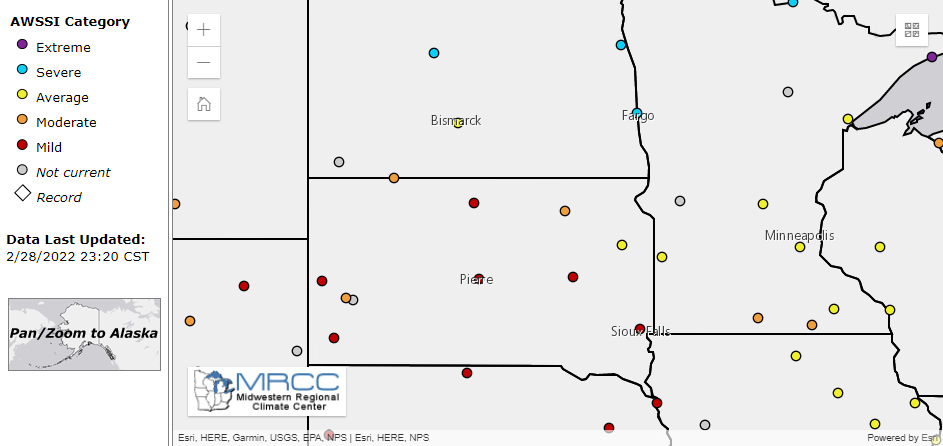
Below are graphs that plot out the AWSSI categories over time, at, and in this order, Pierre, Mobridge, Aberdeen, Watertown, and Fargo, ND, as of March 1st, 2022.