Overview
|
A potent and persistent outbreak of Arctic air affected our region from February 6th through 17th. The coldest days of the outbreak for many occurred on Sat, Feb 13th when Minnesota set a preliminary daily state record low temperature of -50 F (25 mi E of Ely) and Sun, Feb 14th (Valentine's Day) when local low temperatures dropped into the -20s and -30s F. Minimum wind chills of -35 to -55 F were recorded on several mornings as well. All of this, abruptly on the heels of what had been one of the mildest winter seasons on record up through the start of February. The magnitude of the cold during this outbreak is fairly rare when compared to the past 50 years, at least in terms of the persistence of the Arctic air, more closely resembling outbreaks from the late 1800s and the first half of the 1900s in some locations. This is especially impressive considering the lack of deep, fresh snow cover across the majority of the area. If there had been widespread deep, fresh snow pack ahead of this Arctic outbreak, low temperatures would have been more severe and more often approaching record territory. Impacts from this extreme and persistent cold include many frozen and/or broken water pipes (the limited snow depth did not help in this regard) and froze-over home sewer vents, dead vehicle batteries, school delays, church cancellations, and significant strains to the power grid as demand spiked both locally and across several other states. Thousands of customers were at least briefly without power locally, particularly during the morning of Tue, Feb 16th. Concerns for rolling blackouts lingered for several days in this regard, due to the continued extreme demand/strain, and folks were repeatedly asked to conserve energy however possible. The scope of this Arctic outbreak was wide-reaching, well beyond Minnesota and South Dakota. In fact, heavy snow, ice and relatively extreme cold reached well into Texas, having devastating effects. Over 3,000 daily cold records were set across the country, with around 80 all-time record cold readings (and at stations with at least 75 years of weather data). Much more information here. On the whole across the country, this Arctic air outbreak and the accompanying snow and ice will likely become a billion-dollar weather and climate disaster (overview on billion-dollar disasters here). |
 Average temperature (high and low combined) departures across the region for each day of the Arctic blast, beginning Feb 5th and ending Feb 18th, courtesy of the Midwestern Regional Climate Center. Values were well below 25 F below average for many through much of the outbreak. |
Observations
 |
 |
 |
 |
| Observed high & low temperatures (values) and departures from normal (shading) from Feb 1-17th at Aberdeen | Observed high & low temperatures (values) and departures from normal (shading) from Feb 1-17th at Watertown | Graph of observed temperatures at Aberdeen and Watertown from noon Wed, Feb 10th through 7pm Sat, Feb 13th (consistent streak of sub-zero temperatures) | Graph of observed temperatures at Aberdeen and Watertown from 7pm Sat, Feb 13th through 1pm Wed, Feb 17th (consistent streak of sub-zero temperatures) |
 |
 |
 |
 |
| Observed high & low temperatures (values) and departures from normal (shading) from Feb 1-17th at Pierre | Observed high & low temperatures (values) and departures from normal (shading) from Feb 1-17th at Mobridge | Observed high & low temperatures (values) and departures from normal (shading) from Feb 1-17th at Sisseton | South Dakota Mesonet consecutive hours at or below zero through the 16th, from @SDMesonet |
 |
 |
 |
Additional dangerously cold wind chills were observed throughout the Arctic blast. In particular (in addition to the listings shown left), wind chills as cold as ~45 below zero were observed on the mornings of Mon, Feb 15th and Tue, Feb 16th across the area |
| Minimum wind chills from the night of Fri, Feb 5th through the morning of Sat, Feb 6th | Minimum wind chills from the night of Thu, Feb 11th through the morning of Fri, Feb 12th | Minimum wind chills from the night of Sat, Feb 13th through the morning of Sun, Feb 14th |
 |
 |
 |
 |
| Boiling hot to free-standing noodles in less than 10 minutes in -1 F air on Sunday, Feb 14th in Aberdeen | Saturday afternoon, Feb 13th, of clouds that developed as all ice (as opposed to at least some liquid droplets) and yielded trace amounts of snow across the area | Total accumulated snowfall from Fri, Feb 5th to Wed, Feb 17th from the MRCC. Generally light snow fell from time to time across our forecast area. Heavier snows occurred further southwest, nearer the periphery of the coldest air. | Modeled snow depth as of Thu AM, Feb 18th, showing little to no snow for much of the area (about 4-8" across the Prairie Coteau and west central MN). Data from NOHRSC |
 |
 |
 |
 |
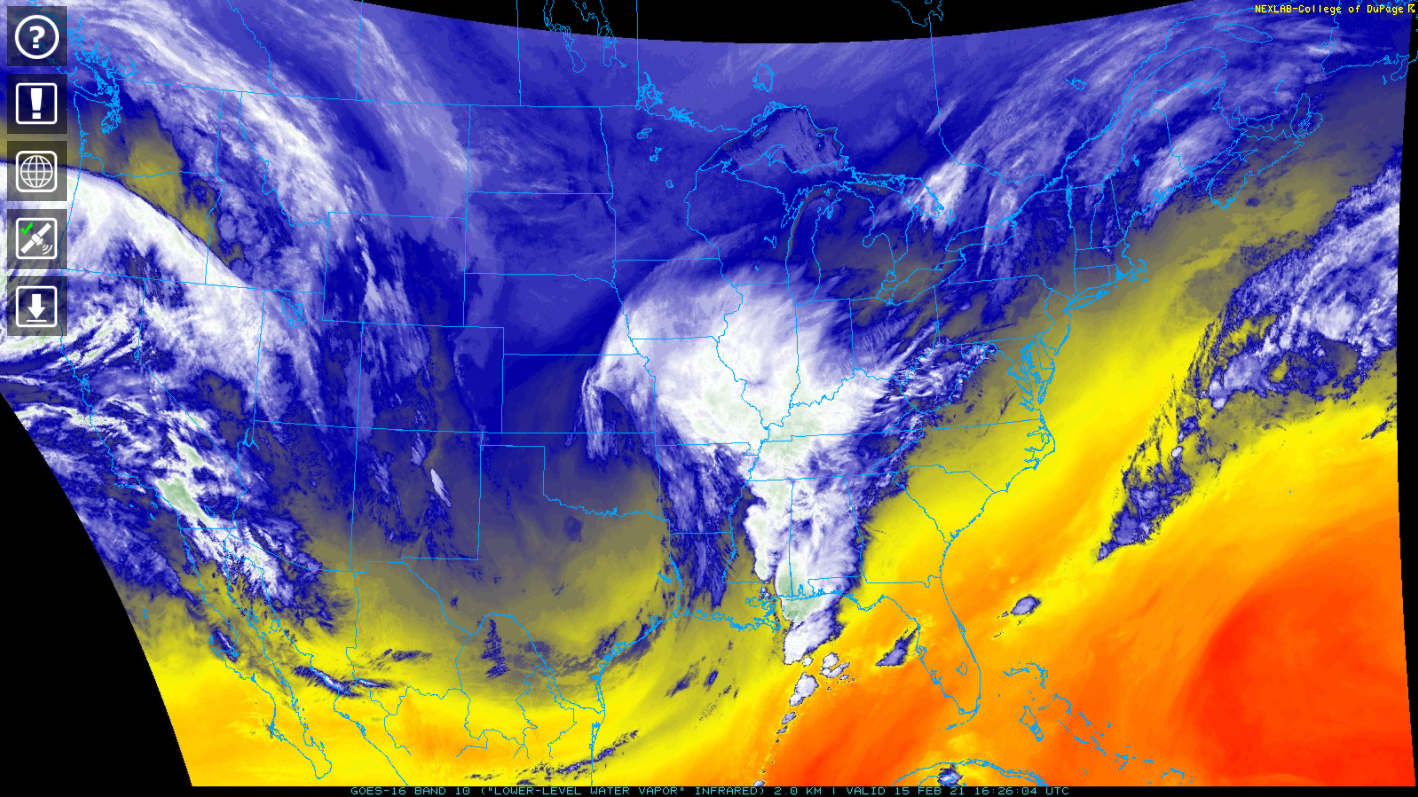
| GOES-16 infrared satellite imagery sensing increasingly cold temps *at the surface* during the evening of Feb 14th (common during this Arctic outbreak). Typically only clouds are cold enough to display (well below zero F). | Visible GOES-16 satellite imagery at 10:30 am on Mon, Feb 15th, showing the extent of snow cover across the country. Courtesy of the College of DuPage | Day Cloud Phase GOES-16 satellite imagery at 10:30 am on Mon, Feb 15th, showing the extent of snow cover across the country (represented by green). Courtesy of the College of DuPage | Low-level water vapor GOES-16 satellite imagery at 10:30 am on Mon, Feb 15th, showing a potent winter storm across the Southern US. Courtesy of the College of DuPage |
Perspective
Perspective on just how cold this Arctic outbreak was, historically speaking.
 |
 |
 |
 |
| These types of extended and extreme cold outbreaks are rare, especially over the past 50 years | At zero/sub-zero high temperature streaks at Aberdeen and Watertown | At zero/sub-zero high temperature streaks at Wheaton | Sub-zero temperatures were recorded for 280 hours (11.6 days) at Webster, ending on the morning of Wed, Feb 17th. Courtesy of the South Dakota Mesonet @SDMesonet |
 |
 |
 |
 |
| Single-digit high temperature streaks | Daily record cold highs and lows during the outbreak | How this Valentine's Day's cold ranked in history | NWS Aberdeen headlines for cold extended in at least some of the forecast area from Feb 5th through Feb 16th. From the ISU IEM |
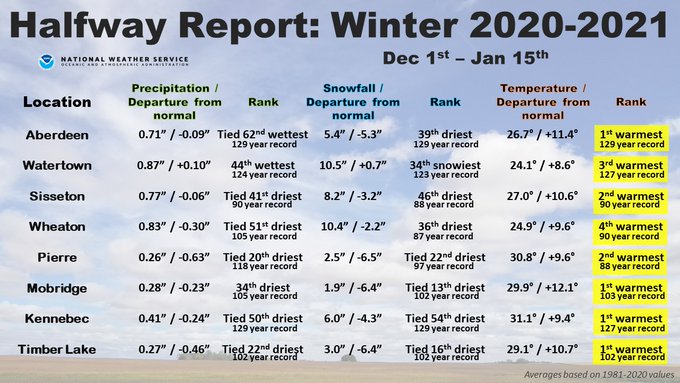
This Arctic outbreak abruptly ended a very warm period, from the beginning of the cold season through Feb 4th.
 |
 |
 |
 |
| Below zero temperatures were hard to come by through Feb 4th in the 2020-2021 cold season. | Below zero temperatures were hard to come by through Feb 4th in the 2020-2021 cold season. | Stats are only through the first half of winter, but are fairly representative through early February, as the above average temperatures persisted. | Stats are only through the first half of winter, but are fairly representative through early February, as the above average temperatures persisted. |
Perspective on the scope of this Arctic outbreak, geographically speaking.
 |
 |
 |
 |
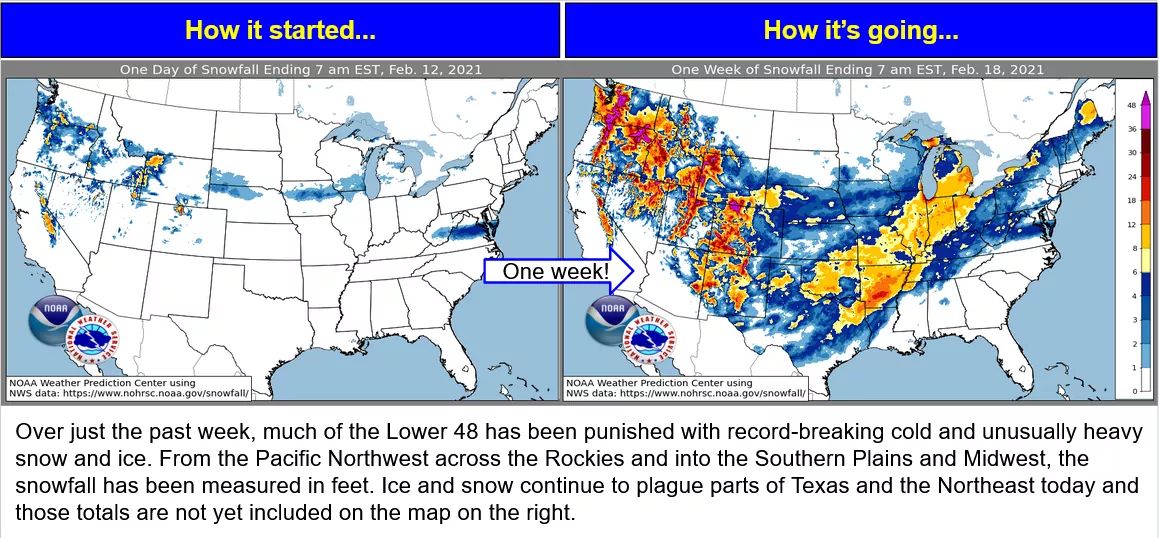
| National Weather Service Watches, Warnings and Advisories in effect at Noon Feb 14th (left) and 9am Feb 15th. This coverage of Wind Chill Warnings and Winter Storm Warnings is rare. | Observed snowfall across the Lower 48 States from 7am Feb 12th through 7am Feb 18th. | 73% of the Lower 48 States was covered in snow as of midnight CST, Feb 16th, as modeled by the National Water Center and NOHRSC. This is the greatest extent on record which dates back to 2003. | # of hours at or below zero from Feb 11-17th |
 |
 |
 |
 |
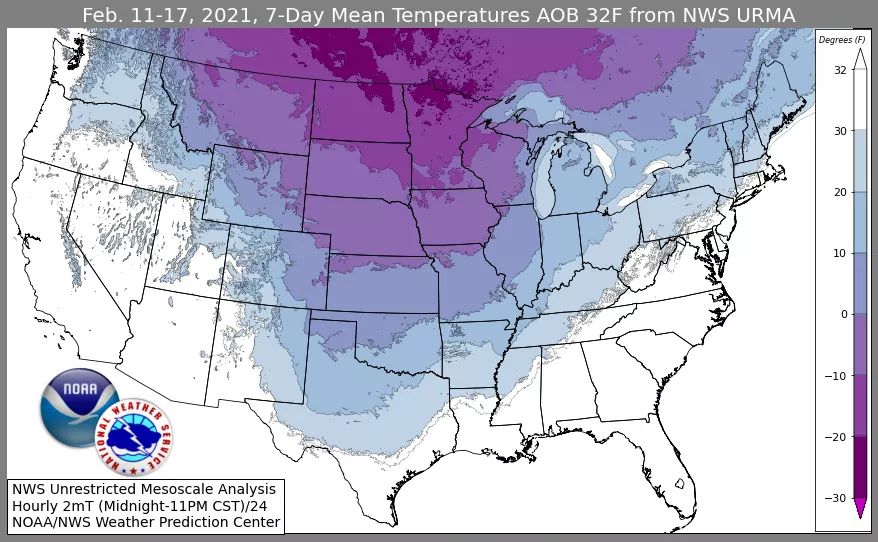
| # of hours at or below freezing/32 F from Feb 11-17th | 7-day mean temperature from Feb 11-17th | Average temperature (high and low combined) across the region Feb 5th through Feb 18th, courtesy of the Midwestern Regional Climate Center. | An ice jam developed on the Missouri River as far south as the Jefferson City, MO area on Feb 18th (began breaking up on the 23rd). |
 |
Media use of NWS Web News Stories is encouraged! Please acknowledge the NWS as the source of any news information accessed from this site. |
 |