Record setting heat is expected over the next several days from the Intermountain West through the northern Plains. Furthermore, fire weather concerns increase with dry and breezy conditions. Meanwhile, heavy rainfall and severe thunderstorm threats for the Ohio/Tennessee Valleys, central Appalachians and Southeast today. The threat shifts to central Gulf Coast and across central Texas this week. Read More >
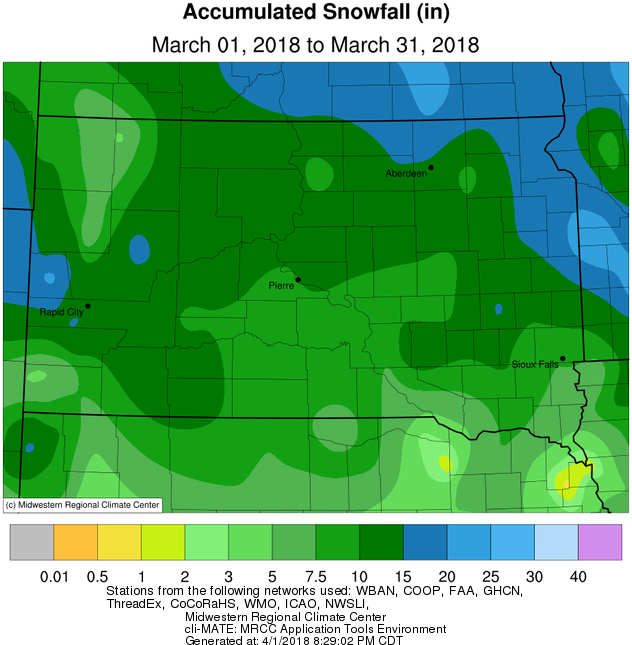
March picked up where February left off – more cold and snow. Thanks in large part to a major winter storm on March 5th and 6th, snowfall totals ranged generally from 2 to 12 inches above average across central/northeastern South Dakota and west central Minnesota. This system broke many daily snowfall and precipitation records, as anywhere from 4 to 18 inches of snow fell during that 2-day period alone. Wheaton, MN picked up 1.20” of moisture on the 5th alone, which is only 0.28” away from their average March total. More information here: https://www.weather.gov/abr/20180305-6_WinterStorm. A generally active precipitation pattern persisted through the rest of the month as well, leading to much above average monthly snowfall amounts. Sisseton recorded their 5th snowiest March on record, Wheaton ranked 7th and Watertown 8th.
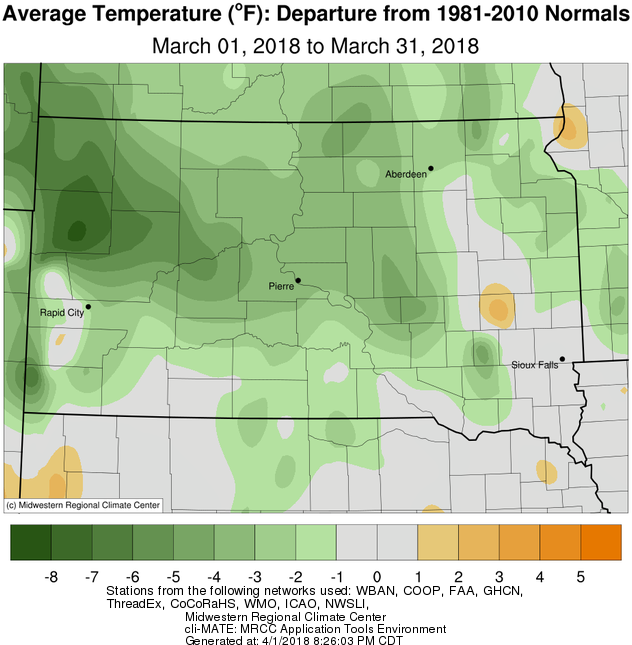
Temperatures on a whole during March 2018 were generally below average, by as much as 3 to 5 degrees across central South Dakota. Some of the coldest air came through on the 8th when low single digits above zero were recorded widespread. On the last day of the month, cold air combined with strong winds to produce wind chills as cold as -18 degrees across north central South Dakota! Watertown failed to reach 50 degrees this March. For perspective the average is 6 days, and March 2016 produced 17 days above 50.
|
MARCH 2018 |
||||
|
Temperature Data |
Aberdeen |
Sisseton |
Wheaton |
Watertown |
|
Warmest Temperature / Date |
56 / 27th |
45 / 27th |
*53 / 27th |
46 / 27th |
|
Coldest Temperature / Date |
-8 / 1st |
4 / 8th, 9th |
2 / 1st |
3 / 8th |
|
Average High / Departure from Normal |
36.3 / -3.7 |
34.9 / -4.4 |
*38.9 / +2.1 |
34.4 / -4.5 |
|
Average Low / Departure from Normal |
20.4 / +0.6 |
20.2 / -0.6 |
*22.9 / +4.9 |
20.7 / +0.8 |
|
Monthly Average / Departure from Normal |
28.3 / -1.6 |
27.5 / -2.5 |
*32.8 / +3.5 |
27.5 / -1.9 |
|
Precipitation Data |
||||
|
Monthly Precipitation / Departure from Normal |
1.59 / +0.43 |
1.64 / +0.52 |
2.29 / +0.81 |
1.41 / +0.3 |
|
Monthly Snowfall / Departure from Normal |
14.1 / +6.9 |
19.7 / +11.4 |
17 / +8.7 |
16.2 / +10 |
|
Most Precipitation in 24 hours / Date |
0.90 / 5th |
0.56 / 5th |
1.20 / 5th |
0.55 / 5th |
|
Most Snow in 24 hours / Date |
8.2 / 5th |
6.2 / 5th |
10 / 5th |
7.1 / 5th |
|
Temperature Data |
Pierre |
Kennebec |
Mobridge |
Timber Lake |
|
Warmest Temperature / Date |
59 / 27th |
60 / 27th |
58 / 27th |
56 / 27th |
|
Coldest Temperature / Date |
0 / 8th |
3 / 8th |
1 / 8th |
3 / 8th |
|
Average High / Departure from Normal |
39.3 / -6.1 |
44.3 / -3.6 |
37.1 / -5.5 |
37.9 / -5.3 |
|
Average Low / Departure from Normal |
22.4 / -1.1 |
24.2 / +0.8 |
21.3 / +0.2 |
20.2 / -1.3 |
|
Monthly Average / Departure from Normal |
30.8 / -3.6 |
34.5 / -1.2 |
29.2 / -2.7 |
29.3 / -3.1 |
|
Precipitation Data |
||||
|
Monthly Precipitation / Departure from Normal |
1.40 / +0.17 |
1.14 / -0.12 |
0.94 / +0.04 |
1.36 / +0.21 |
|
Monthly Snowfall / Departure from Normal |
11.0 / +5.0 |
4.6 / -3.4 |
11.9 / +6.0 |
11.6 / +4.0 |
|
Most Precipitation in 24 hours / Date |
0.51 / 5th |
0.64 / 16th |
0.25 / 19th |
0.38 / 23rd |
|
Most Snow in 24 hours / Date |
7.6 / 5th |
1.5 / 16th |
4.1 / 5th |
3.6 / 6th |
The asterisk * indicates temperature data that is anomalously warm and likely faulty (also evident on the below MRCC graphic). The issue is being looked into.
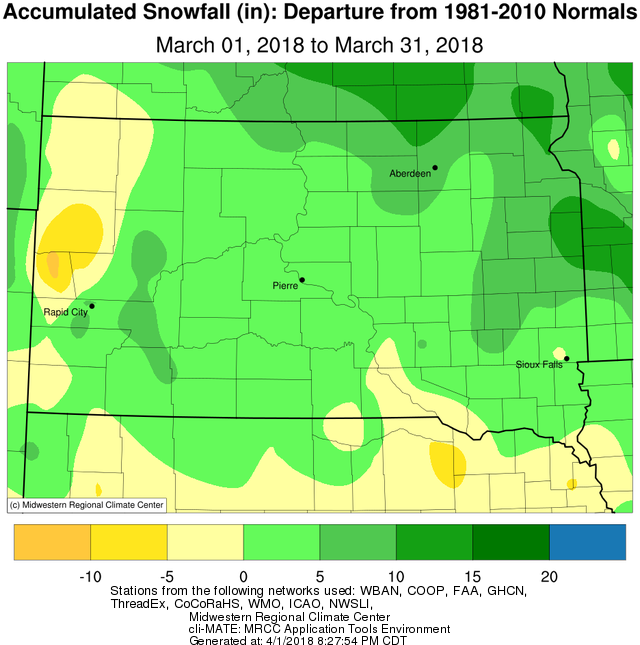
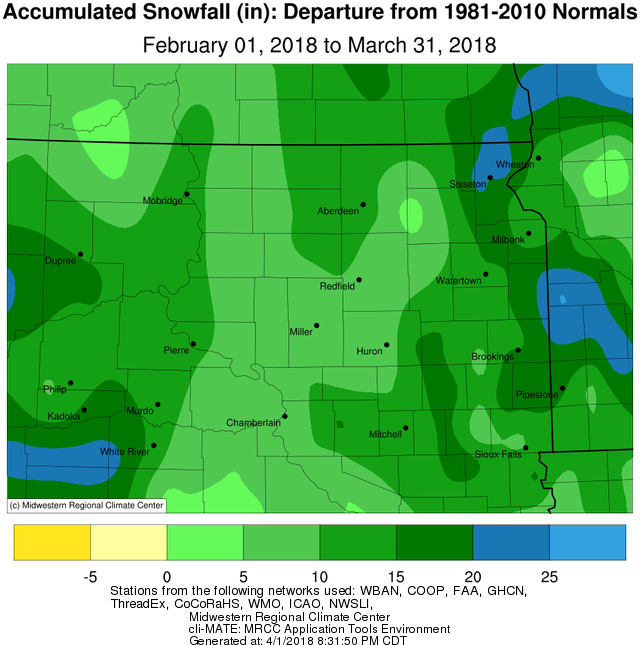
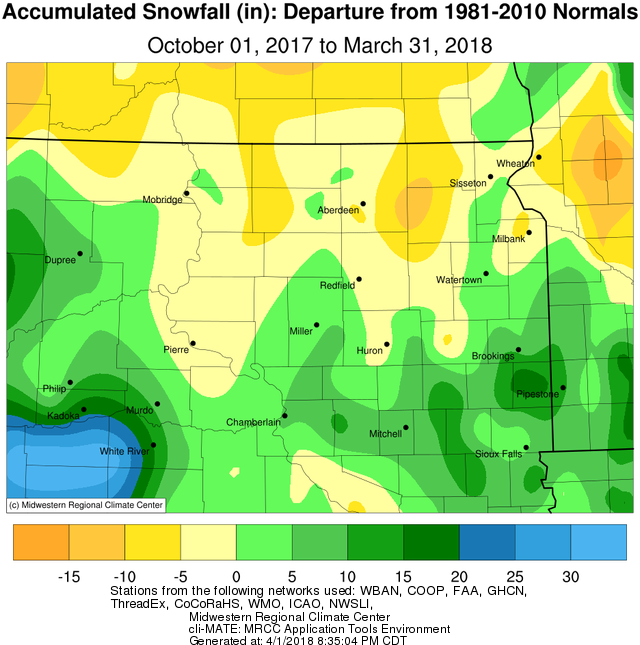
March temperature departures and snowfall totals and departure images below are courtesy of the Midwestern Regional Climate Center.
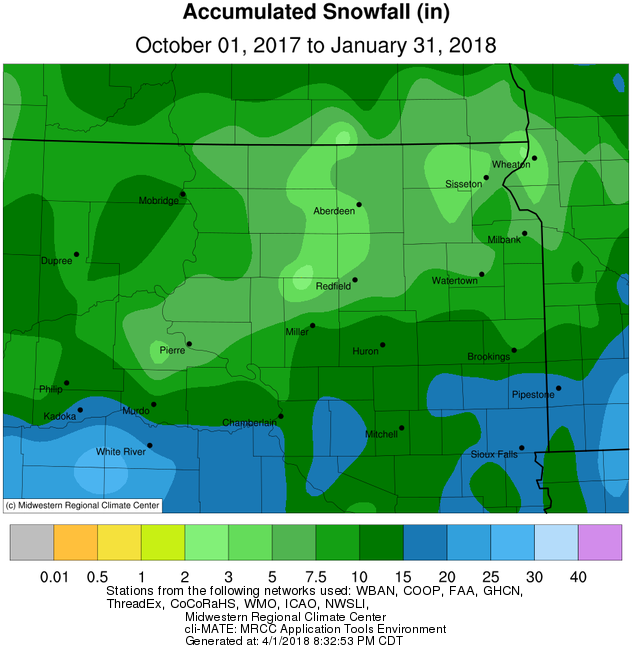
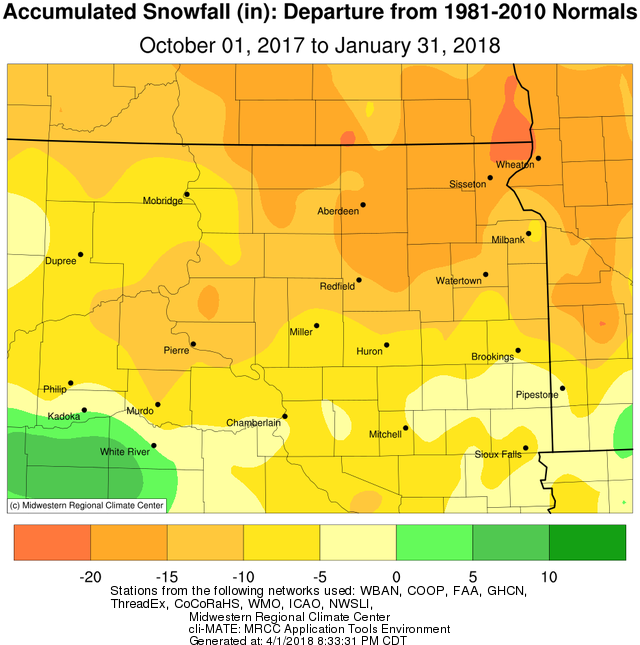
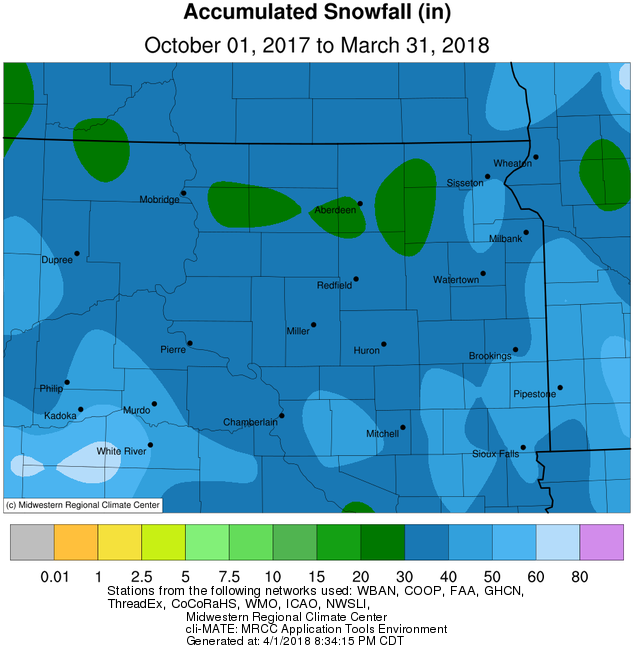
The season as a whole has been bipolar snowfall-wise, to say the least. Significant snow departures had developed by the end of January, but amazingly, February and March have combined to restore near-normal seasonal amounts.
Snowfall totals and departures from October 1st through January 31st, courtesy of the MRCC.
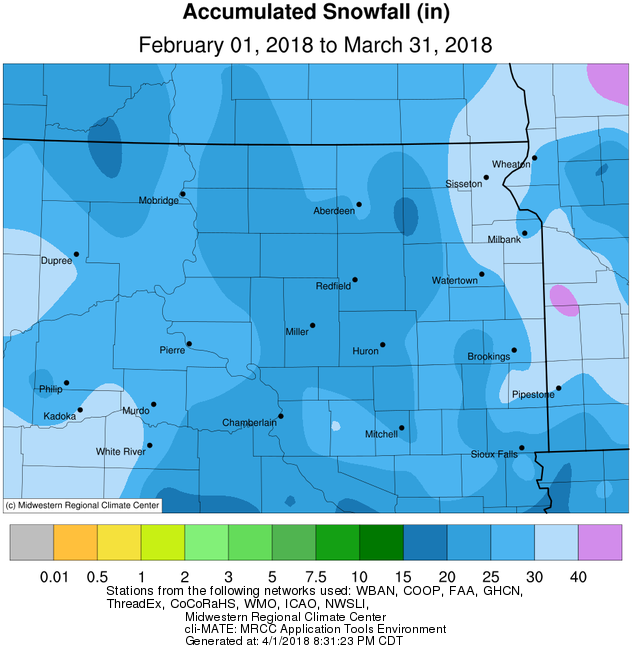
Snowfall totals and departures from February 1st through March 31st, courtesy of the MRCC.
Snowfall totals and departures from October 1st through March 31st, courtesy of the MRCC.
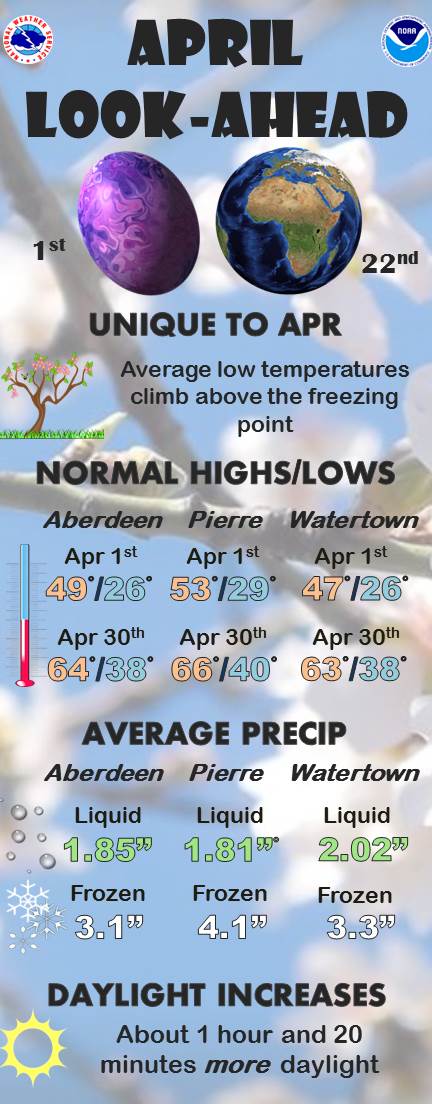
What does April have in store? Signs point towards more snow and cold, in above average proportions, through at least the first 2 weeks (http://www.cpc.noaa.gov/). Regardless, here's what a typical April looks like for perspective.