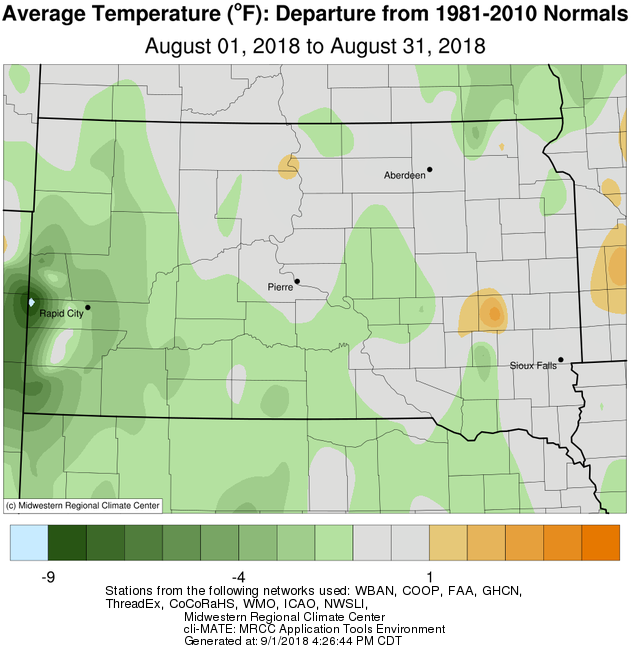
August 2018 was near normal in terms of temperatures on a whole. Record cold was recorded however, at both Aberdeen and Sisseton on the 2nd: 40 degrees and 42 degrees respectively. There were a number of days where thick smoke from Western U.S. and Southwestern Canadian wildfires blocked out enough sunlight to reduce daytime high temperatures by a few degrees. Smoke was thick enough even at the surface to reduce visibility, and the air smelled of it as well. Haze filled our skies on and off again throughout much of the month thanks to a favorable upper-level wind pattern and an active fire season.
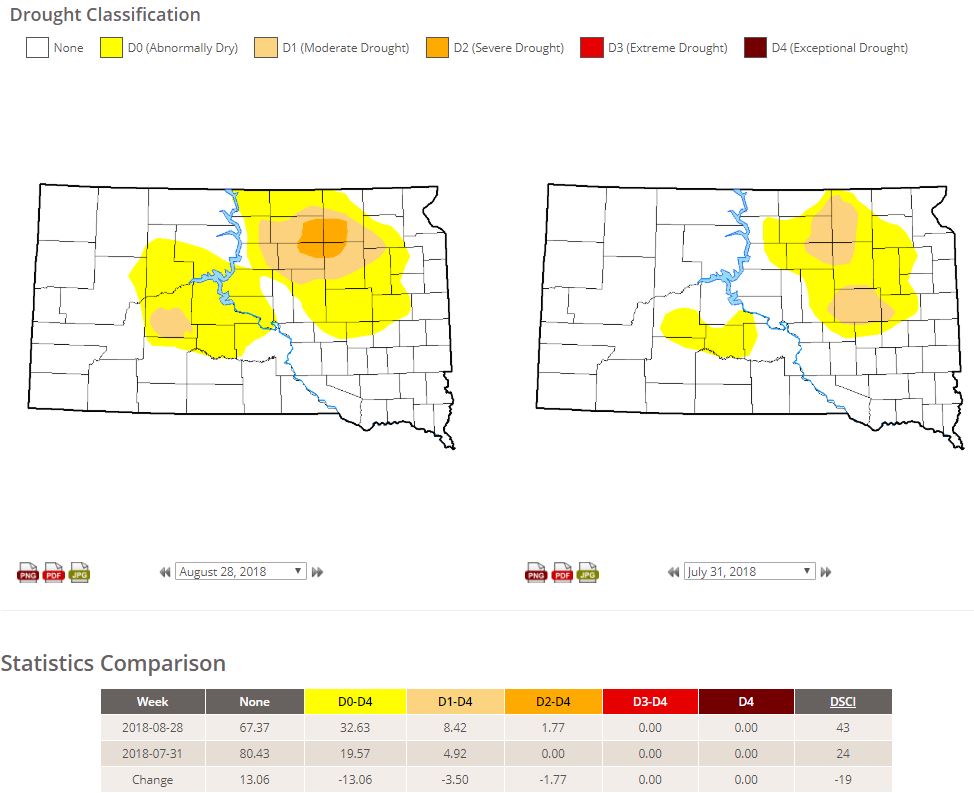
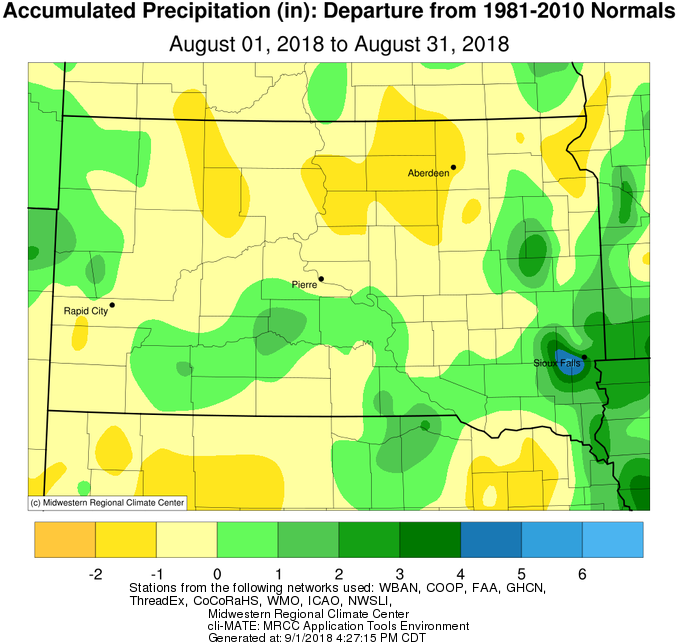
Precipitation departures range from up to 2” below average and up to 3” above average. Those who entered the month dry generally remained as such, and thus the U.S. Drought Monitor changed little throughout the month. D2/Severe Drought continues to impact portions of Brown, Spink, Edmunds and Faulk counties as of the 28th. Further west, severe weather was a reoccurring theme especially towards the end of the month. Typically, after the jet stream jogs north into Canada in July, it tracks back into the Northern Plains in August and so a “secondary severe weather season” can emerge. This season’s began on the 23rd when Hyde county observed two tornadoes and a 3” diameter hailstone fell just northwest of Hoven (https://www.weather.gov/abr/SevereWeatherSummary8-23-18). 4” diameter hail fell in Blunt on the 26th, and 3.5” diameter hail fell near Presho on the 27th. Hailstones this large are fairly uncommon, as these events accounted for 3 of the 41 days that our forecast area (http://tinyurl.com/jzlnoq8) has had reports of 3” or larger diameter hail since 1950 and one of the 25 days with 4” or larger diameter hail (last occurrence on June 21st, 2013 in Spink County). Therefore, on average, a 3” hailstone is recorded about once every other year and a 4” hailstone about once every three years.
|
AUGUST 2018 |
||||
|
Temperature Data |
Aberdeen |
Sisseton |
Wheaton |
Watertown |
|
Warmest Temperature / Date |
96 / 8th, 13th |
90 / 8th, 13th |
93 / 13th |
89 / 13th, 8th |
|
Coldest Temperature / Date |
40 / 2nd |
42 / 29th |
45 / 29th |
44 / 29th |
|
Average High / Departure from Normal |
83.2 / +1.4 |
79.4 / -1.4 |
78.5 / -2.2 |
78.5 / -1.4 |
|
Average Low / Departure from Normal |
56.3 / +0.1 |
57.0 / -0.4 |
58.3 / +0.1 |
58.5 / +1.3 |
|
Monthly Average / Departure from Normal |
69.8 / +0.8 |
68.2 / -0.9 |
68.4 / -1.0 |
68.5 / -0.1 |
|
Precipitation Data |
||||
|
Monthly Precipitation / Departure from Normal |
0.84 / -1.59 |
1.14 / -1.30 |
1.21 / -1.61 |
3.02 / +0.24 |
|
Most Precipitation in 24 hours / Date |
0.37 / 19th |
0.68 / 19th |
0.55 / 7th |
1.31 / 19th |
|
Temperature Data |
Pierre |
Kennebec |
Mobridge |
Timber Lake |
|
Warmest Temperature / Date |
103 / 11th |
101 / 11th |
103 / 10th |
99 / 12th |
|
Coldest Temperature / Date |
43 / 29th |
44 / 29th |
46 / 29th |
43 / 29th |
|
Average High / Departure from Normal |
88.3 / +1.0 |
87.5 / -0.9 |
87.9 / +3.1 |
84.9 / -0.5 |
|
Average Low / Departure from Normal |
58.8 / -1.3 |
58.0 / -2.0 |
59.1 / +1.2 |
56.2 / -1.7 |
|
Monthly Average / Departure from Normal |
73.5 / -0.2 |
73.0 / -1.2 |
73.5 / +2.1 |
70.6 / -1.0 |
|
Precipitation Data |
||||
|
Monthly Precipitation / Departure from Normal |
0.90 / -0.90 |
2.26 / +0.33 |
0.79 / -1.24 |
1.09 / -0.62 |
|
Most Precipitation in 24 hours / Date |
0.30 / 19th |
0.67 / 7th |
0.40 / 23rd |
0.49 / 26th |
Temperature departures during the month of August, from the Midwestern Regional Climate Center
Precipitation departures during the month of August, from the Midwestern Regional Climate Center
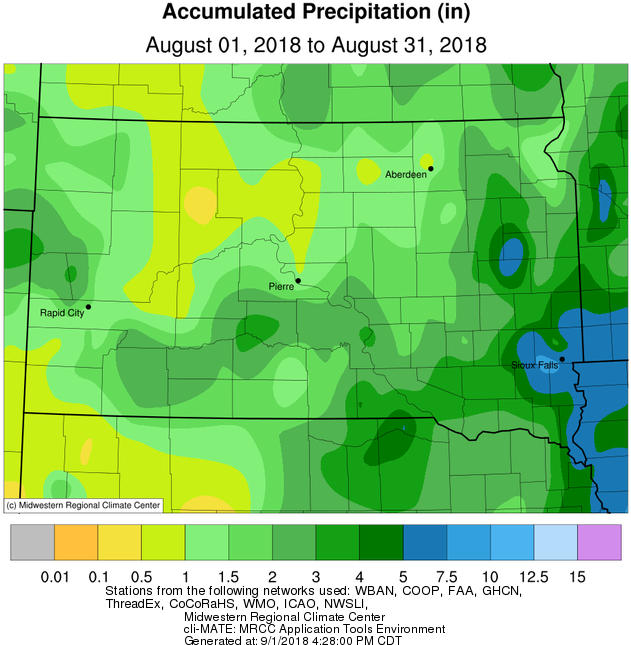
Precipitation totals during the month of August, from the Midwestern Regional Climate Center
U.S. Drought Monitor comparison between the beginning (right) and end (left) of August, from the University of Nebraska - Lincoln