Wildfire smoke will push into the Midwest, worsening air quality. A frontal system brings severe storms from the Northern Plains to the Mid‑Atlantic the next few days. Heavy Gulf Coast rain is possible as Tropical Depression Two has formed, while monsoonal storms persist in the Southwest with heavy rainfall. Hazardous heat expands from the Plains into the Lower Mississippi Valley. Read More >
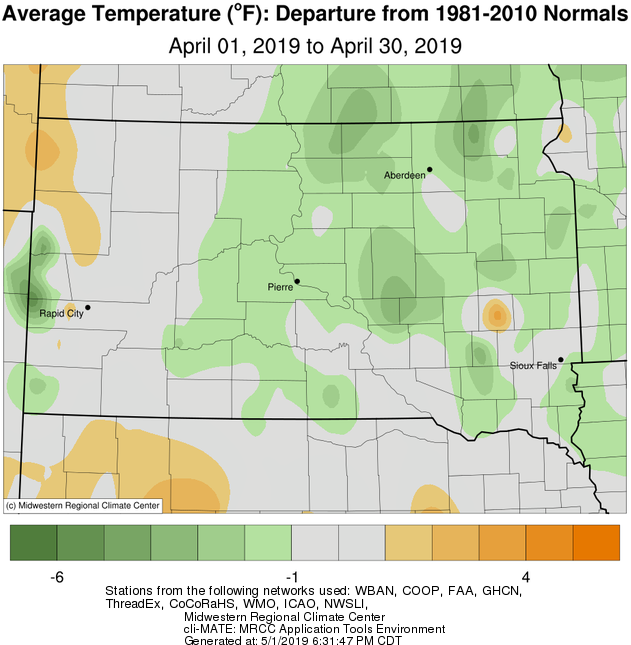
April 2019 featured generally slightly below average temperatures on a whole. Two main waves of above average temperatures were observed, one in early April and another in mid to late April. The 20th had high temperatures in the mid 80s to low 90s. Otherwise, conditions were on the chilly side with numerous daytime highs of 10-15 or more degrees below average. Sisseton set a daily record for a low temperature of 14 degrees on the 14th.
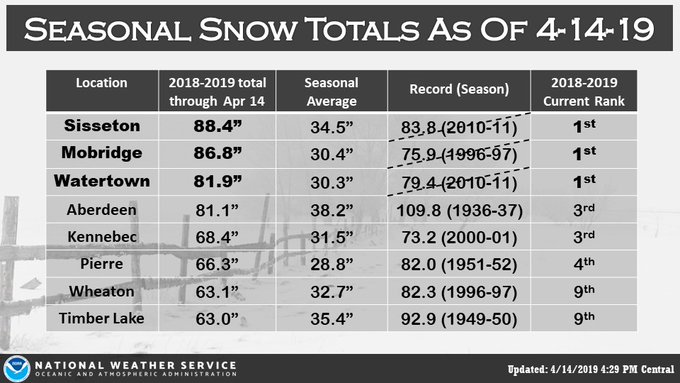
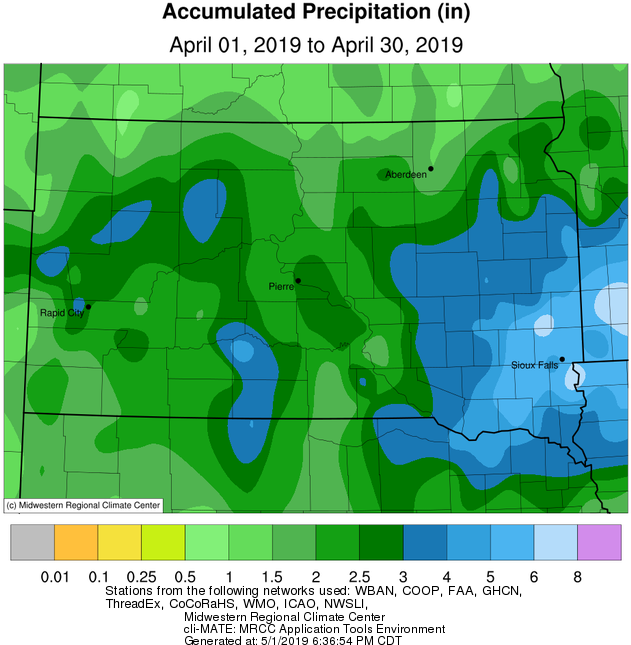
Generally above average precipitation was recorded this month, and much above average snowfall. Watertown had its 10th wettest April on record. Sisseton, Wheaton and Watertown had their 2nd snowiest April on record, 5th in Pierre, 6th in Kennebec, 9th in Mobridge and 10th in Aberdeen. This was due exclusively to a winter storm of historic proportions, which affected the area from the 10th through the 12th. Daily records for precipitation and snowfall, as well as much more information, can be found here: https://www.weather.gov/abr/April112019BlizzardSummary
As a result of more moisture on top of already saturated soils and swollen streams and lakes, flooding continued to plague the area. As of April 30th, a couple river gauges on the James River remain at Major Flood Stage.
|
APRIL 2019 |
||||
|
Temperature Data |
Aberdeen |
Sisseton |
Wheaton |
Watertown |
|
Warmest Temperature / Date |
86°/ 20th |
83°/ 20th |
82°/ 20th |
80°/ 20th |
|
Coldest Temperature / Date |
17°/ 14th |
14°/ 14th |
23°/ 14th |
14°/ 14th |
|
Average High / Departure from Normal |
54.5°/ -2.5° |
51.9°/ -4.4° |
54.1°/ -1.1° |
52.0°/ -3.6° |
|
Average Low / Departure from Normal |
33.3°/ +1.5° |
34.4°/ +1.8° |
37.4°/ +5.4° |
32.6°/ +0.5° |
|
Monthly Average / Departure from Normal |
43.9°/ -0.5° |
43.2°/ -1.3° |
45.8°/ +2.2° |
42.3°/ -1.5° |
|
Precipitation Data |
||||
|
Monthly Precipitation / Departure from Normal |
1.42”/ -0.43” |
2.95”/+0.67” |
2.02”/ -0.22” |
3.99”/+1.97” |
|
Most Precipitation in 24 hours / Date |
0.50”/ 11th |
0.83”/ 11th |
0.79”/ 11th |
1.26”/11th |
|
Monthly Snowfall / Departure from Normal |
13.6” / +10.5” |
18.6”/ +14.8” |
12.5” / +8.1” |
25.0”/ +21.7” |
|
Most Snow in 24 hours / Date |
6.4” / 11th |
11.3” / 11th |
8.0” / 11th |
13.0” / 11th |
|
Temperature Data |
Pierre |
Kennebec |
Mobridge |
Timber Lake |
|
Warmest Temperature / Date |
90°/ 20th |
90°/ 20th |
88°/ 20th |
83°/ 20th |
|
Coldest Temperature / Date |
23°/ 13th |
20°/ 13th |
18°/ 13th |
19°/ 13th |
|
Average High / Departure from Normal |
56.6°/ -3.1° |
60.3°/ -1.9° |
55.2°/ -2.8° |
54.7°/ -4.1° |
|
Average Low / Departure from Normal |
33.9°/ -0.3° |
33.8°/ -0.2° |
33.6°/ +1.1° |
33.4°/ +0.7° |
|
Monthly Average / Departure from Normal |
45.3°/ -1.7° |
47.3°/ -0.8° |
44.4°/ -0.9° |
44.4°/ -1.4° |
|
Precipitation Data |
||||
|
Monthly Precipitation / Departure from Normal |
3.27”/ +1.46” |
2.89”/ +0.73” |
2.07”/+0.50” |
2.45”/ +0.75” |
|
Most Precipitation in 24 hours / Date |
1.04”/ 11th |
0.97”/ 10th |
0.79”/ 10th |
0.51”/ 10th |
|
Monthly Snowfall / Departure from Normal |
16.1” / +12.0” |
18.7” /+14.8" |
10.6”/ +7.4” |
9.7”/ +4.4" |
|
Most Snow in 24 hours / Date |
10.2”/ 11th |
13.5” / 11th |
6.6” / 11th |
5.9” / 10th |
Temperature departures from normal, from the Midwestern Regional Climate Center
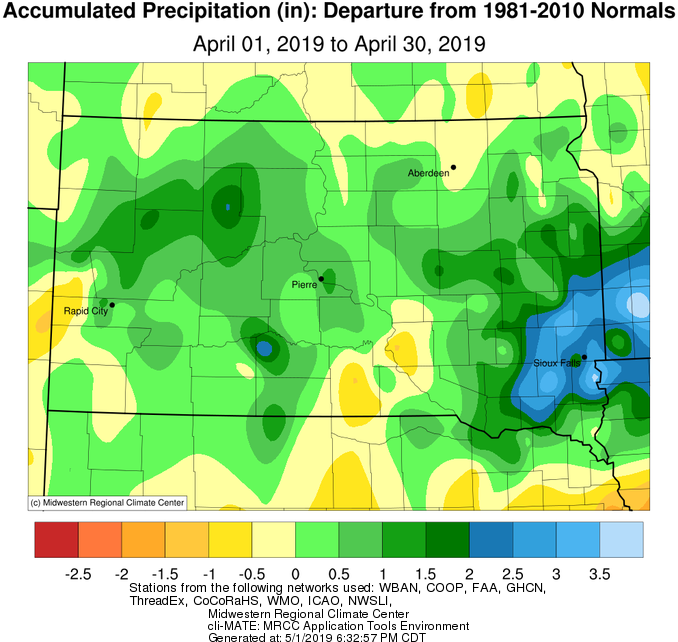
Precipitation totals (left) and departures from normal (right), from the Midwestern Regional Climate Center
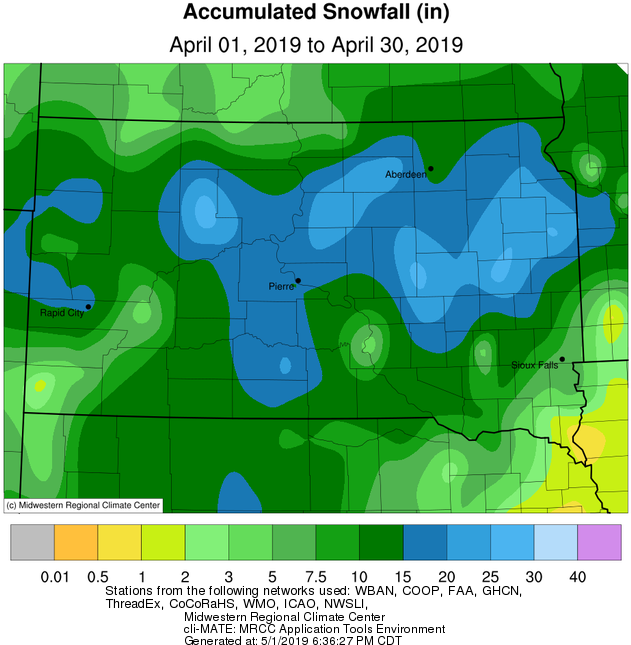
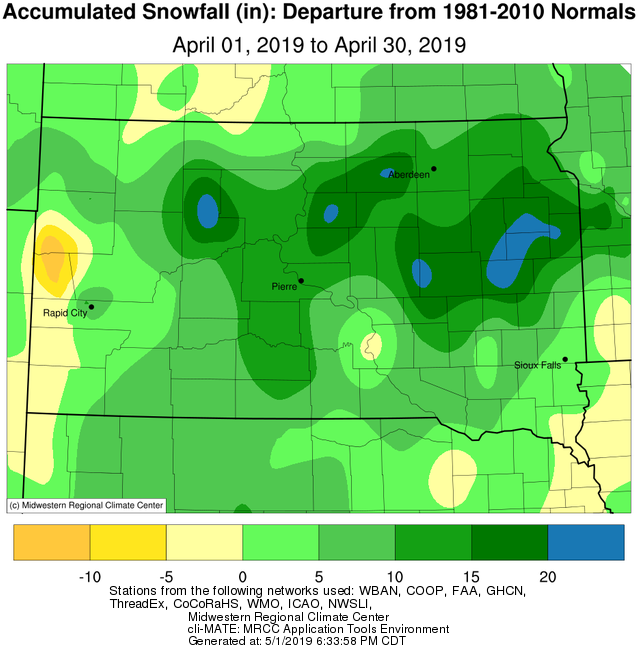
Snowfall totals (left) and departures from normal (right), from the Midwestern Regional Climate Center
From the Midwestern Regional Climate Center, "Winter seasons have significant societal impacts across all sectors ranging from direct human health and mortality to commerce, transportation, and education. The question “How severe was this winter?” does not have a simple answer. At the very least, the severity of a winter is related to the intensity and persistence of cold weather, the amount of snow, and the amount and persistence of snow on the ground. The Accumulated Winter Season Index (AWSSI) was developed to objectively quantify and describe the relative severity of the winter season."
The AWSSI places this season at Pierre, Watertown and Aberdeen in the "Extreme" category. Visit https://mrcc.illinois.edu/research/awssi/indexAwssi.jsp and click on each location to see details.
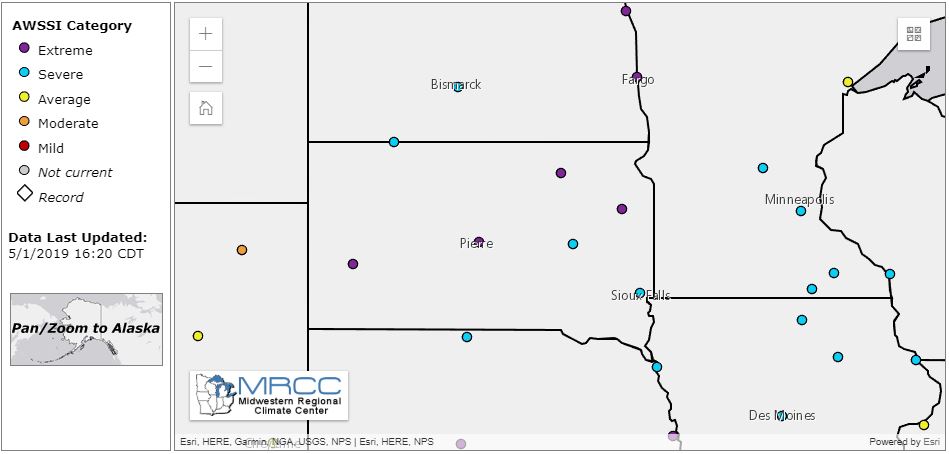
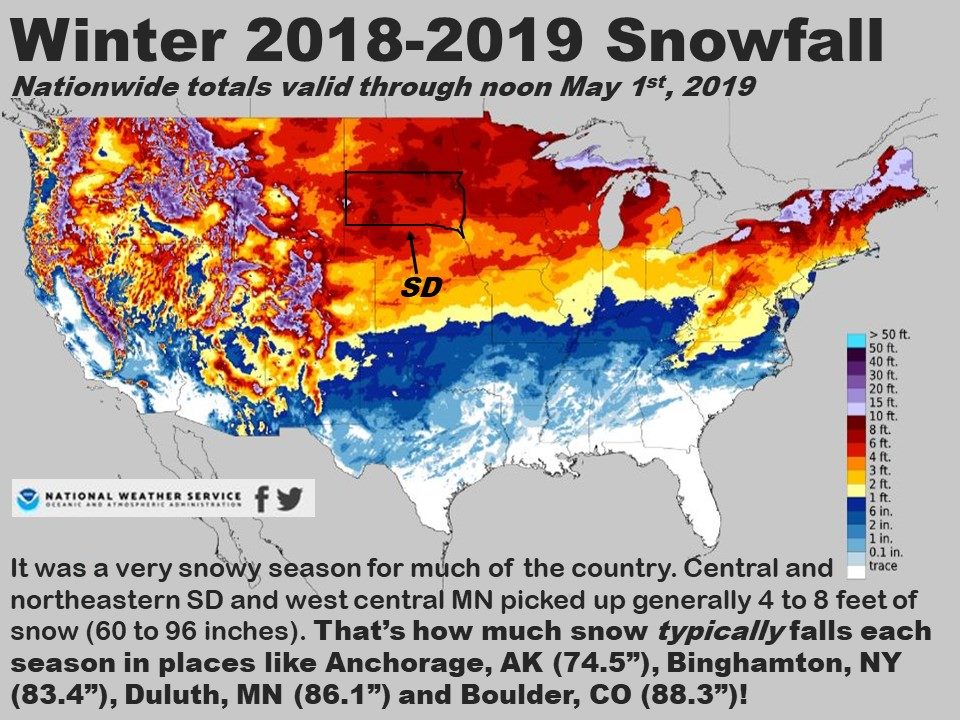
Finally, here are a couple graphics highlighting the incredible season this area had snow-wise