Climatological Spring Runoff Data
New Mexico & Southern Colorado
(updated May 9, 2024)
|
The amount of water locked up in snowpack across the western United States is an extremely important contribution to the health of annual streamflow. Data available from the NRCS SNOTEL network, along with other meteorological and hydrological variables from federal and state agencies, provide valuable information to a complex system of models that develop water supply forecasts for the spring and early summer months. Predictions of the amount and timing of peak streamflow discharge are a critical component to water resource management in the desert southwest. The lives of millions of people are dependent upon this highly valuable natural resource. Scientists often analyze the climatology of complex natural systems to better understand how the current conditions will impact the overall system. Several years with below normal spring runoff followed by a year or two with above normal flows has the potential to significantly alter the channel. The impacts of bank erosion, debris islands, and vegetation can influence how water flows through a channel and alter the risk for flooding during high flows. The hydrologic outlook for the 2024 season is included below and will be updated as needed throughout the spring runoff season.
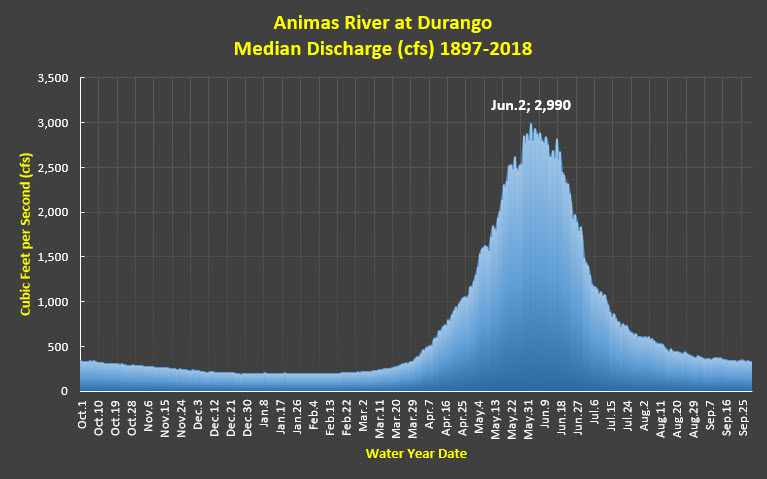
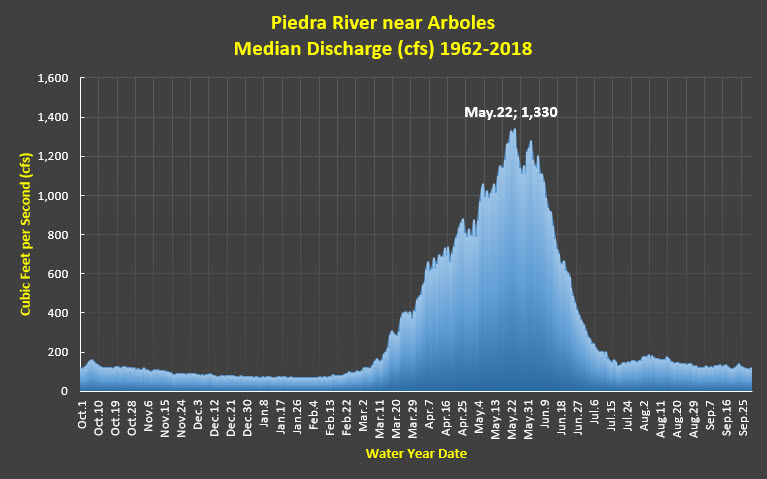
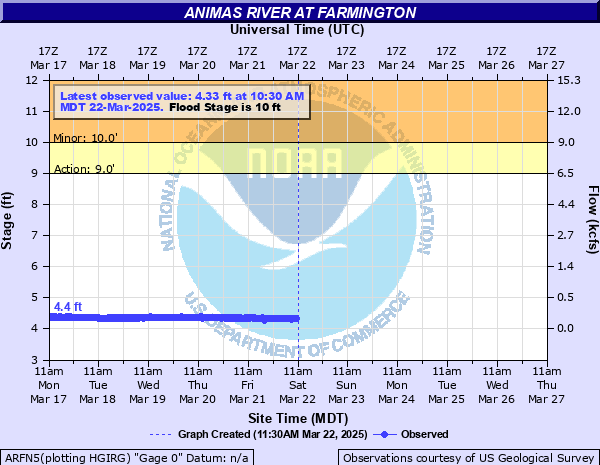
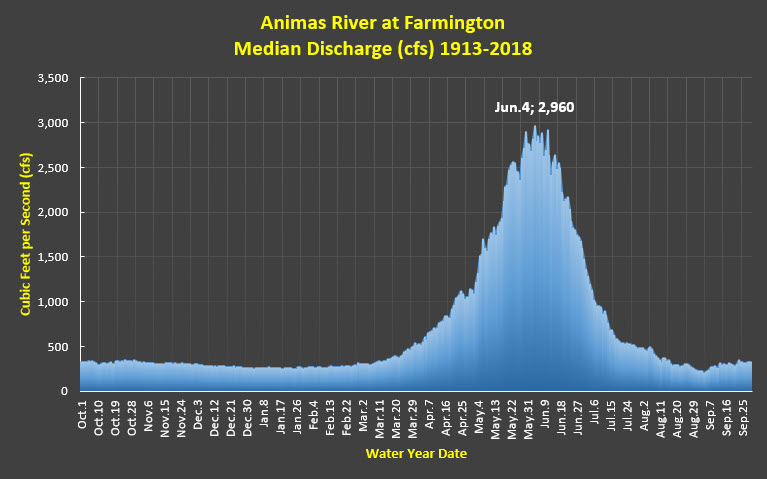
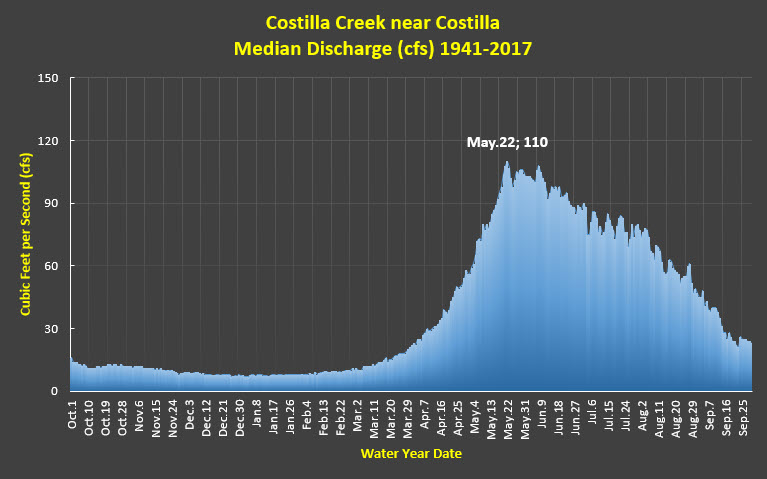
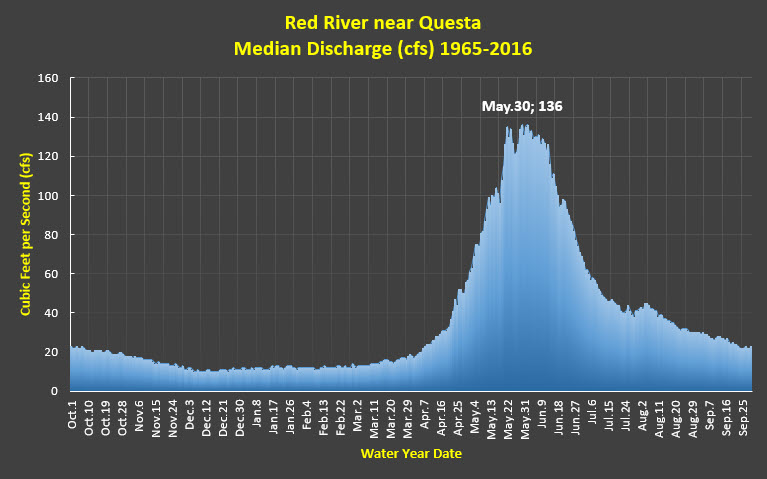
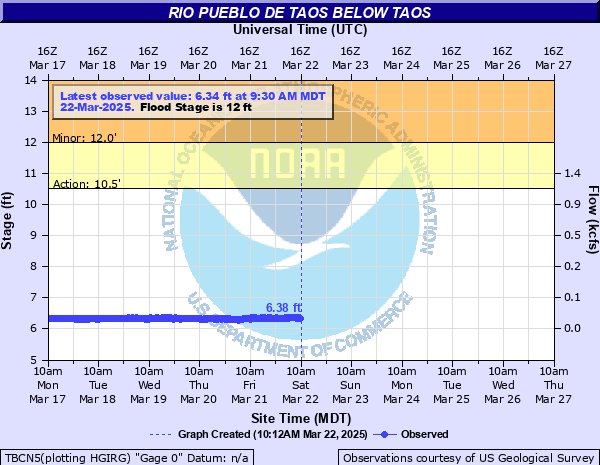
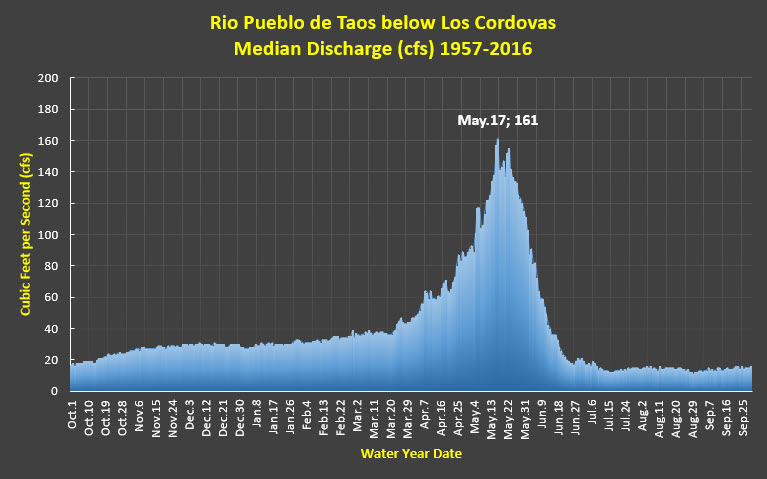
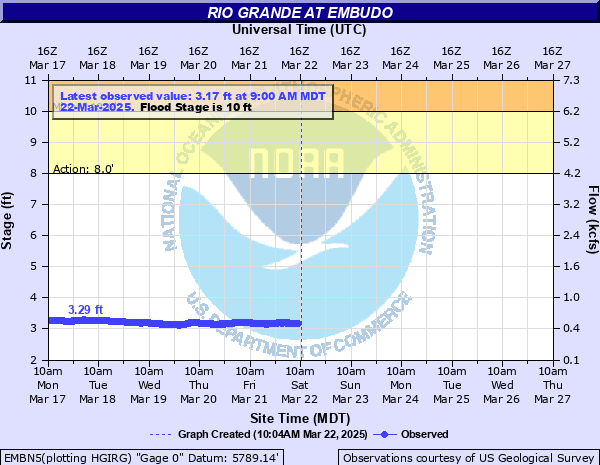
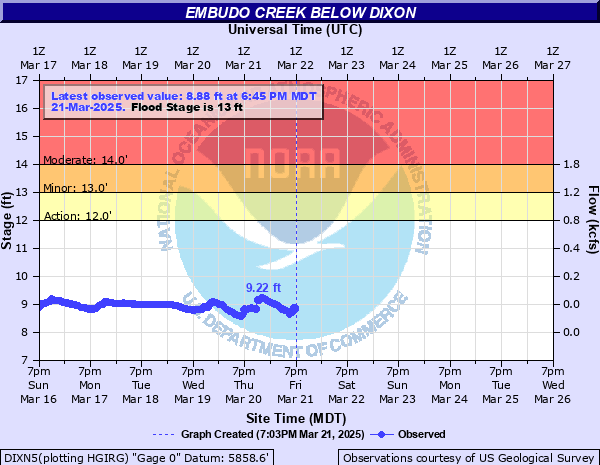
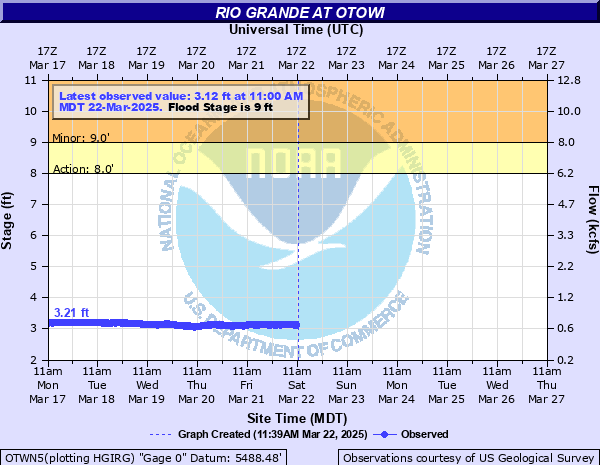
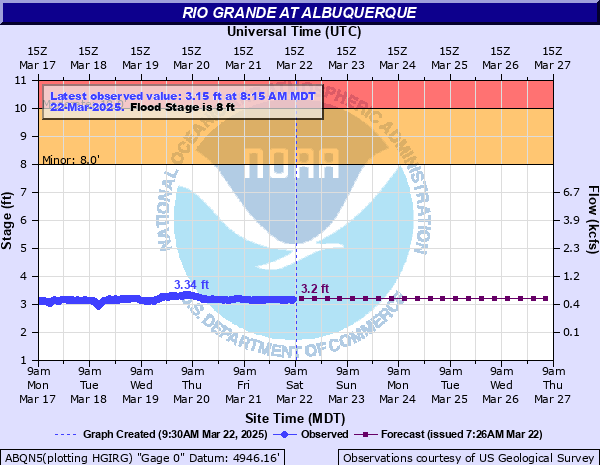
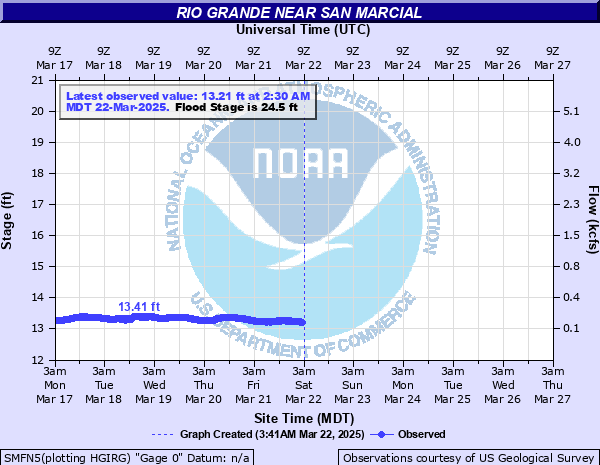
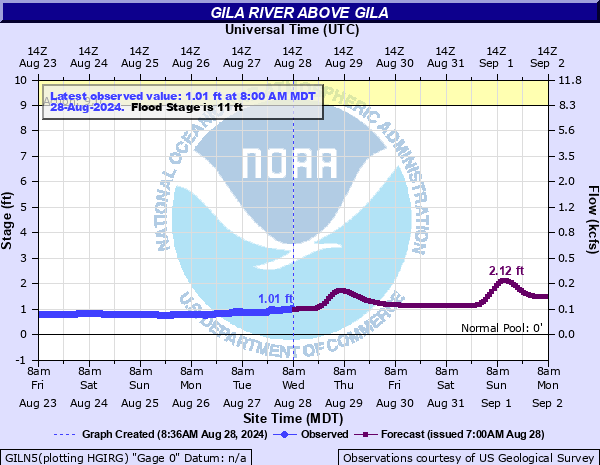
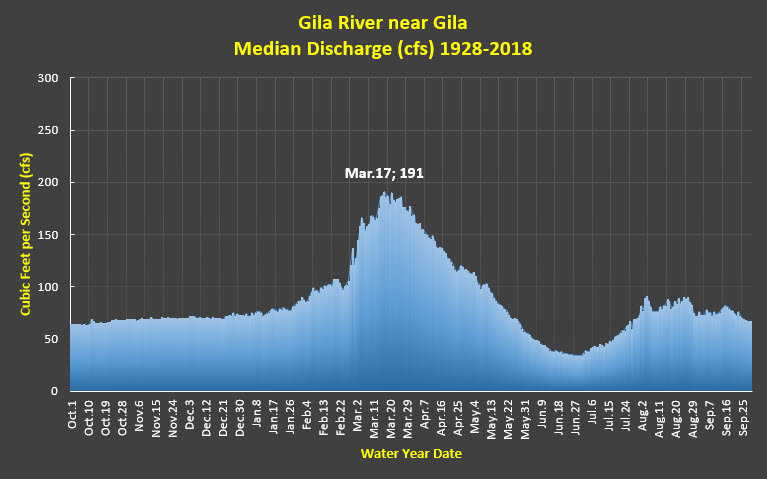
The feature below illustrates daily median discharge curves obtained from the USGS time-series of daily statistics for select river gage locations across New Mexico and southern Colorado. Current streamflow conditions for all available sites within New Mexico can be obtained by visiting the USGS National Water Dashboard. Another interactive display of current data can be obtained by visiting the NWS National Water Prediction Service (NWPS) web page. Several locations across southern Colorado were also included in this feature as there are significant contributions to New Mexico's water supply from Colorado. Daily mean discharge data for some of these sites was obtained from the Colorado Division of Water Resources.
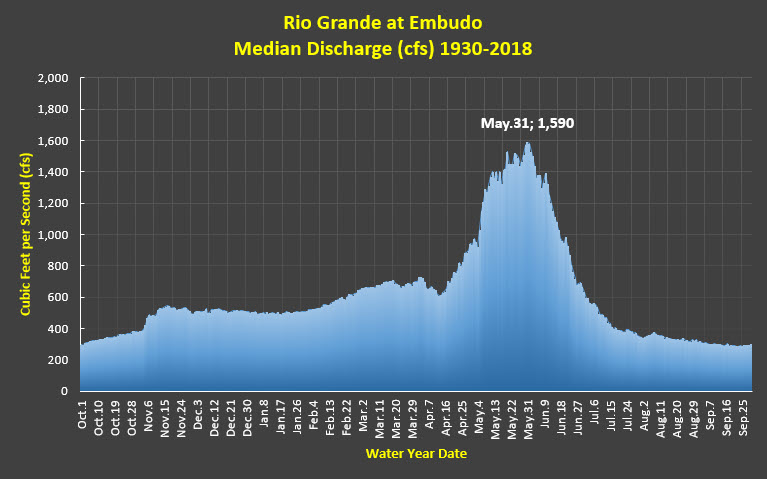
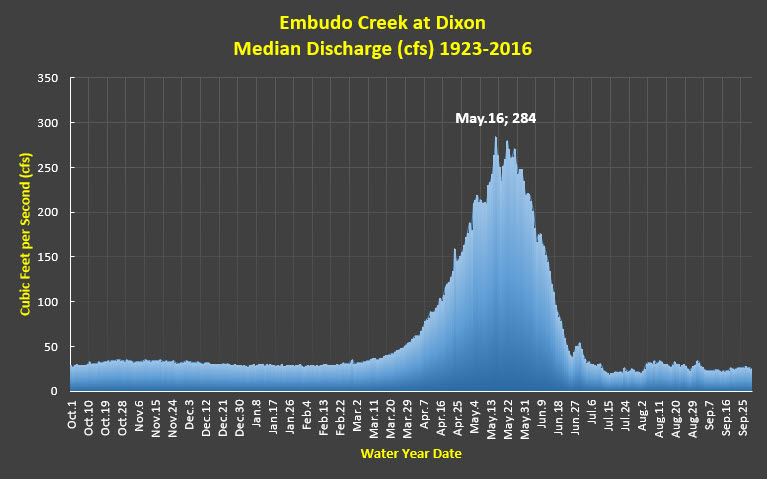
The vast majority of locations across northern New Mexico and far southern Colorado experience their peak runoff during mid to late May while areas across the south typically see peak runoff from March through April. Click on a location indicated by the yellow triangle in the map below to view long-term climatological discharge curves for select locations across New Mexico and southern Colorado. A tabular view for each location is available at the bottom of this page. The table also includes peak discharge values for select locations for the entire period of available data. The period of record for the median discharge curves may be shorter than the long-term record for some sites due to data availability.

|
2024 Snowmelt: Hydrologic Outlook
(updated May 9, 2024)
|
|
There are no longer any significant areas of concern for snowmelt runoff this spring. Flood advisories for the Rio Chama will continue to be monitored for the latest reservoir releases and associated hydrologic response. Snow pack is greatly reduced and nonexistent in some areas after a very warm, dry and sunny April resulted in an earlier than usual snowpack reduction. Hazards to area rivers and streams will likely shift to rain-driven or infrastructure (dam release or breach) flooding concerns only.
|
|
The table below details runoff statistics for select locations across New Mexico and southern Colorado, including; peak median discharge, long-term peak median date, all-time peak discharge, and all-time peak discharge date.
|
Median Runoff Statistics
(Current NWPS data and historical median data is available for sites with links)
|
Location: Hydrograph
(Period of Record) |
Peak Median
Discharge (CFS) |
Long-Term Peak Median Date |
Peak Discharge (CFS) |
Peak Discharge Date |
Animas River Durango
(1897-2023) |
2,880 |
June 7 |
25,000 |
October 5, 1911 |
Piedra River near Arboles
(1962-2023) |
1,290 |
May 23 |
8,370 |
September 6, 1970 |
Animas River Farmington
(1913-2019) |
2,960 |
June 4 |
25,000 |
June 29, 1927 |
Azotea Tunnel near Chama
(1985-2018) |
692 |
June 4 |
-- |
-- |
Rio Grande near Del Norte
(1890-2018) |
3,350 |
June 4 |
18,000 |
October 5, 1911 |
Conejos River near Mogote
(1903-2018) |
1,440 |
June 4 |
-- |
-- |
Costilla Creek near Costilla
(1941-2023) |
105 |
May 21 |
1,150 |
May 11, 1942 |
Red River near Questa
(1965-2023) |
133 |
May 22 |
886 |
May 25, 1942 |
Rio Pueblo de Taos
Los Cordovas
(1957-2023) |
152 |
May 23 |
2,380 |
August 24, 1957 |
Rio Grande at Embudo
(1930-2022) |
1,540 |
May 30 |
16,200 |
June 19, 1903 |
Embudo Creek near Dixon
(1923-2023) |
280 |
May 16 |
4,200 |
August 29, 1977 |
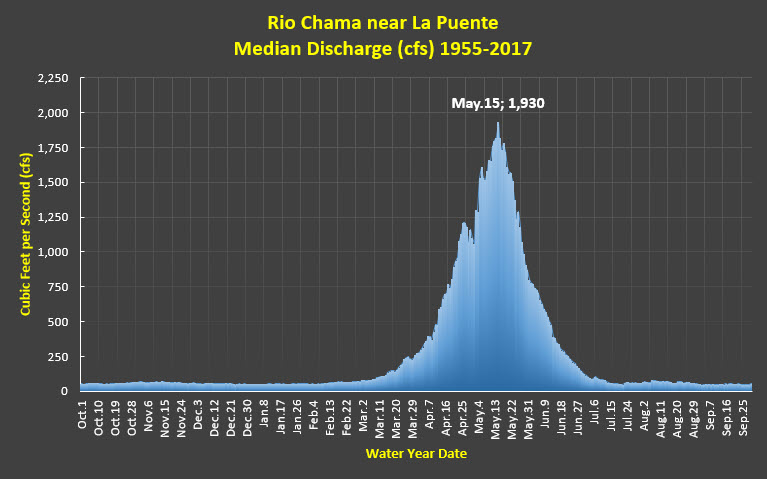
Rio Chama at La Puente
(1955-2021) |
1,920 |
May 15 |
11,200 |
May 28, 1979 |
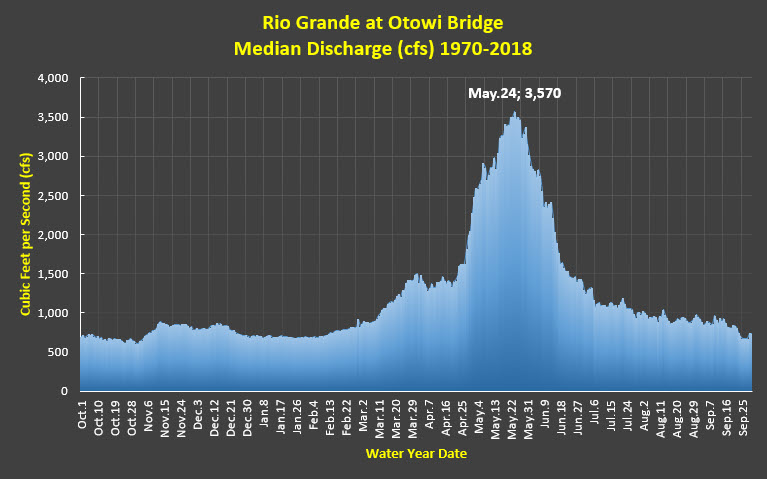
Rio Grande at
Otowi Bridge
(1970-2023) |
3,510 |
May 24 |
24,400 |
May 23, 1920 |
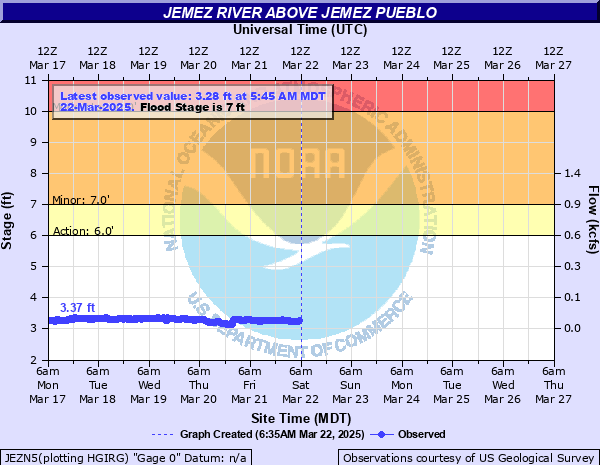
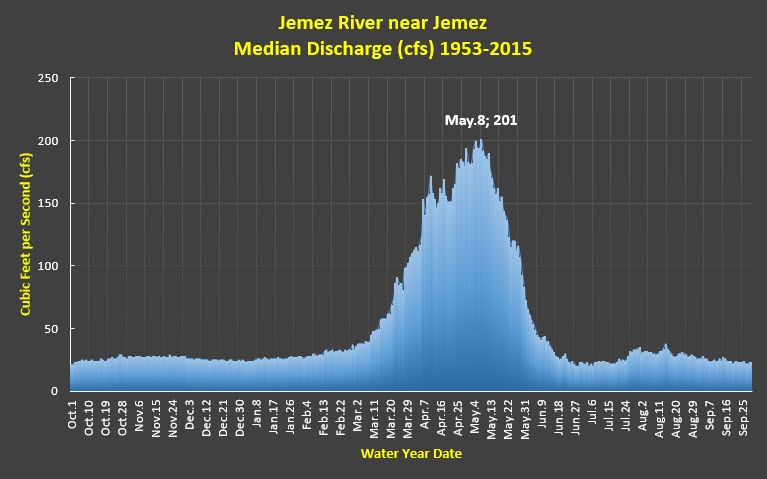
Jemez River near
Jemez
(1953-2020) |
198 |
May 8 |
4,540 |
July 15, 1985 |
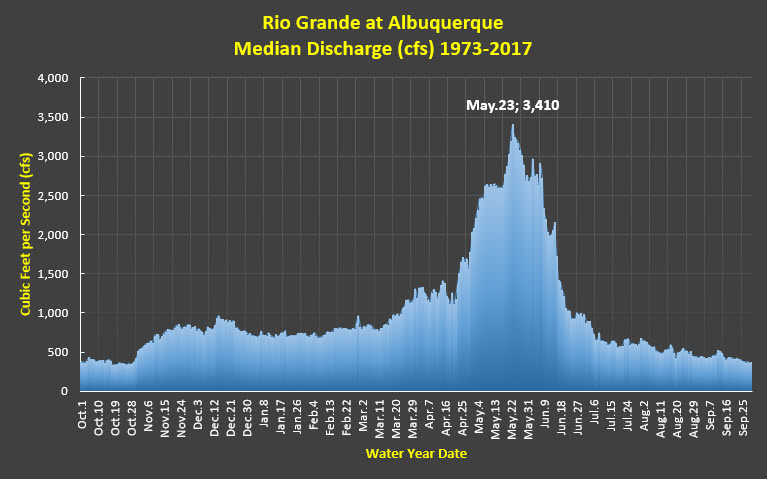
Rio Grande at ABQ
(1973-2023) |
3,260 |
May 23 |
25,000 |
April 24, 1942 |
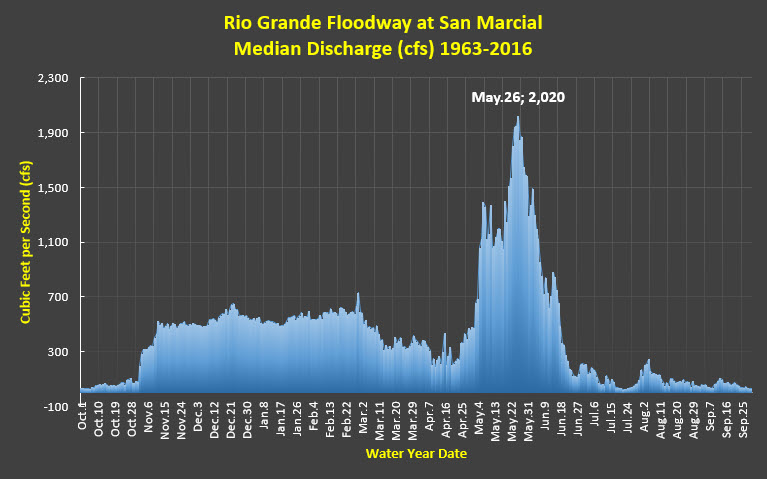
Rio Grande San
Marcial
(1963-2022) |
1,890 |
May 25 |
8,110 |
May 11, 1985 |
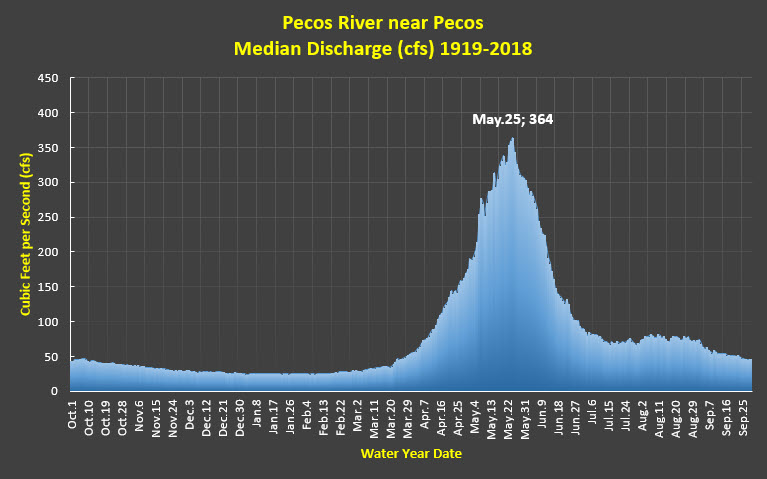
Pecos River near Pecos
(1919-2023) |
358 |
May 25 |
4,500 |
September 21, 1929 |
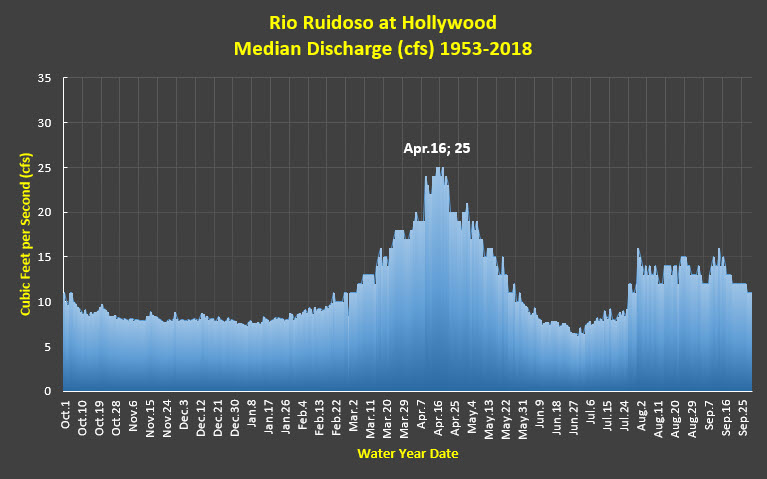
Rio Ruidoso at Hollywood
(1953-2023) |
25 |
Apr 17 |
3,400 |
July 27, 2008 |
Gila River near Gila
(1927-2023) |
203 |
Mar 15 |
35,200 |
December 28, 1984 |
| |
Spring Snowmelt Considerations & Hazards
|
|
Snowmelt flooding occurs when the major source of water involved in a flood is caused by melting snow. The northern tier states and mountainous areas of the U.S. are particularly susceptible to snowmelt flooding. Unlike rainfall that can reach the soil almost immediately, the snowpack can store the water for an extended amount of time until temperatures rise above freezing and the snow melts. This frozen storage delays the arrival of water to the soil for days, weeks, or even months. Once it begins to melt and does reach the soil, water from snowmelt behaves much as it would if it had come from rain instead of snow by either infiltrating into the soil, running off, or both. Flooding can occur when there is more water than the soil can absorb or can be contained in storage capacities in the soil, rivers, lakes and reservoirs.
High soil moisture conditions prior to snowmelt can contribute to snowmelt flooding. Rainfall during the late fall is particularly important because there is less evapotranspiration and less time for the soil to drain and dry before it freezes. Ground frost or frozen soil is another contributor. Deep, hard ground frost prevents snowmelt from infiltrating into the soil. Cold temperatures prior to heavy snowfall and normal or above normal soil moisture contribute to this.
Deep snow cover can worsen snowmelt flooding since there is more water stored and available for snowmelt. Also, when snow cover is widespread, it usually keeps air temperatures cooler and delays spring warming, which increases the potential for more rapid snowmelt. Rain falling while snow is still on the ground contributes more water for flooding and helps to melt the snowpack, thus rain-on-snow events are watched carefully.
Most often, snowmelt is a relatively slow phenomenon. Snowmelt rates are usually comparable to light or moderate rainfall. Important exceptions to this can occur, especially during unusually warm periods with high dew point temperatures, and when nighttime temperatures remain above freezing. Snowmelt rates can be much higher than normal under these conditions, which can increase the risk of snowmelt flooding. (NWS Flood-Related Hazards)
Other river flood hazards include:
- Bank erosion and bank instability
- Channel re-routing around debris/sediment islands
- Levee breaks
- Lowland inundation
- Cold water
|
|

