National Weather Service United States Department of Commerce


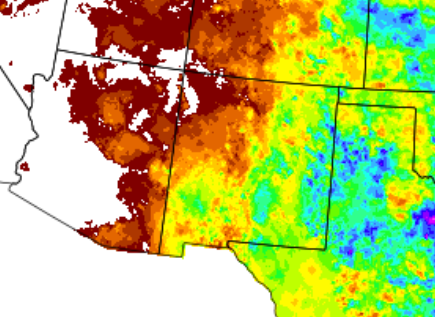
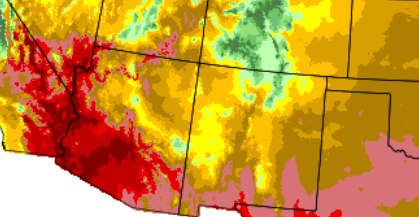
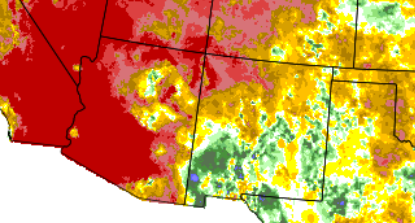
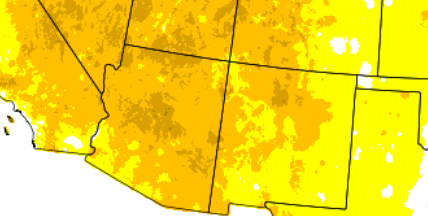
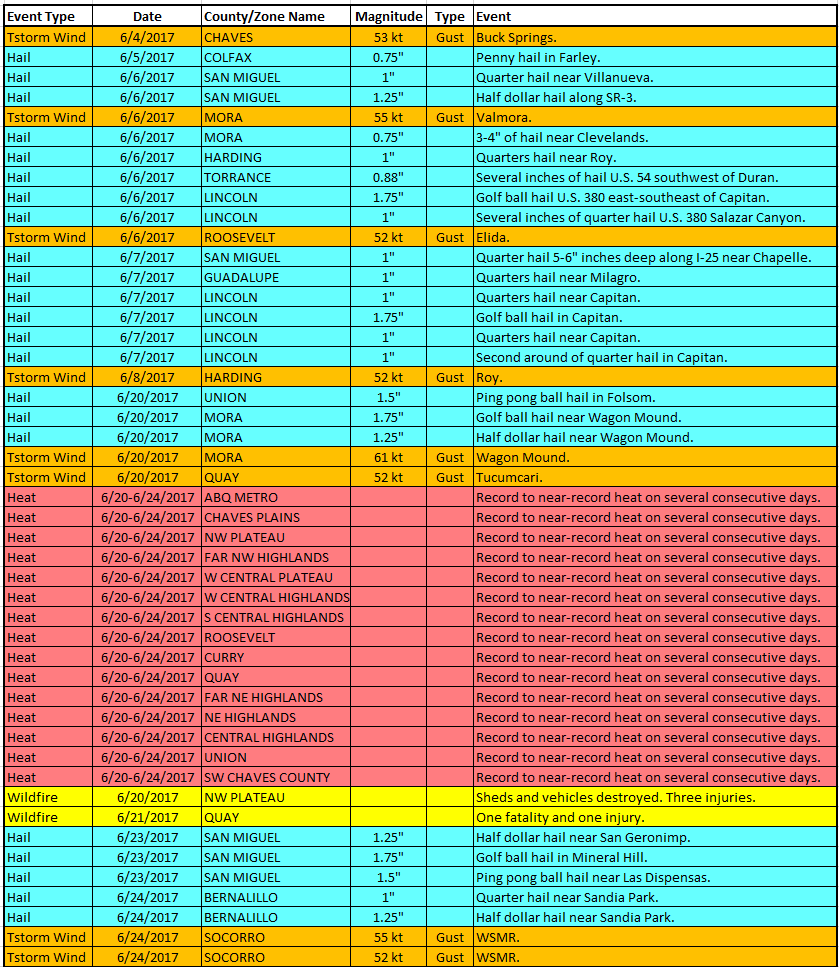
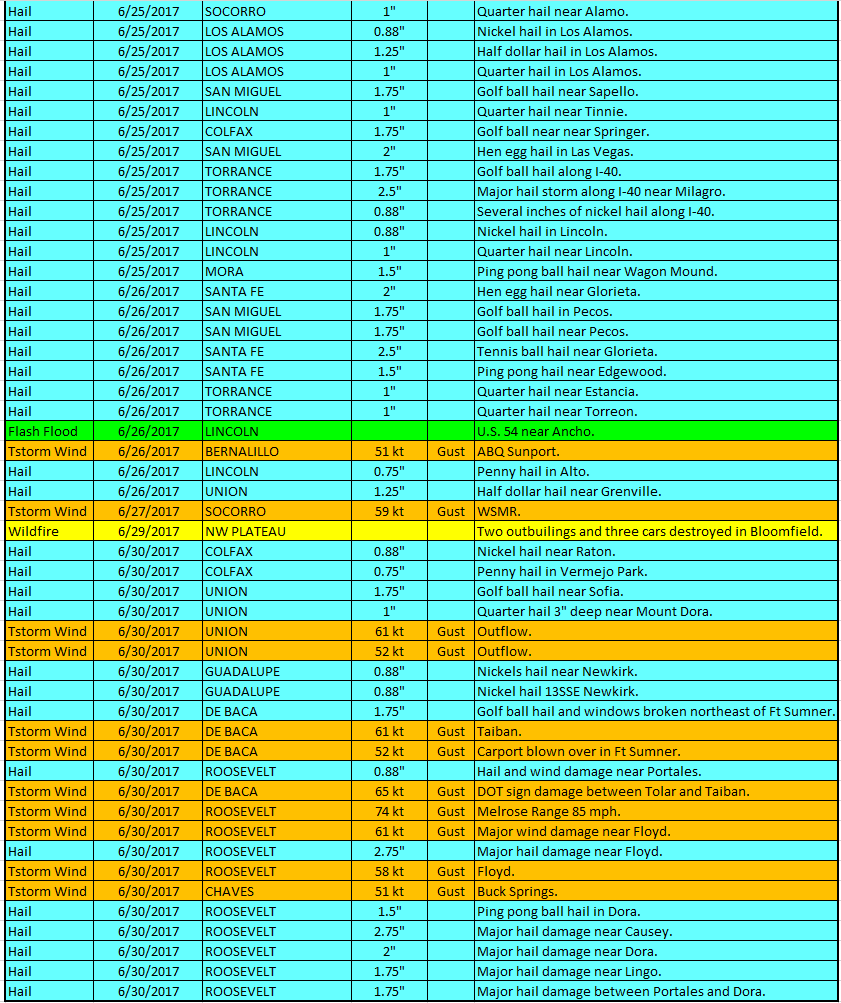
June 2017 was warmer than normal statewide, while precipitation was mostly below normal. The exceptions were in much of the southwest, small areas of east central NM and the far eastern plains.

The first three weeks of the month were mostly dry and hot. There were a couple of episodes of severe weather weather, most notably on the 6th and 7th. Isolated large hail and high winds were noted on the 20th through 23rd. A more active period of convection followed on the 24th through 26th and again on the 30th with numerous reports of severe weather.

Statewide Precipitation and Temperatures

Statewide Precipitation - Actual

Statewide Temperatures - Actual


Statewide Precipitation - Percent Of Normal Statewide Temperatures - Departure From Normal


                                      Climate Cities Temperatures and Precipitation

Albuquerque
 

There was 0.48 inches of precipitation measured at the Sunport in June 2017, compared to the normal of 0.66 inches, or 0.18 inches below normal.

The average temperature for Albuquerque in June 2017 was 78.5°, which was 3.6 degrees above the normal of 74.9°.

The average maximum temperature for the month was 93.2°. This was 4.9 degrees above the normal average maximum temperature of 88.3°.

The average minimum temperature for the month was 63.8°. This was 2.2 degrees above the normal average minimum temperature of 61.6 degrees.

 
 Clayton
 

There was 0.69 inches of precipitation measured at Clayton in June 2017, or 1.44 inches below the average of 2.13 inches.

The average temperature for Clayton in June 2017 was 71.4°, which was 1.0 degree above the normal of 70.4°.

The average maximum temperature for the month was 87.3°. This was 2.7 degrees above the normal average maximum temperature of 84.6 degrees.

The average minimum temperature for the month was 55.4°. This was 0.7 degrees below the normal average minimum temperature of 56.1°.

 
 Roswell
 

There was 0.56 inches of precipitation reported at Roswell during June 2017, which is 1.17 inches below the normal of 1.73 inches.

The average temperature in Roswell for June 2017 was 81.6°, which was 3.4 degrees above the normal of 78.2 degrees.

The average maximum temperature for the month was 98.5°. This was 5.3 degrees above the average maximum temperature of 93.2 degrees.

The average minimum temperature for the month was 64.7°. This was 1.5 degrees above the normal average minimum temperature of 63.2°.


Severe Weather

Storm reports are considered preliminary until a final review is certified in the NWS Storm Data publication.
Certified data is available three to four months post-event at: https://www.ncdc.noaa.gov/stormevents/