National Weather Service United States Department of Commerce


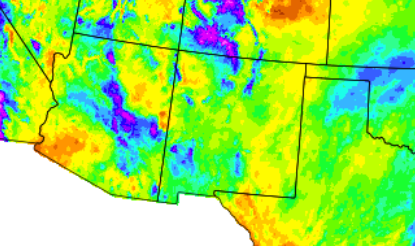
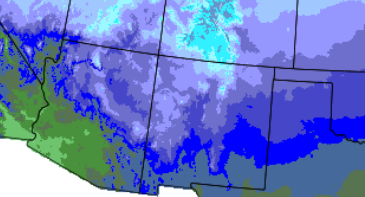
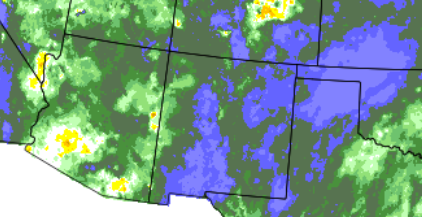
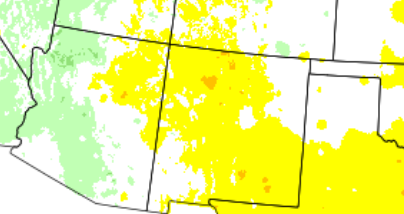
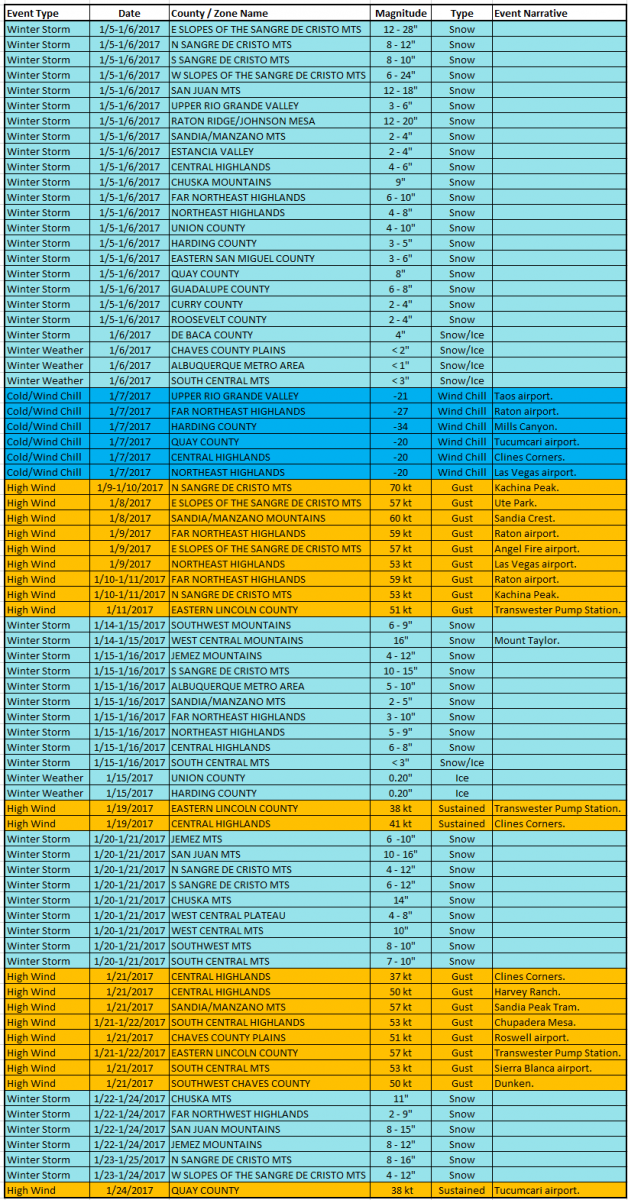
January 2017 was an active month with four storms bringing low elevation rain and higher elevation snow. A weak system on the first delivered mostly light amounts of snow to the northern mountains. The next storm on the 4th through 6th produced widespread rain and snow, including 1 to 2 feet of snow on the northern mountains. The third storm on the 14th through 15th blanketed mountain locations with around 1 foot of snow, and 2 feet reported near Magdalena. The fourth and final storm of the month was from the 22nd through 24th. It again delivered heavy snow to the northern mountains, on the order of 1 to 2 feet. Widespread rain and lighter snow fell elsewhere. January 2017 will likely end up as one of the wetter January's on record. Portions of central and eastern New Mexico ended up with 300 percent of normal or higher. The last week of the month finally produced an extended period of dry weather. Cold temperatures on the 25th through 27th gave way to milder, above normal highs and lows through the last few days of the month. A large swath from northwest to southeast New Mexico experienced above normal temperatures, while the northeast and southwest had near normal temperatures.

Statewide Precipitation and Temperatures

Statewide Precipitation - Actual

Statewide Temperatures - Actual


Statewide Precipitation - Percent Of Normal Statewide Temperatures - Departure From Normal


                                      Climate Cities Temperatures and Precipitation

Albuquerque
 

There was 1.04 inches of precipitation measured at the Sunport in January 2017, compared to the normal of 0.50 inches, or 0.54 inches above normal. This was the 9th wettest January on record.

There was 1.1 inches of snow compared to the normal of 2.1 inches.

The average temperature for Albuquerque in January 2017 was 39.2°, which was 2.9 degrees above the normal of 36.3°.

The average maximum temperature for the month was 48.9°. This was 2.8 degrees above the normal average maximum temperature of 46.1°.

The average minimum temperature for the month was 29.4°. This was 2.9 degrees above the normal average minimum temperature of 26.5 degrees.

 
 Clayton
 

There was 1.13 inches of precipitation measured at Clayton in January 2017, or 0.77 inches above the average of 0.36 inches. This was the 4th wettest January on record.

There was 7.8 inches of snow, compared to the normal of 5.1 inches. This was the 11th snowiest January on record.

The average temperature for Clayton in Janaury 2017 was 35.6°, which was 0.8 degrees above the normal of 34.8°.

The average maximum temperature for the month was 48.9°. This was 1.2 degrees above the normal average maximum temperature of 47.7 degrees.

The average minimum temperature for the month was 22.3°. This was 0.4 degrees below the normal average minimum temperature of 21.9°.

 
 Roswell
 

There was 1.09 inches of precipitation reported at Roswell during January 2017, which is 0.45 inches below the normal of 0.64 inches. This was the 10th wettest January on record.

There was 2.5 inches of snow in Roswell compared to the normal of 3.2 inches.

The average temperature in Roswell for January 2017 was 43.9°, which was 3.5 degrees above the normal of 40.4 degrees. 

The average maximum temperature for the month was 59.1°. This was 4.5 degrees above the average maximum temperature of 54.6 degrees.

The average minimum temperature for the month was 28.7°. This was 2.6 degrees below the normal average minimum temperature of 26.1°

Severe Weather
Storm reports are considered preliminary until a final review is certified in the NWS Storm Data publication.
Certified data is available three to four months post-event at: https://www.ncdc.noaa.gov/stormevents/