National Weather Service United States Department of Commerce


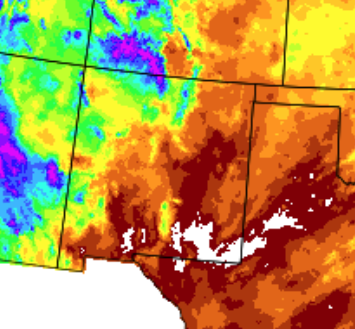
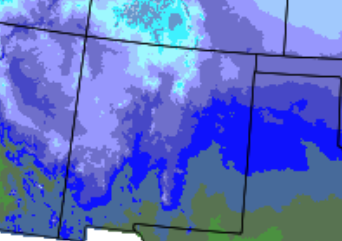
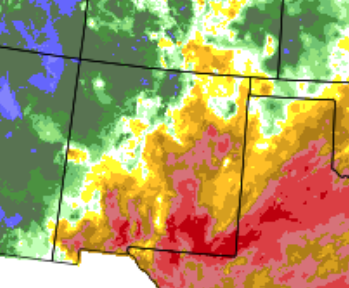
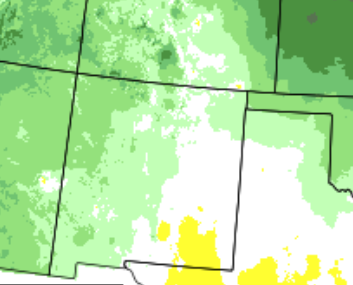
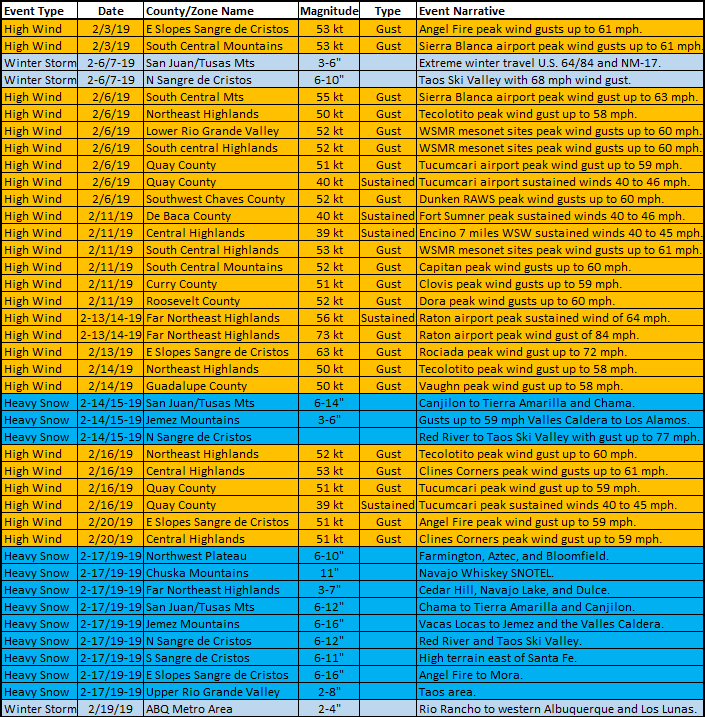
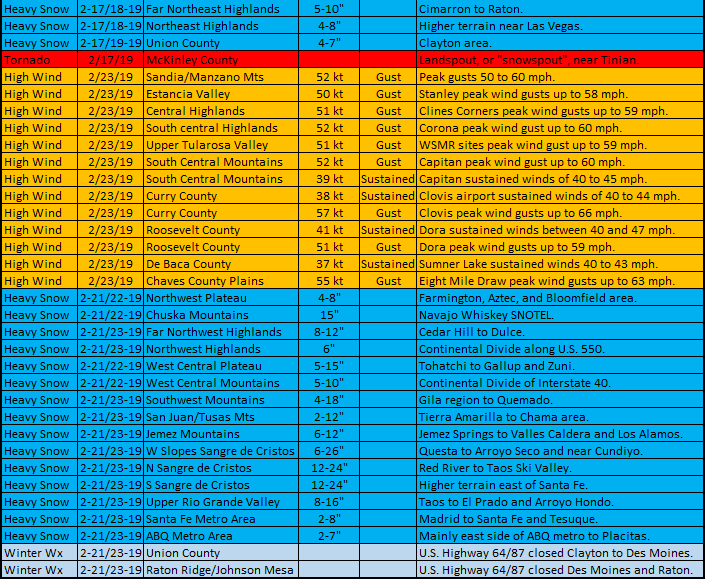
February 2019 was wetter than normal in the northwest and drier than normal in the southeast. Temperatures were well below normal in the west, below normal central areas, and near normal in the east. 

The first half of the month was pretty quiet with strong to high winds the main weather story on the 3rd, 6th and 11th. A light to moderate snow event was recorded on the 6th. Heavy snow blanketed the Chama area on the 13th. Potent storm systems brought widespread, decent snow to many areas on the 18th through 19th, and again on the 22nd through 23rd. The remainder of the month was pretty quiet. 

Statewide Precipitation and Temperatures

Statewide Precipitation - Actual

Statewide Temperatures - Actual


Statewide Precipitation - Percent Of Normal Statewide Temperatures - Departure From Normal


                                      Climate Cities Temperatures and Precipitation

Albuquerque
 

There was 0.50 inches of precipitation measured at the Sunport in February 2019, compared to the normal of 0.48 inches, or 0.02 inches above normal.

There was 4.2 inches of snow, doubling the normal of 2.1 inches.

The average temperature for Albuquerque in February 2019 was 39.9°, which was 1.5 degrees below the normal of 41.4°.

The average maximum temperature for the month was 51.5°. This was 1.0 degree below the normal average maximum temperature of 52.5°.

The average minimum temperature for the month was 28.3°. This was 2.0 degrees below the normal average minimum temperature of 30.3 degrees.

Records: 5th - record high daily minimum temperature of 41 degrees; 22nd - record daily snowfall 3.6" and record precipitation of 0.34 inches.

 
 Clayton
 

There was 0.37 inches of precipitation measured at Clayton in February 2019, or 0.03 inches above the average of 0.34 inches.

There was 3.6 inches of snow, compared to the normal of 3.9 inches.

The average temperature for Clayton in February 2019 was 35.3°, which was 2.2 degrees below the normal of 37.5°.

The average maximum temperature for the month was 51.1°. This was 0.2 degrees below the normal average maximum temperature of 51.3 degrees.

The average minimum temperature for the month was 19.4°. This was 4.2 degrees below the normal average minimum temperature of 23.6°.

Records: none

 
 Roswell
 

There was only a trace of precipitation reported at Roswell during February 2019, while normal is 0.42 inches.

There a trace of snow in Roswell, compared to the normal of 2.1 inches.

The average temperature in Roswell for February 2019 was 47.9°, which was 2.2 degrees above the normal of 45.7 degrees. 

The average maximum temperature for the month was 65.2°. This was 4.5 degrees above the average maximum temperature of 60.7 degrees.

The average minimum temperature for the month was 30.6°. This was 0.1 degrees below the normal average minimum temperature of 30.7°

Records: none

Severe Weather
Storm reports are considered preliminary until a final review is certified in the NWS Storm Data publication.
Certified data is available three to four months post-event at: https://www.ncdc.noaa.gov/stormevents/