National Weather Service United States Department of Commerce


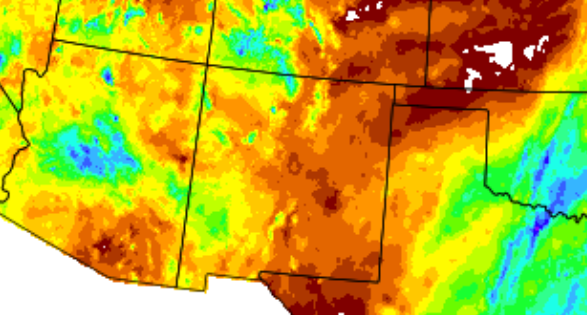
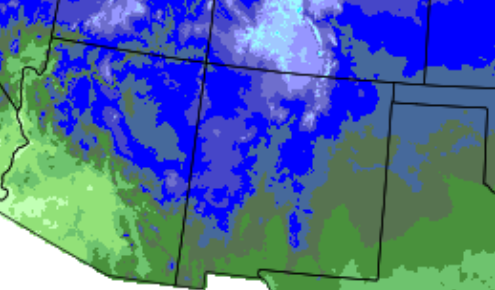
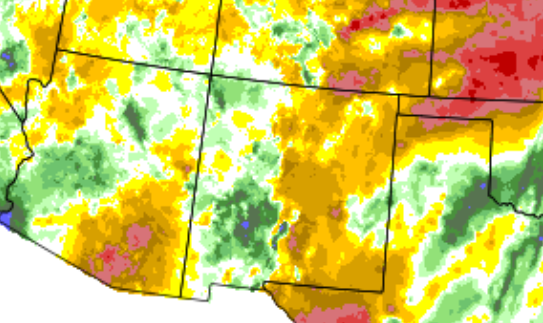
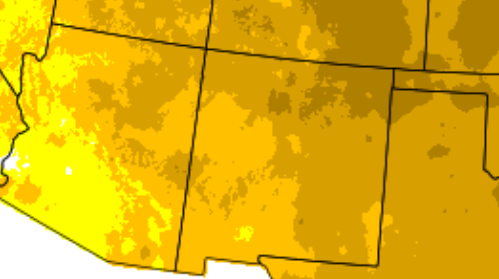
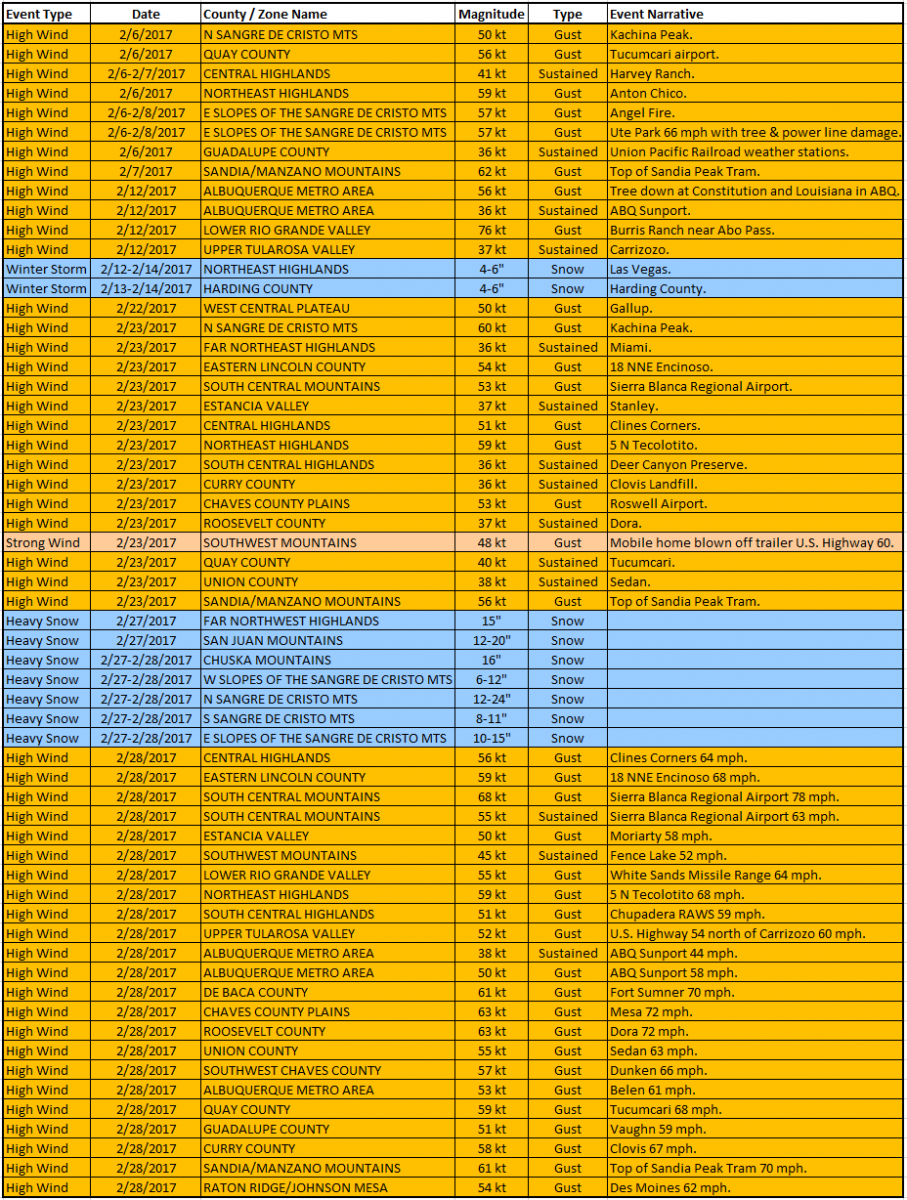
February 2017 was well above normal over most of New Mexico, while precipitation was near to below normal.

The first five days of February were quiet with chilly temperatures giving way to milder, above normal highs. Strong winds buffeted the state on the 6th and 8th. Record warmth graced portions of the state from the 9th through 11th. The first storm of the month blasted the state from the 12th through 14th with snow, rain and strong winds. The next storm on the 18th through the 19th was more tame with moderate snowfall in the western and northern mountains. High winds struck again on the 23rd and 28th with light rain at low elevations and moderate snow accumulations in the mountains.

Statewide Precipitation and Temperatures

Statewide Precipitation - Actual

Statewide Temperatures - Actual


Statewide Precipitation - Percent Of Normal Statewide Temperatures - Departure From Normal


                                      Climate Cities Temperatures and Precipitation

Albuquerque
 

There was 0.35 inches of precipitation measured at the Sunport in February 2017, compared to the normal of 0.48 inches, or 0.13 inches below normal.

There was 1.6 inches of snow compared to the normal of 2.1 inches.

The average temperature for Albuquerque in February 2017 was 46.3°, which was 4.9 degrees above the normal of 41.4°. This was the 6th warmest February on record.

The average maximum temperature for the month was 58.4°. This was 5.9 degrees above the normal average maximum temperature of 52.5°.

The average minimum temperature for the month was 34.1°. This was 3.8 degrees above the normal average minimum temperature of 30.3 degrees.

 
 Clayton
 

There was 0.25 inches of precipitation measured at Clayton in February 2017, or 0.09 inches below the average of 0.34 inches.

There was 1.0 inch of snow, compared to the normal of 3.9 inches.

The average temperature for Clayton in February 2017 was 45.6°, which was 8.1 degrees above the normal of 37.5°! The was the warmest February on record for Clayton.

The average maximum temperature for the month was 61.5°. This was 10.2 degrees above the normal average maximum temperature of 51.3 degrees.

The average minimum temperature for the month was 29.6°. This was 6.0 degrees above the normal average minimum temperature of 23.6°.

 
 Roswell
 

There was 0.16 inches of precipitation reported at Roswell during February 2017, which is 0.26 inches below the normal of 0.42 inches.

There was only a Trace of  snow in Roswell, compared to the normal of 2.1 inches.

The average temperature in Roswell for February 2017 was 51.1°, which was 5.4 degrees above the normal of 45.7 degrees. 

The average maximum temperature for the month was 69.8°. This was 9.1 degrees above the average maximum temperature of 60.7 degrees.

The average minimum temperature for the month was 32.5°. This was 1.8 degrees above the normal average minimum temperature of 30.7°

Severe Weather
Storm reports are considered preliminary until a final review is certified in the NWS Storm Data publication.
Certified data is available three to four months post-event at: https://www.ncdc.noaa.gov/stormevents/