National Weather Service United States Department of Commerce


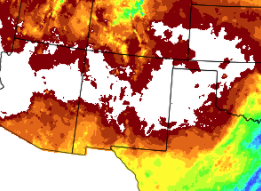
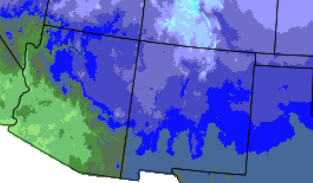
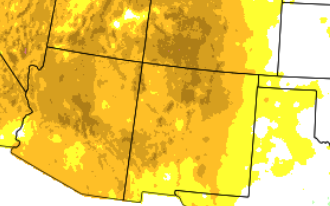
December 2017 was much warmer and drier than normal!

The first 3 days of December continued unseasonably mild and dry. Colder air finally arrived on the 4th, with the 5th through 7th quite chilly; below to well below normal. This was quite a shock from the long duration of mild weather previously. And speaking of mild air, it returned starting on the 6th, and was in full force from the 7th through 13th, only backing off some on the 14th through 19th. It was dry during this time, aside from light snow in our southern mountains on the 16th to 17th. The remainder of the month was incredibly dry and unusually mild. Some arctic air did make it into the eastern plains on the 26th and 31st. 


Statewide Precipitation and Temperatures

Statewide Precipitation - Actual

Statewide Temperatures - Actual


Statewide Precipitation - Percent Of Normal Statewide Temperatures - Departure From Normal


   Climate Cities Temperatures and Precipitation

Albuquerque
 

There was only a trace of precipitation (both rain and snow) measured at the Sunport in December 2017, compared to the normal of 0.50 inches, or 0.50 inches below normal.

The average temperature for Albuquerque in December 2017 was 40.4°, which was 4.1 degrees above the normal of 36.3°.

The average maximum temperature for the month was 53.1°. This was 7.0 degrees above the normal average maximum temperature of 46.1°.

The average minimum temperature for the month was 27.8°. This was 1.3 degrees above the normal average minimum temperature of 26.5 degrees.

Records: The number of consecutive days without measurable precipitation reached 87 days at the end of December 31st, the 6th longest stretch on record.

 
 Clayton
 

There was only a trace of precipitation (both rain and snow) measured at Clayton in December 2017, or 0.36 inches below the average of 0.36 inches.

The average temperature for Clayton in December 2017 was 36,4°, which was 1.6 above the normal of 34.8°.

The average maximum temperature for the month was 51.6°. This was 3.9 degrees above the normal average maximum temperature of 47.7 degrees.

The average minimum temperature for the month was 21.3°. This was 0.6 degrees below the normal average minimum temperature of 21.9°.

Records: none

 
 Roswell
 

There was only a trace of precipitation (rain) reported at Roswell during December of 2017, which is 0.64 inches below the normal of 0.64 inches. There was no snow reported in December. 

The average temperature in Roswell for December 2017 was 42.8°, which is 2.4 degrees above the normal of 40.4 degrees. 

The average maximum temperature for the month was 59.4°. This was 4.8 degrees above the average maximum temperature of 54.6 degrees.

The average minimum temperature for the month was 26.3°. This was 0.2 degrees above the normal average minimum temperature of 26.1°

Records: The number of consecutive days without measurable precipitation reached 77 days at the end of December 31st, the 14th longest stretch on record

Severe Weather
Storm reports are considered preliminary until a final review is certified in the NWS Storm Data publication.
Certified data is available three to four months post-event at: https://www.ncdc.noaa.gov/stormevents/