National Weather Service United States Department of Commerce


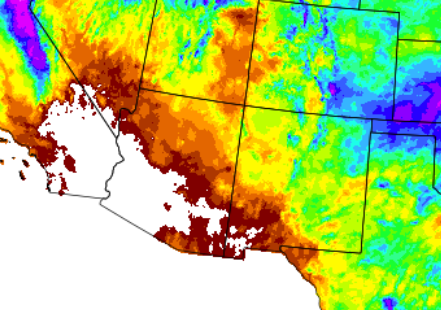
April 2017 was mostly wetter and warmer than normal.

The month started with a bang as two storm systems brought mountain snow, lowland rain and strong winds through the first 5 days of the month. Strong winds buffeted the central and eastern areas of the state on the 9th. The first severe weather of the season struck on the 12th across Chaves County, including a confirmed weak tornado. Widespread beneficial rain fell over the eastern plains. It was pretty quiet from the 13th through 19th. Windy and cooler weather returned on the 20th into 22nd with only a little precipitation, although large hail was reported in the late evening of the 20th around Capulin. A warming trend started on the 22nd and continued through the 24th before a gradual cooling trend began on the 25th and continued for several days, along with increasing coverage of showers. An impressive spring storm on the 27th into early on the 29th produced widespread mountain snow, snow and blowing snow over the northeast, rain and isolated thunderstorms elsewhere. Strong winds produced extensive blowing snow in the northeast with white-out conditions.

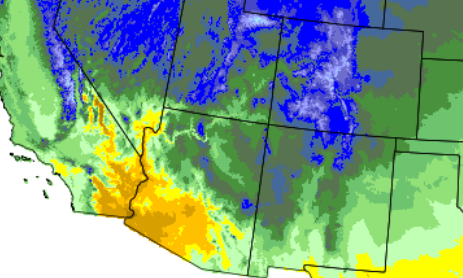
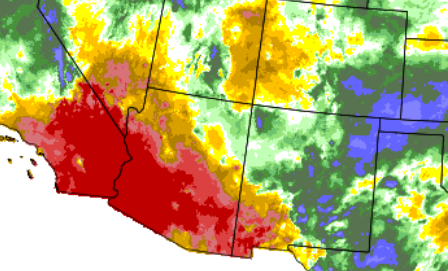
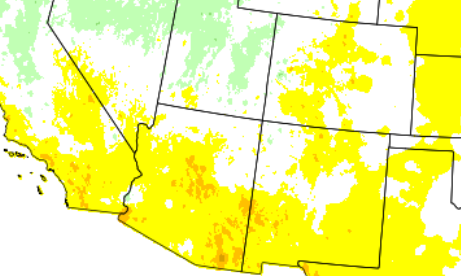
Statewide Precipitation and Temperatures

Statewide Precipitation - Actual

Statewide Temperatures - Actual


Statewide Precipitation - Percent Of Normal Statewide Temperatures - Departure From Normal


                                      Climate Cities Temperatures and Precipitation

Albuquerque
 

There was 0.78 inches of precipitation measured at the Sunport in April 2017, compared to the normal of 0.61 inches, or 0.17 inches above normal.

There was 0,7 inches of snow compared to the normal of 0.2 inches.

The average temperature for Albuquerque in April 2017 was 57.0°, which was 4.8 degrees above the normal of 52.2°.

The average maximum temperature for the month was 70.5°. This was 5.3 degrees above the normal average maximum temperature of 65.2°.

The average minimum temperature for the month was 43.5°. This was 4.3 degrees above the normal average minimum temperature of 39.2 degrees.

 
 Clayton
 

There was 3.33 inches of precipitation measured at Clayton in April 2017, or 2.39 inches above the average of 0.94 inches. This was the 10th wettest April on record.

There was an impressive 13.8 inches of snow, compared to the normal of 1.5 inches. This was the 2nd snowiest April on record! Only 1909 was higher, with 15.5 inches.

The average temperature for Clayton in April 2017 was 53.2°, which was 0.8 degrees above the normal of 52.4°.

The average maximum temperature for the month was 67.0°. This was exactly the normal average maximum temperature of 67.0 degrees.

The average minimum temperature for the month was 39.5°. This was 1.8 degrees above the normal average minimum temperature of 37.7°.

 
 Roswell
 

There was 1.45 inches of precipitation reported at Roswell during April 2017, which is 0.84 inches above the normal of 0.61 inches. The 1.45 inches tied for the 14th wettest April on record.

There was no snow in Roswell, compared to the normal of 0.3 inches.

The average temperature in Roswell for April 2017 was 63.5°, which was 2.7 degrees above the normal of 60.8 degrees.

The average maximum temperature for the month was 79.9°. This was 3.1 degrees above the average maximum temperature of 76.8 degrees.

The average minimum temperature for the month was 47.1°. This was 2.4 degrees above the normal average minimum temperature of 44.7°.

Severe Weather 
Storm reports are considered preliminary until a final review is certified in the NWS Storm Data publication.
Certified data is available three to four months post-event at: https://www.ncdc.noaa.gov/stormevents/