|
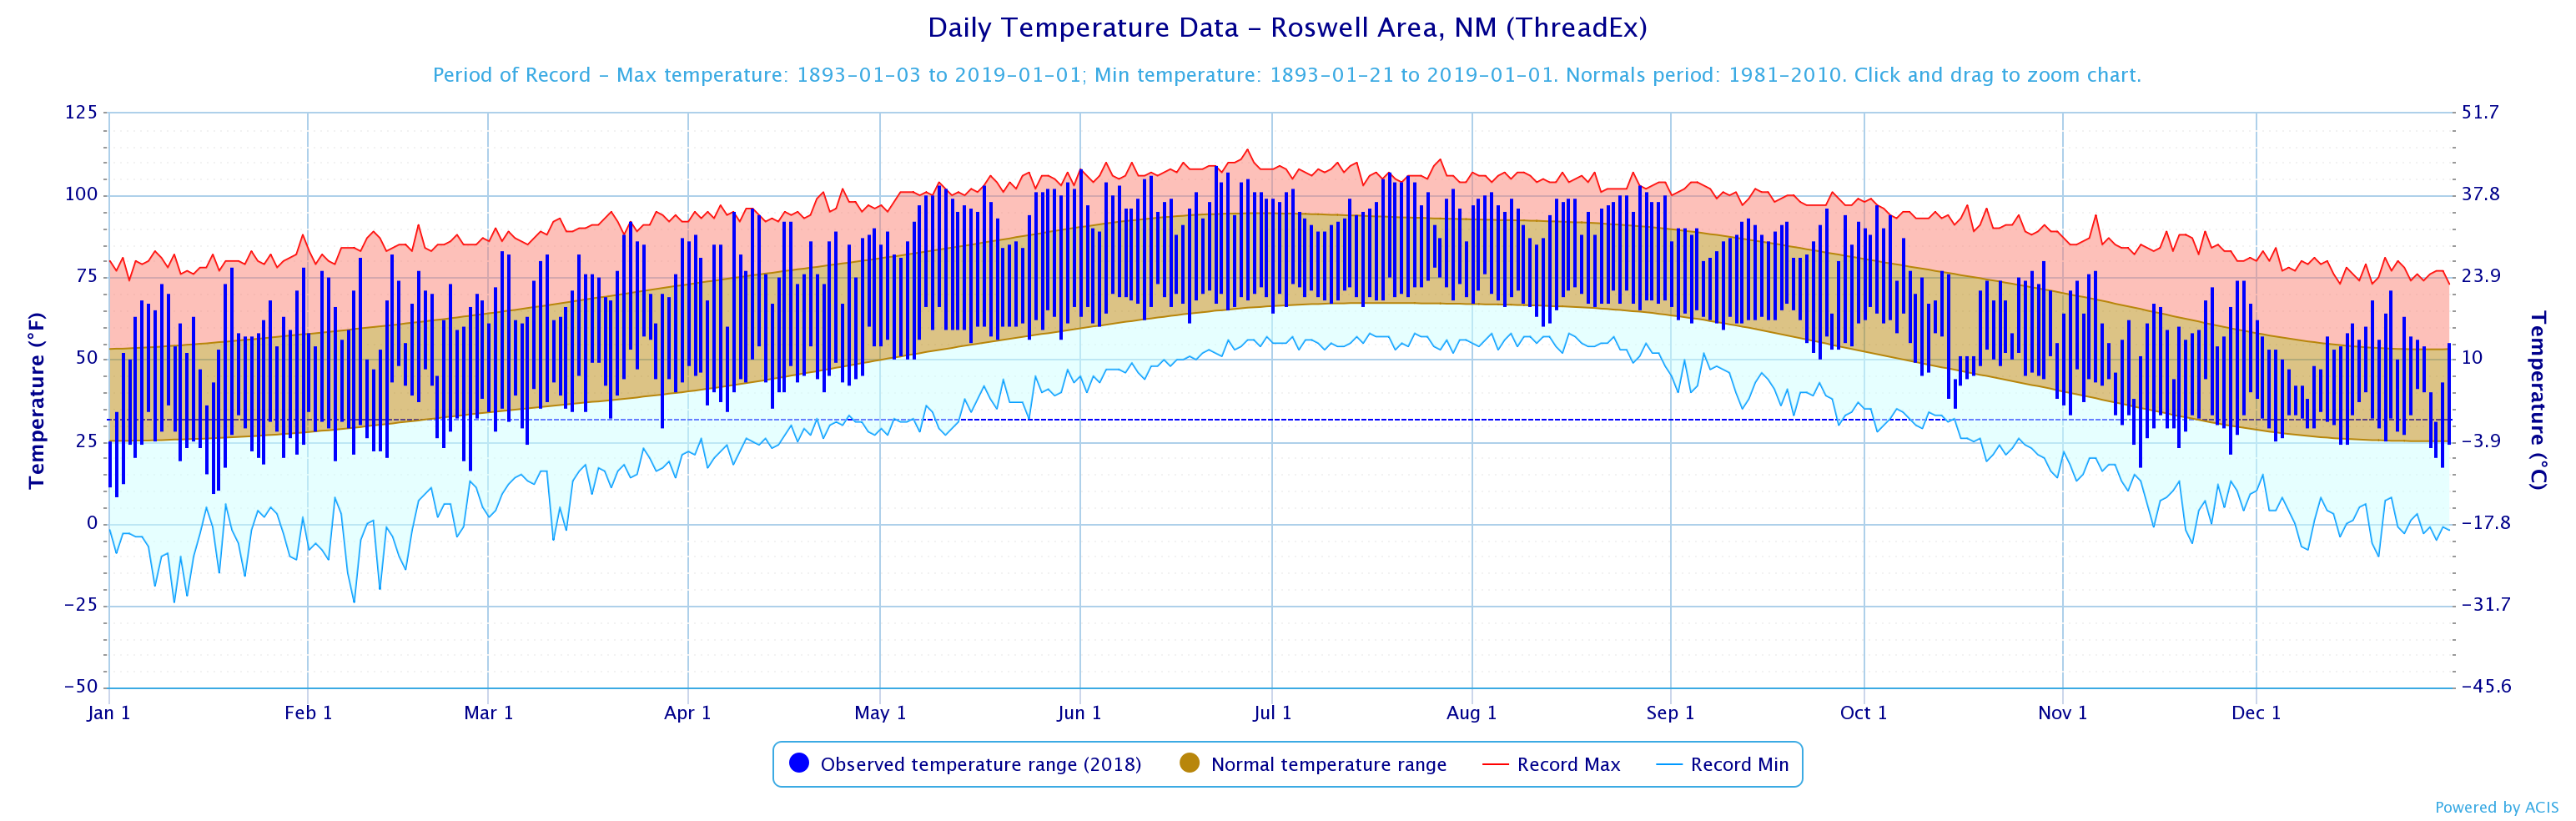
The 2018 year in Roswell was much warmer than normal, following the pattern of the past 20 plus years. In fact, of the past 21 years, only 2004 experienced below normal average temperatures! The graph below lists the actual daily temperatures, compared to normal and record highs and lows from January through December 2018.
(click image to enlarge) The average temperature for Roswell in 2018 was 63.1 degrees. This was 2.2 degrees above the 30-year normal (1981-2010) of 60.9 degrees. The long term annual normal (1893 to current) temperature is 60.0 degrees. This was the 4th warmest year on record going back 106 years! Monthly temperatures for Roswell are illustrated in the charts below, with monthly average temperatures for Roswell in red, and both long term (purple) and offical 30-year (blue) normals in the top graph, with temperature departures (using the 30-year normals) shown in the bottom graph.
|
|
January was slightly below normal and November 2 degrees below normal, while the other 10 months were above normal, with May the 2nd warmest on record, and June the 4th warmest. |
|
The average maximum temperature for Roswell in 2018 was 78.2°F, which was 2.7 degrees above normal, while the average minimum temperature was 48.0°F, which was 1.7 degrees above normal. The maximum temperatures were the primary contributor to the above normal temperatures in 2018. |
|
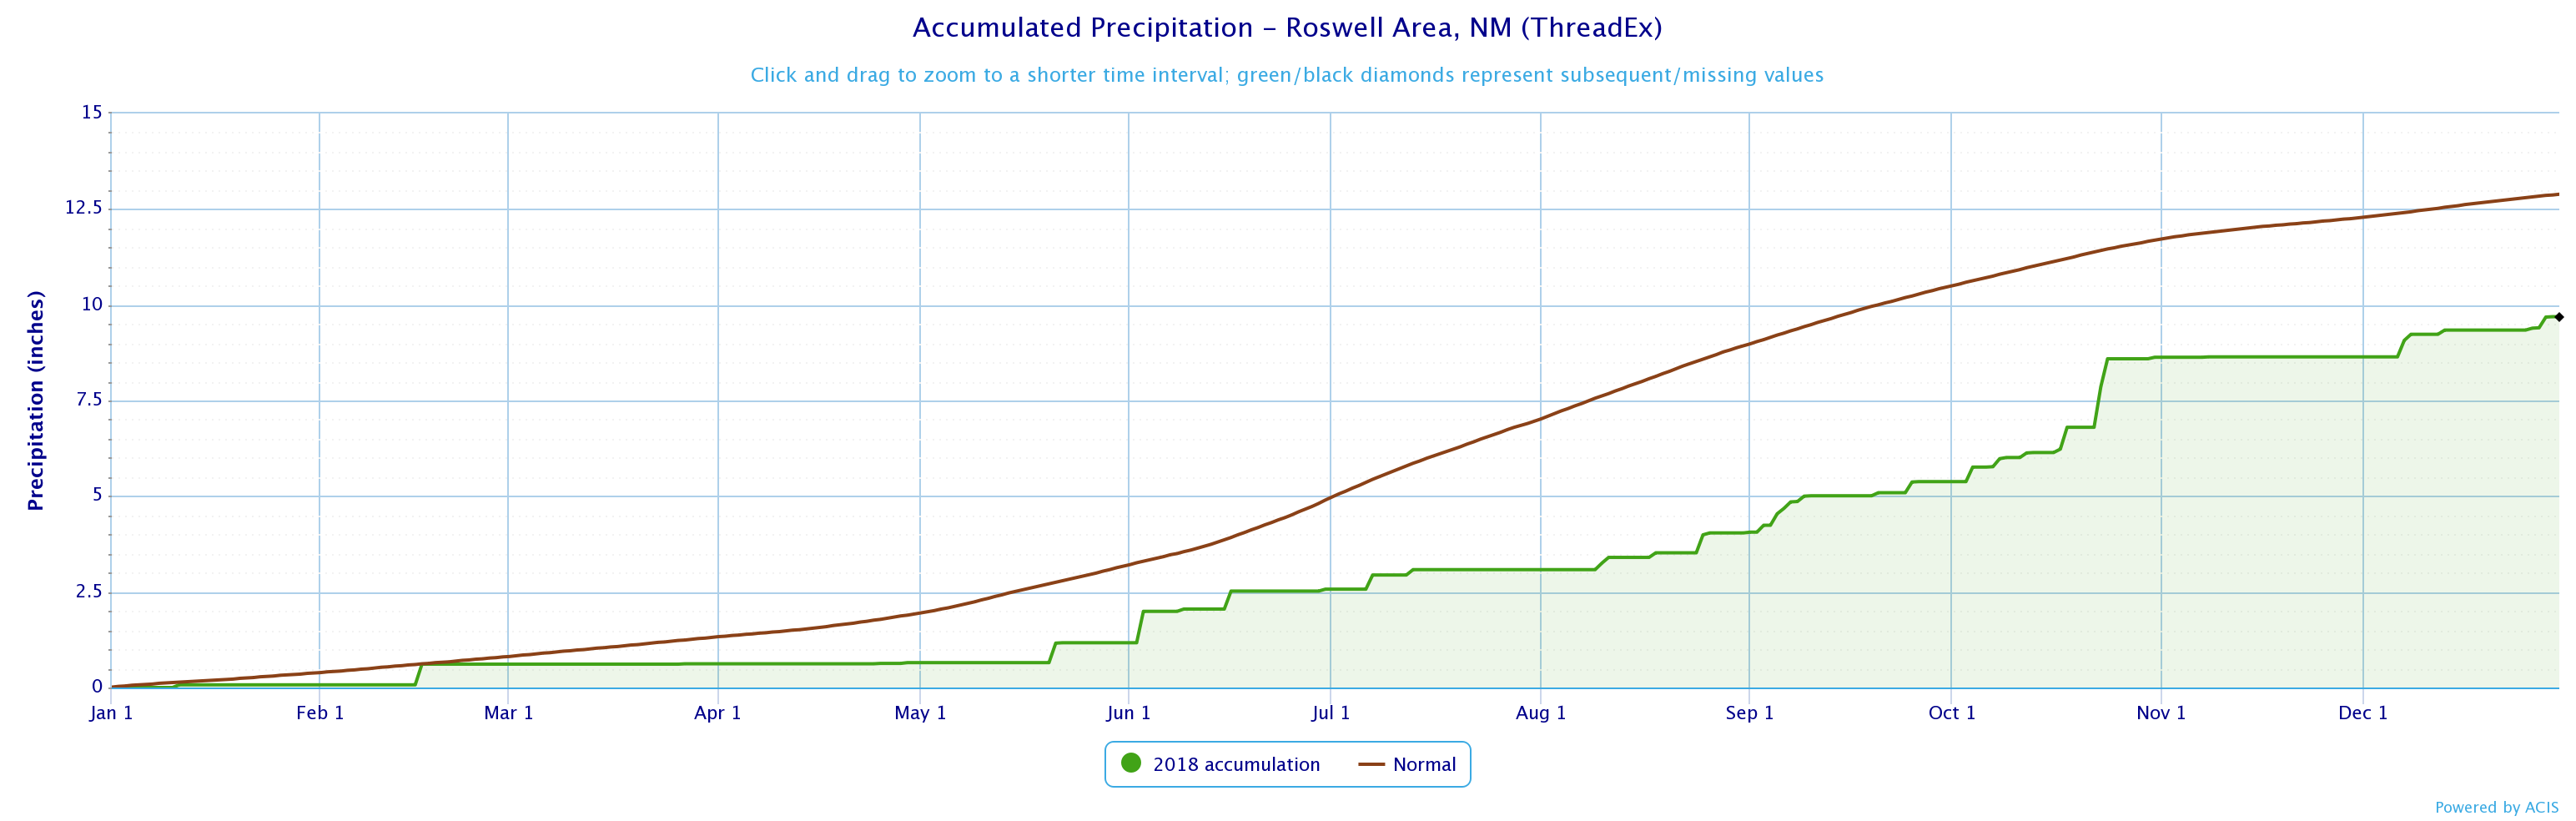
PRECIPITATION Precipitation in 2018 was below normal. The graph below displays the actual daily precipitation for Roswell (green line).
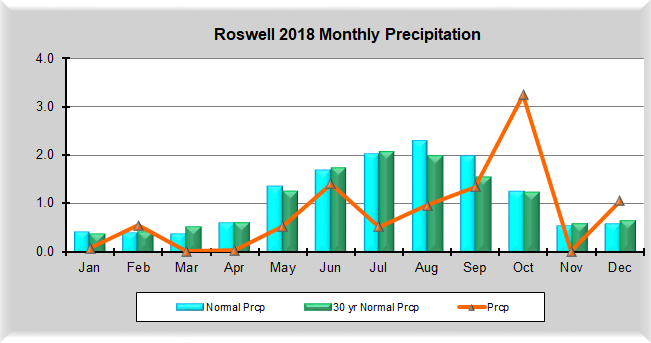
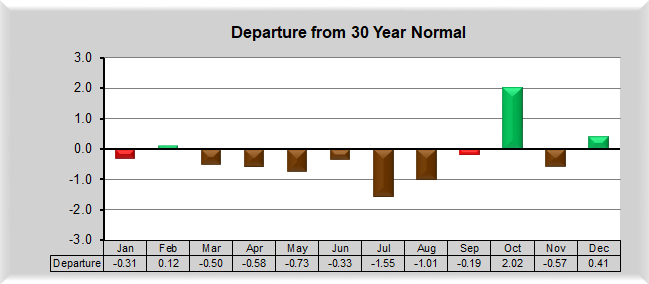
(click image to enlarge) Total precipitation in 2018 was 9.69 inches, while the official 30-year normal (1981-2010) is 12.91 inches. This was 3.22 inches below normal, the 39th driest year on record. The long term annual normal precipitation (1893 to current, but with missing years) is 12.39 inches. The monthly precipitation below (orange line) is compared to the 30-year normal (light green), the period of record normal (cyan), and the departures from normal (green or brown). |
|
The Roswell Industrial Airpark 2018 monthly precipitation was below normal in every month except February (barely), October (well above normal) and December.
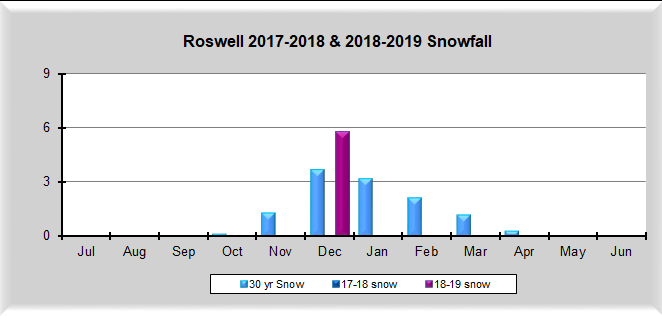
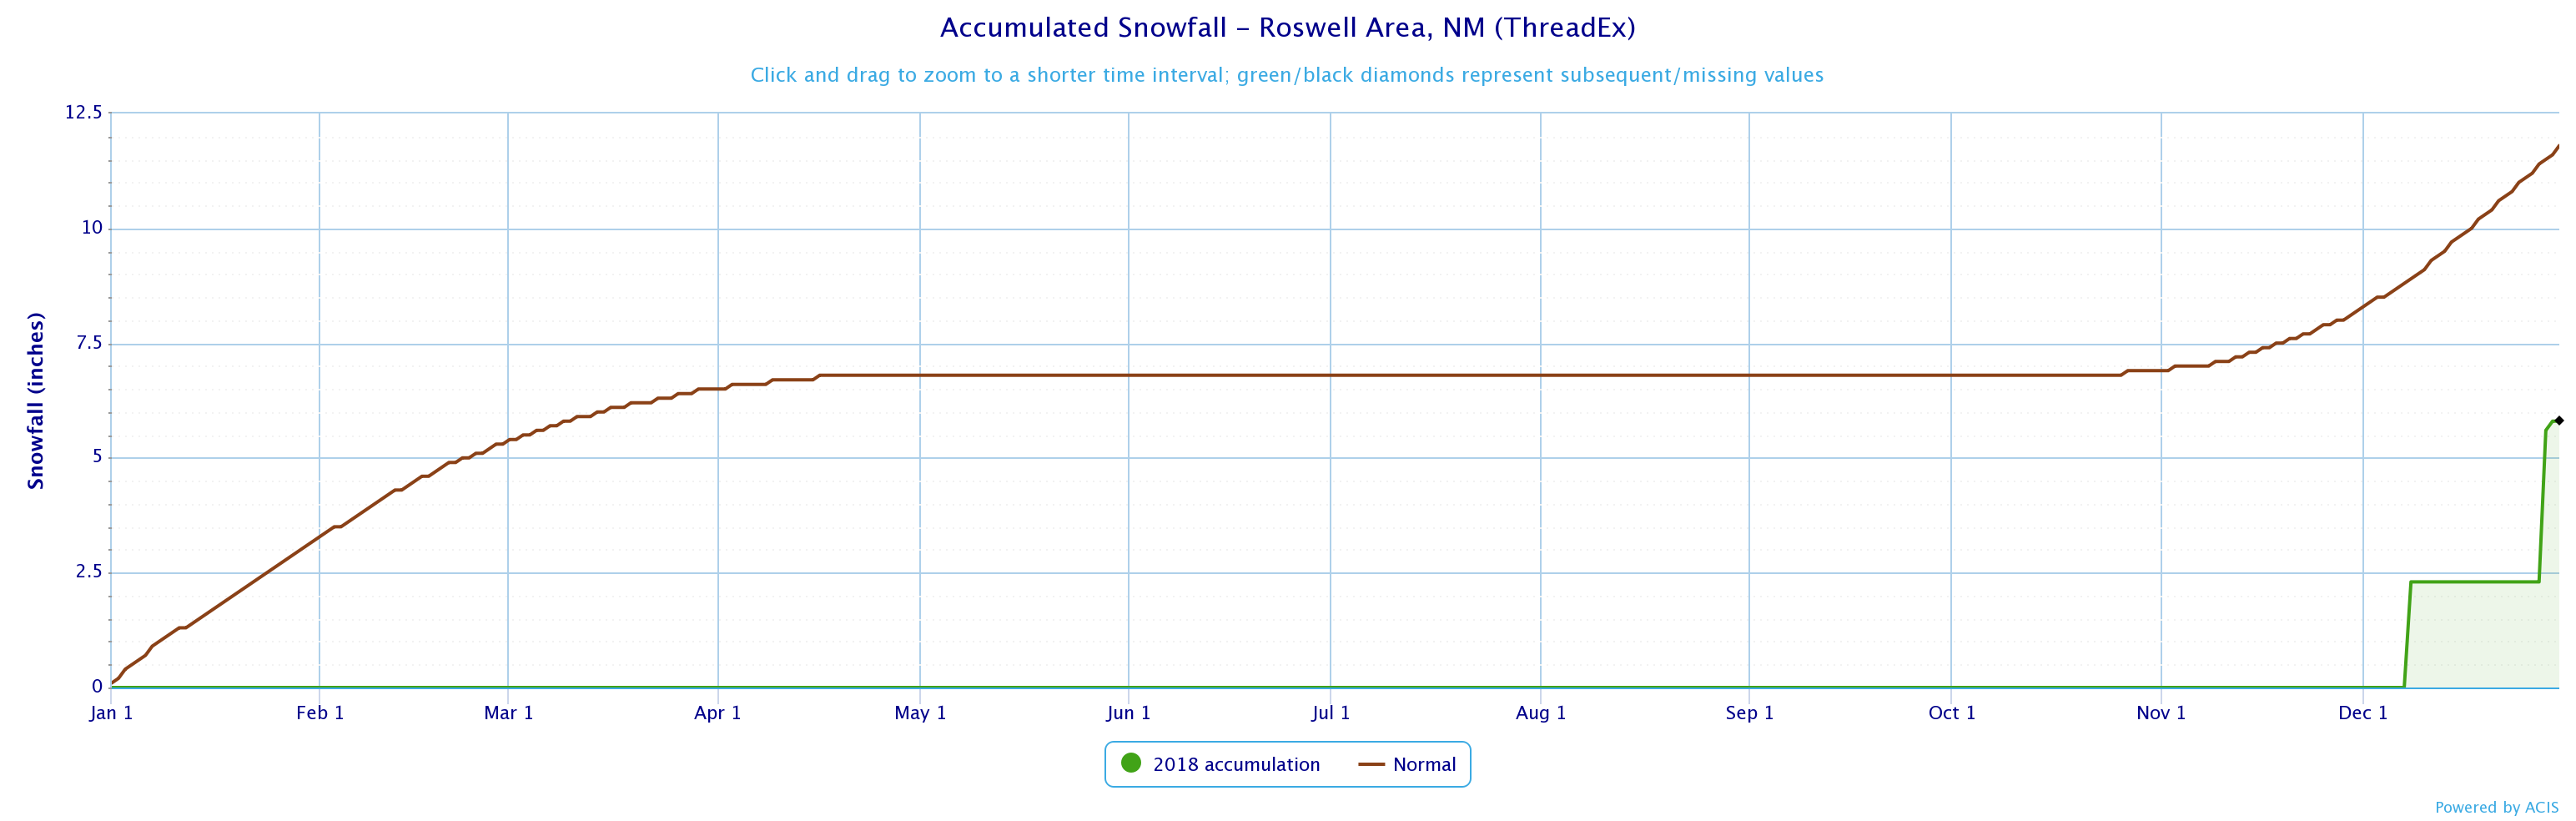
SNOW The total snowfall in calendar year 2018 for Roswell was 5.8 inches (green line). Normal annual snowfall is 11.9 inches. All of the snow came in December 2018. The table below shows the 2017-2018 (0.0 inches) and 2018-2019 (5.8 inches so far) snow seasons, which officially run from July through June.
|


.png)
.png)
.png)
.png)
.png)
.png)