
|
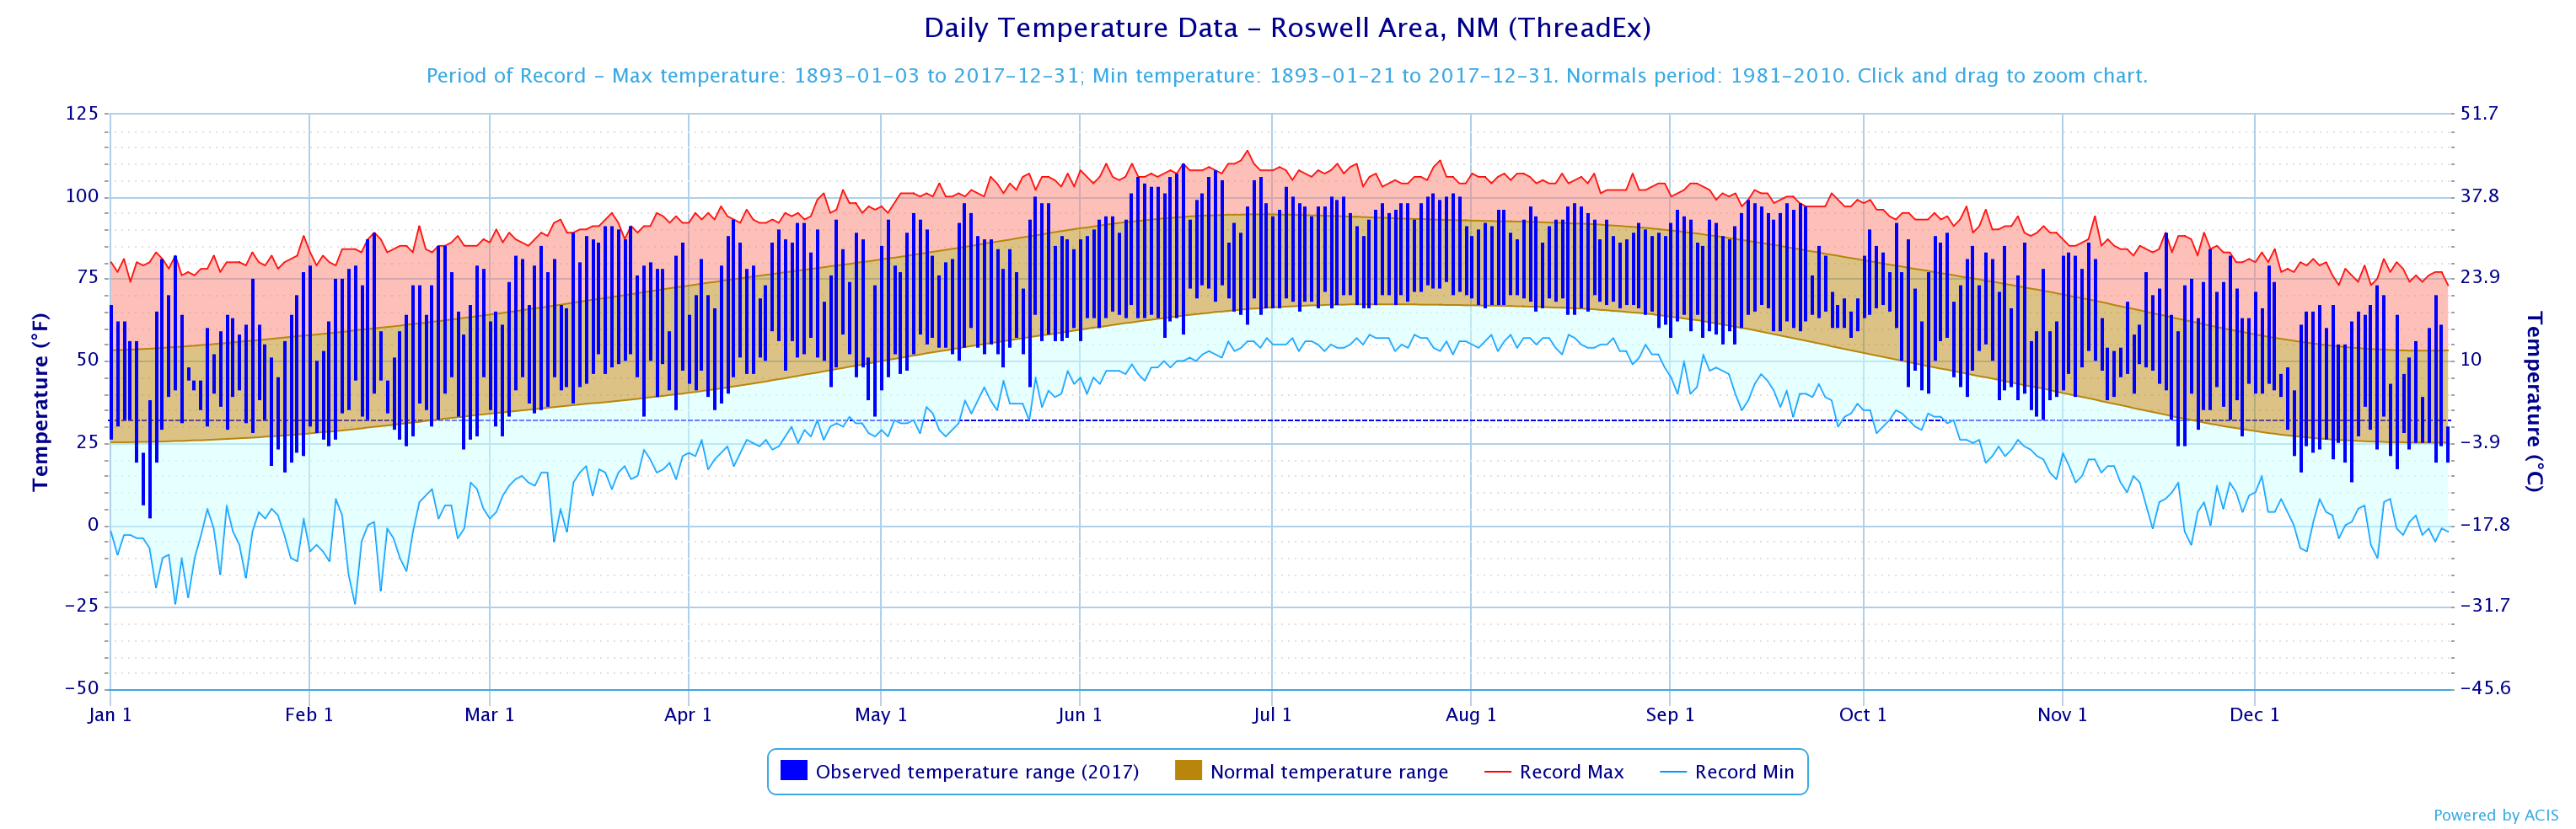
The 2017 year in Roswell was much warmer than normal, following the pattern of the past 20 years. In fact, of the past 20 years, only 2004 experienced below normal average temperatures! The graph below lists the actual daily temperatures, compared to normal and record highs and lows from January through December 2017.
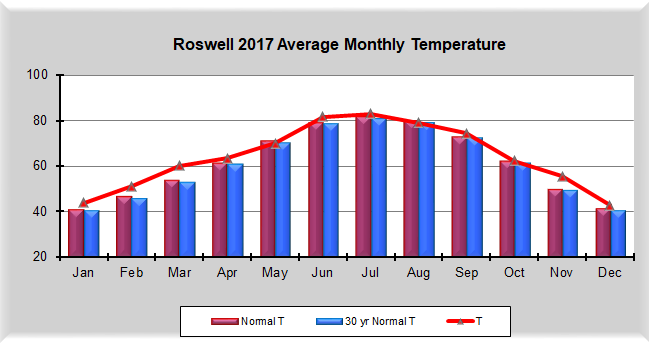
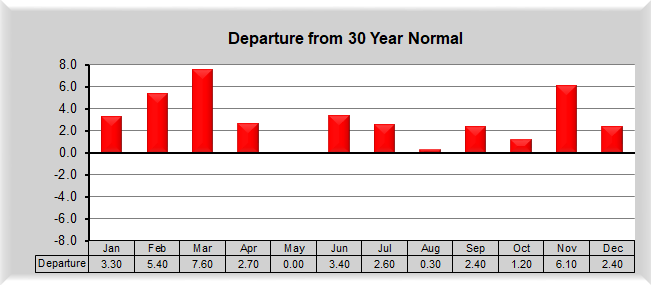
(click image to enlarge) The average temperature for Roswell in 2017 was 64.0 degrees. This was 3.1 degrees above the 30-year normal (1981-2010) of 60.9 degrees. The long term annual normal (1893 to current) temperature is 60.0 degrees. This was the warmest year on record going back 104 years! Monthly temperatures for Roswell are illustrated in the charts below, with monthly average temperatures for Roswell in red, and both long term (purple) and offical 30-year (blue) normals in the top graph, with temperature departures (using the 30-year normals) shown in the bottom graph.
|
|
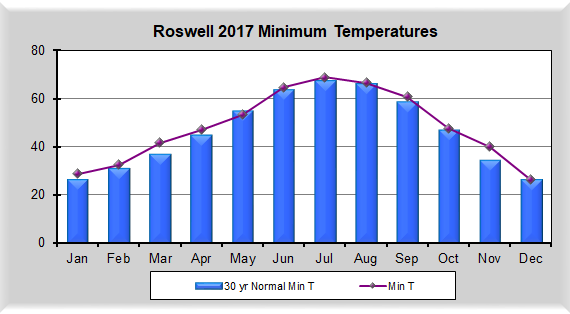
Eleven months of 2017 were warmer than normal, with May exactly normal! March and November were the warmest months on record, while February was the 5th warmest. |
|
The average maximum temperature for Roswell in 2017 was 79.8°F, which was 4.3 degrees above normal, while the average minimum temperature was 48.2°F, which was 1.9 degrees above normal. The maximum temperatures were the primary contributor to the above normal temperatures in 2017. 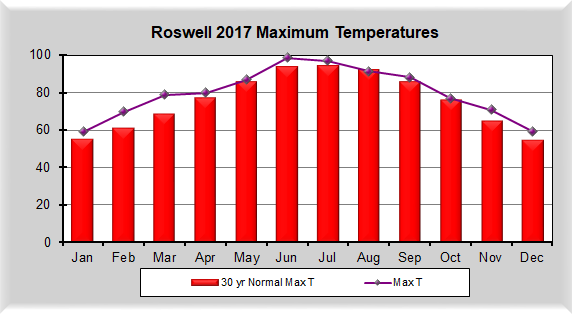
|
|
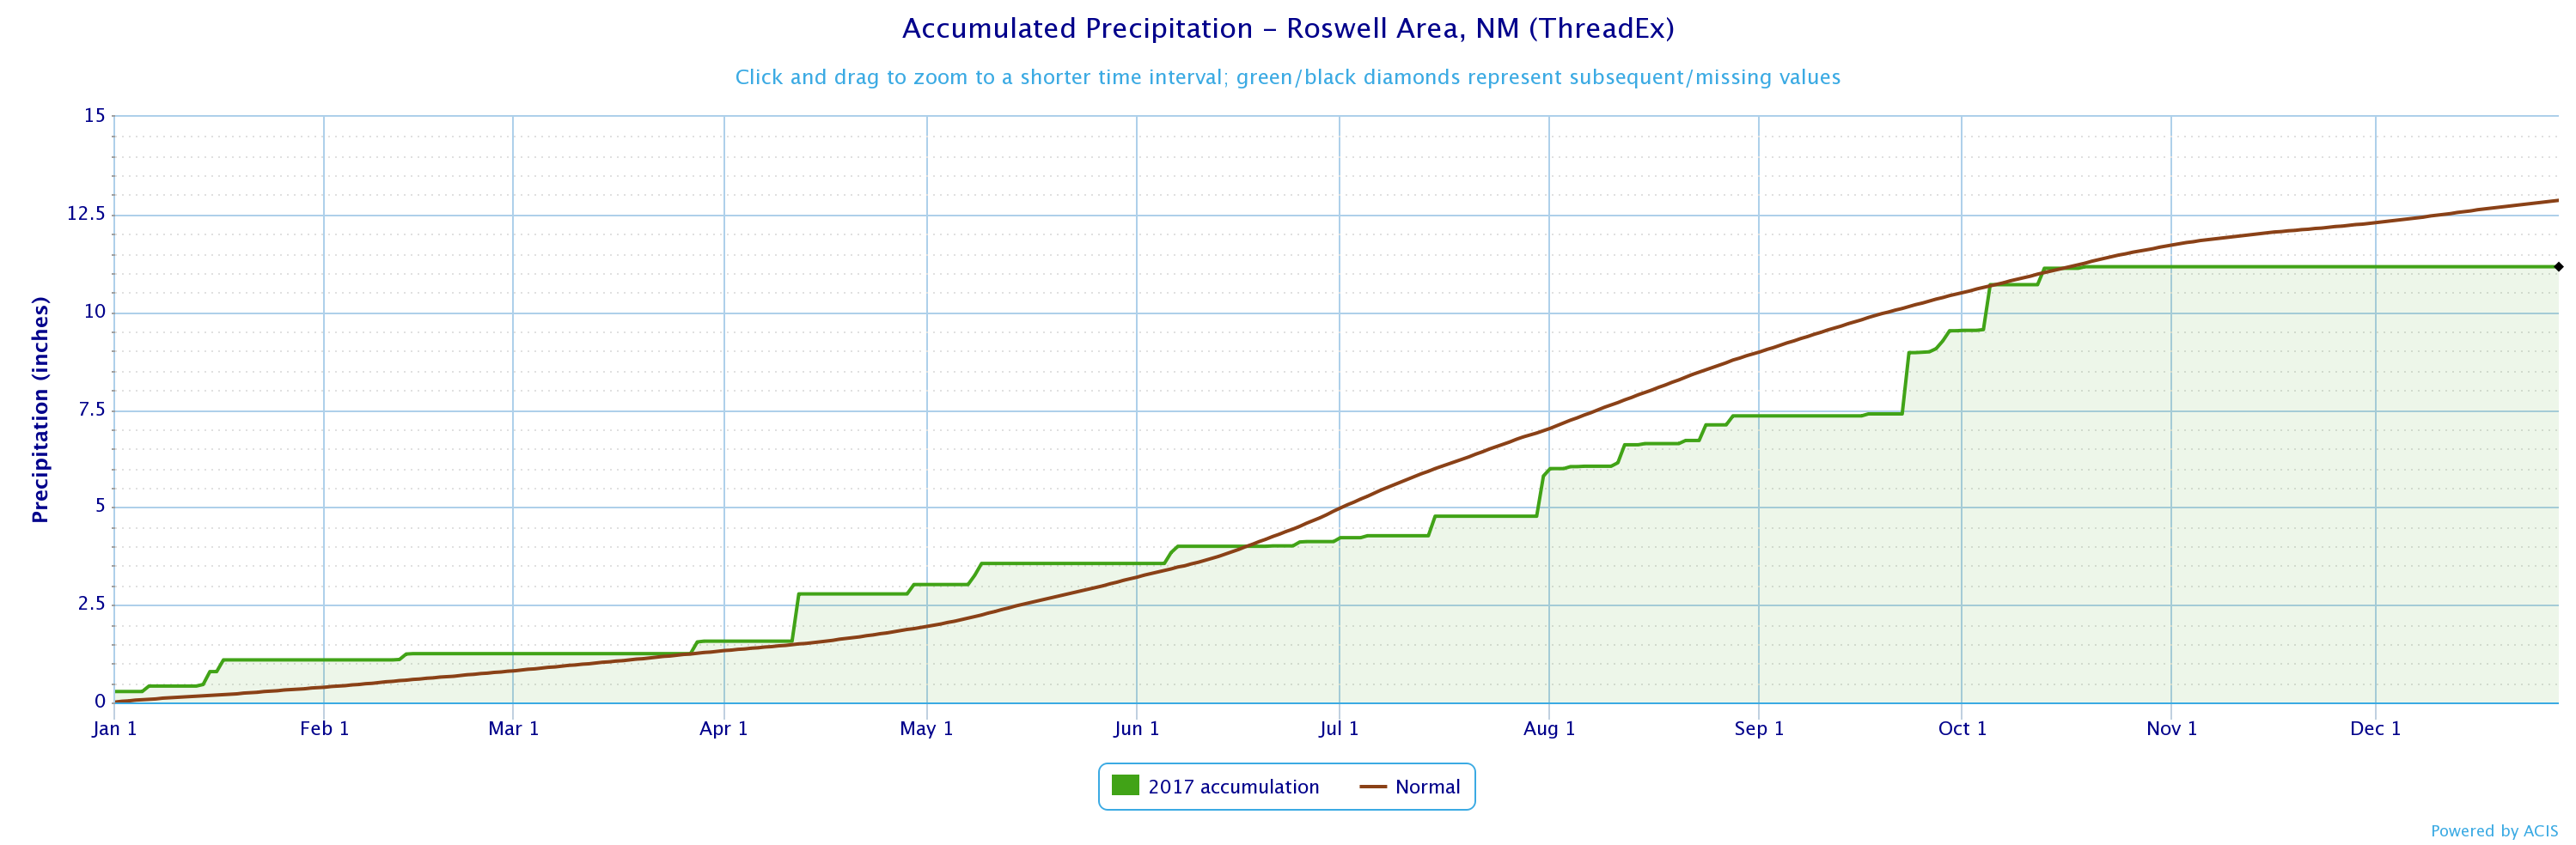
PRECIPITATION Precipitation in 2017 was below normal. The graph below displays the actual daily precipitation for Roswell (green line).
(click image to enlarge) Total precipitation in 2017 was 11.16 inches, while the official 30-year normal (1981-2010) is 12.91 inches. This was 1.75 below normal, the 49th driest year in the past 121 years of records (4 years not included due to missing data). The long term annual normal precipitation (1893 to current) is 12.39 inches. The monthly precipitation below (orange line) is compared to the 30-year normal (light green), the period of record normal (cyan), and the departures from normal (green or brown). |
|
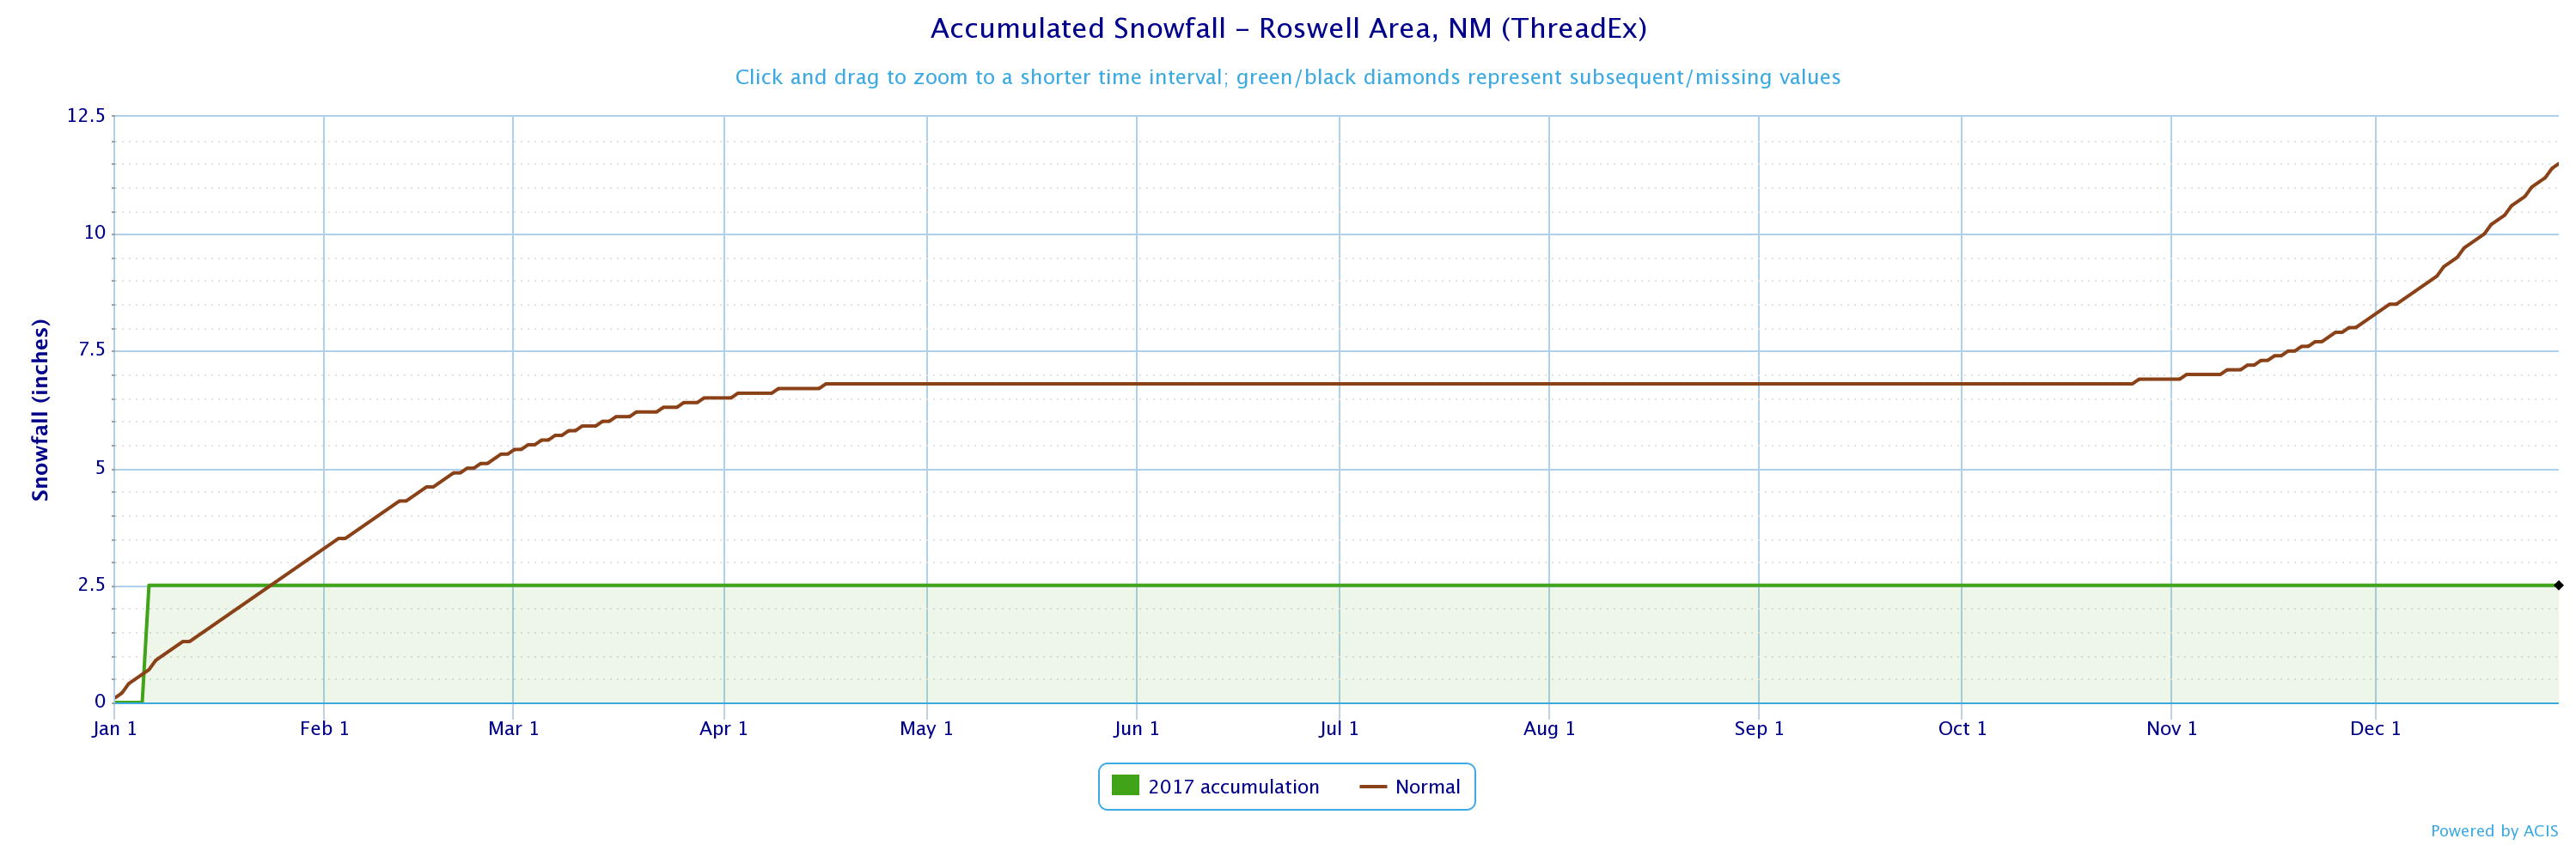
The Roswell Industrial Airpark 2017 monthly precipitation was below normal in eight months and above normal in four months above normal. Whether above or below normal, the amounts did not stray too far from normal, mostly within an inch or so, and none near the record wettest or driest. SNOW The total snowfall in calendar year 2017 for Roswell was only 2.5 inches (green line). Normal annual snowfall is 11.9 inches. All of the snow came in January 2017. The table below shows the 2016-2017 (2.5 inches) and 2017-2018 (0.0 inches so far) snow seasons, which officially run from July through June.
|


.png)
.png)
.png)