
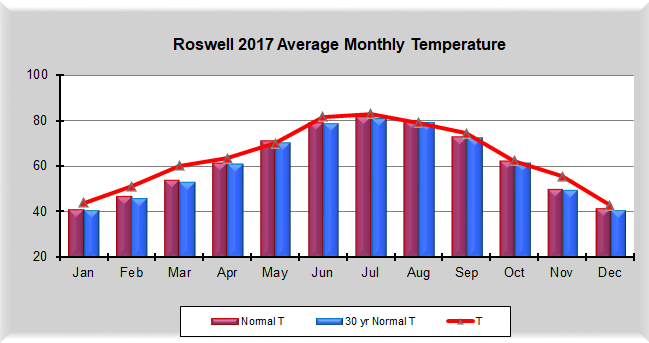
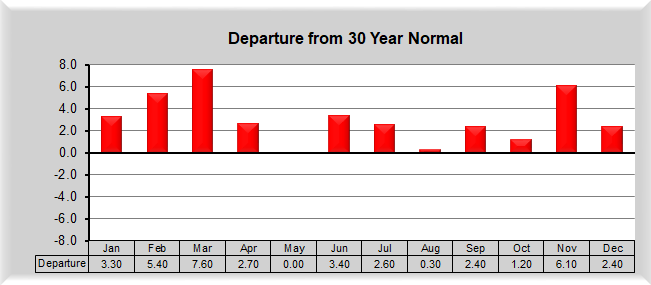
|
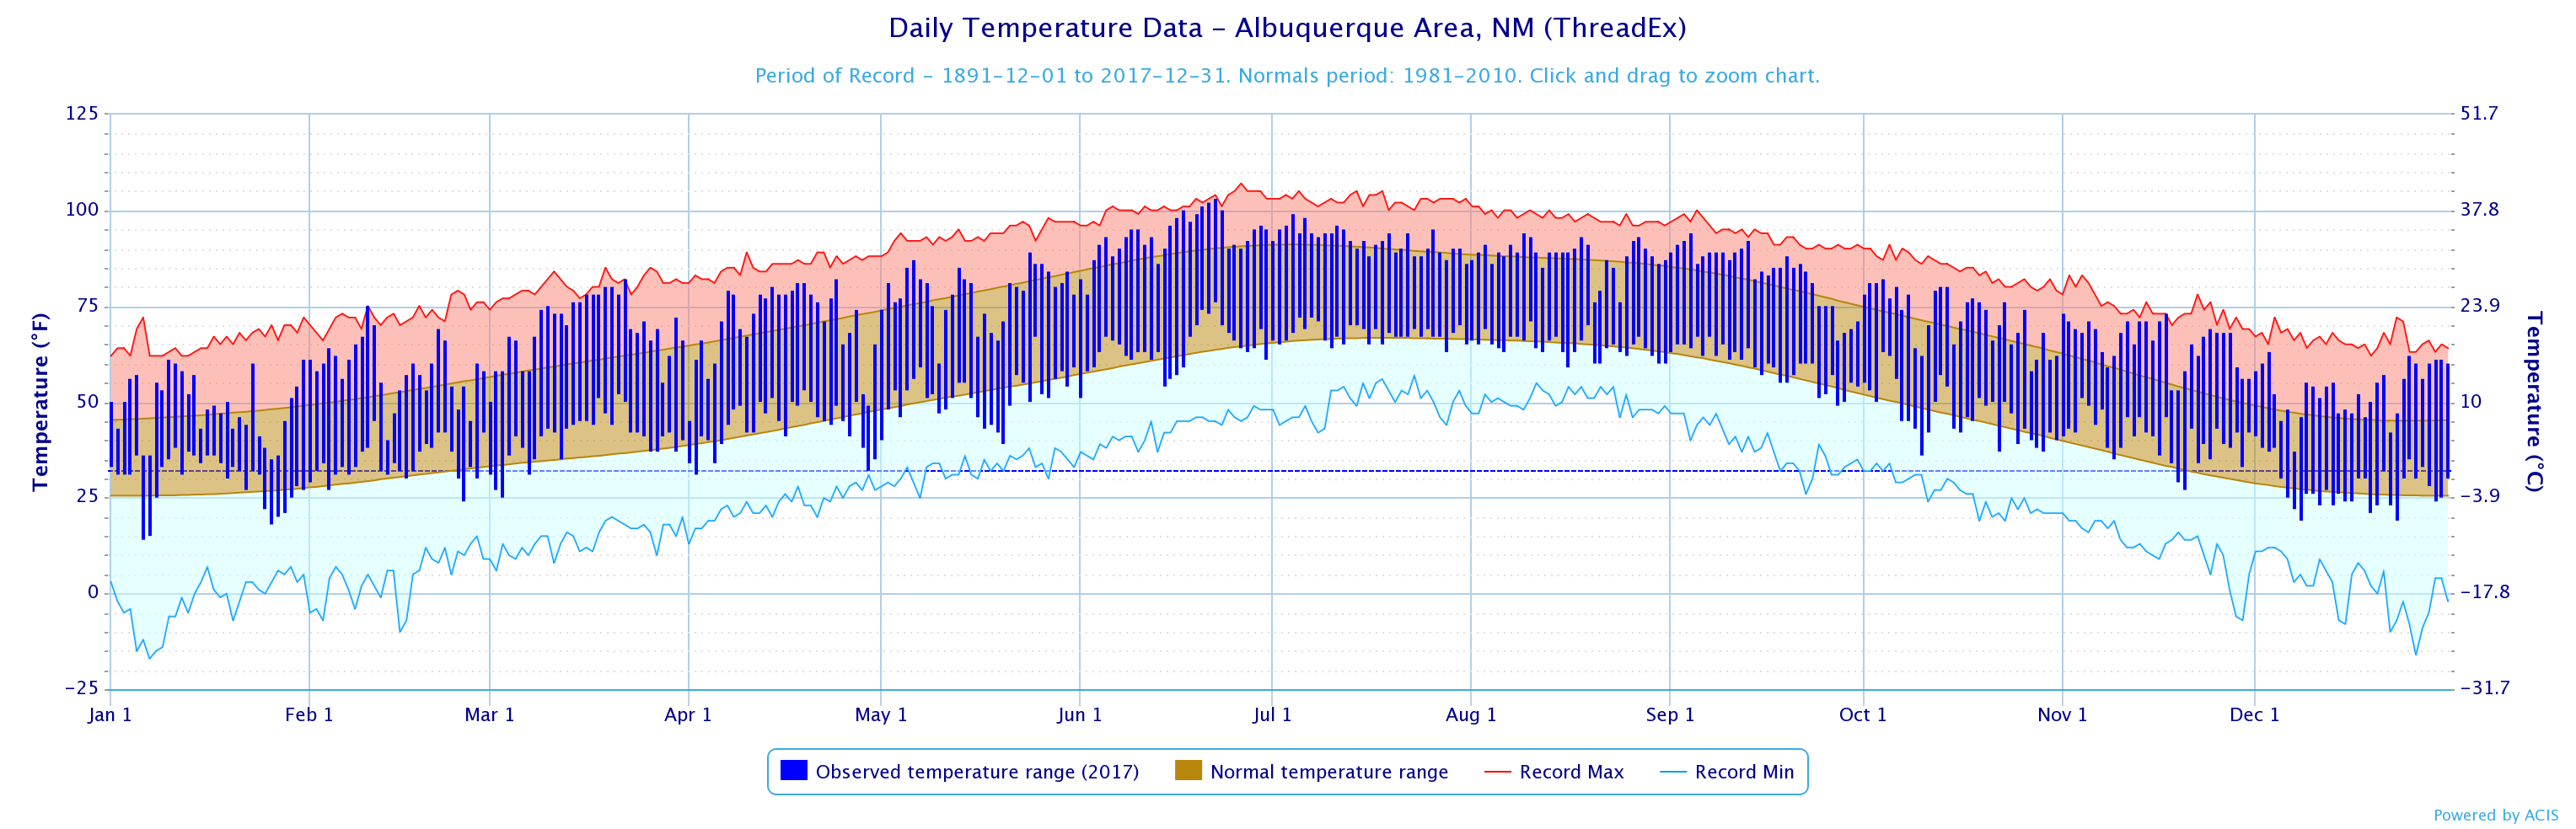
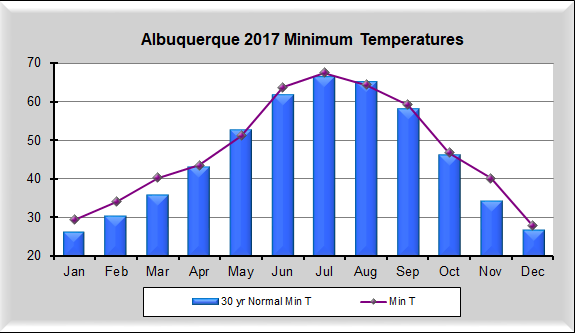
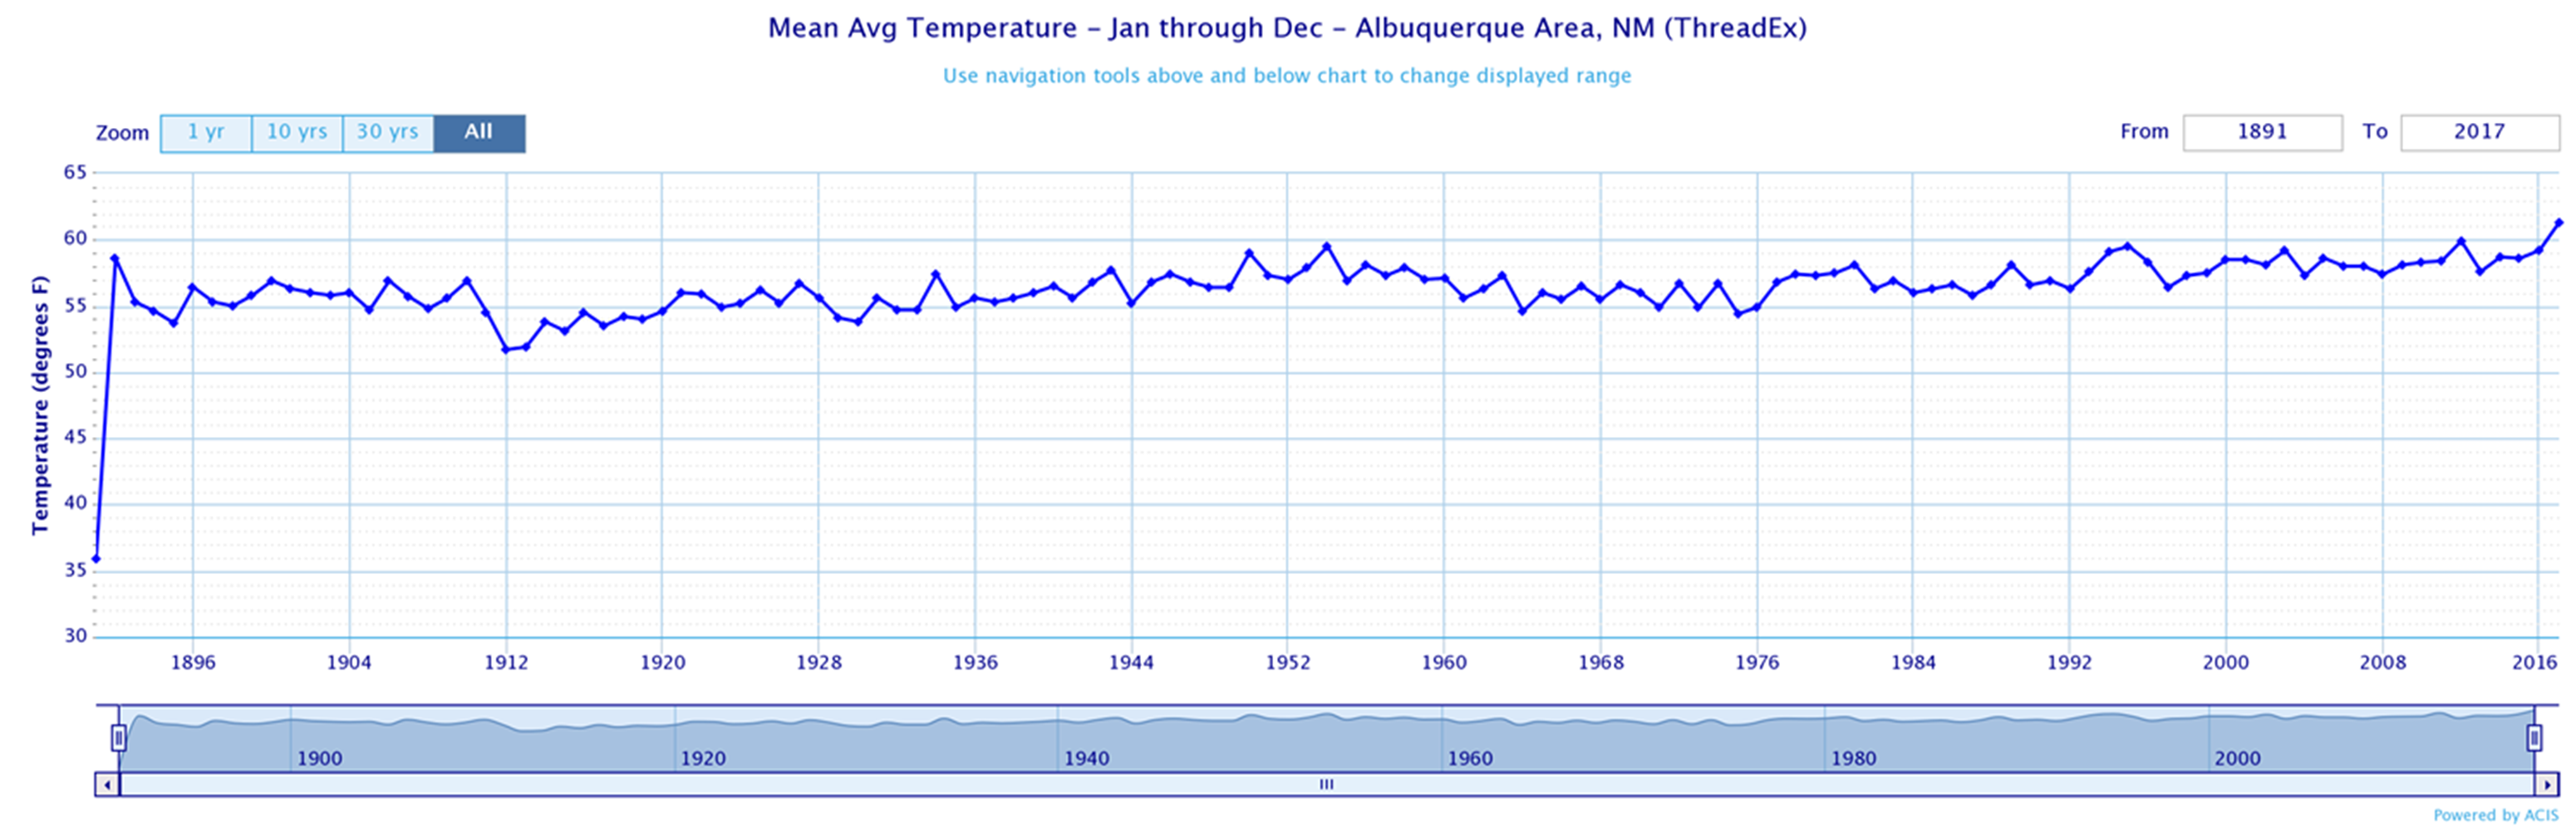
The 2017 year in Albuquerque was much warmer than normal, which has been the norm of the past 15 or so years. The average temperature was 60.1 degrees, the warmest year since complete records began in 1893! Since 2000, 14 years have ranked in the top 25 warmest years on record! (click image to enlarge) The average temperature for Albuquerque in 2017 was 60.1 degrees. This was 2.9 degrees above the 30-year normal (1981-2010) of 57.2 degrees. The long term annual normal (1893 to current) temperature was 56.6 degrees. 2017 was the warmest year on record in Albuquerque, going back to 1893, or 125 years! Monthly temperatures for the Albuquerque Sunport in 2017 are illustrated in the charts below, with monthly average temperatures for Albuquerque in red, and both long term (purple) and 30-year (blue) normals in the top graph, with departures shown in the bottom graph.
Ten of the 12 months in 2017 experienced above normal temperatures, with only May slightly below normal, and August exactly normal! The year began with above normal temperatures in January, and they just kept getting warmer with well above normal temperatures in February and March. In fact, February 2017 was the 5th wamest on record, and March the warmest! April was a little above normal then May a little below normal. The rest of the months in 2017 were above normal, with November 2017 the warmest on record, by far! |
|
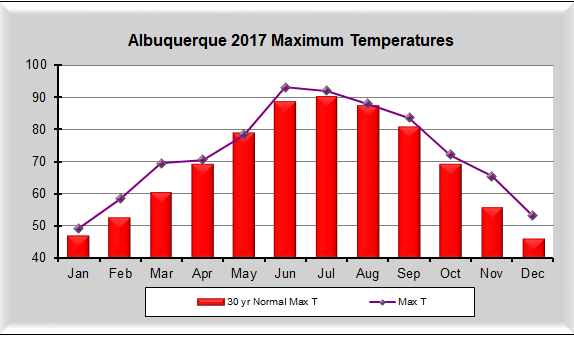
The average maximum temperature for Albuquerque in 2017 was 72.8°F (+4.0 degrees above normal), while the average minimum temperature for the year was 47.4°F (+1.9 degree above normal). Thus, the maximum temperatures in 2017 were more of a contributor to the warmer than normal average temperatures. The maximum and minimum monthly average temperatures are shown in the graphs below..
|
|
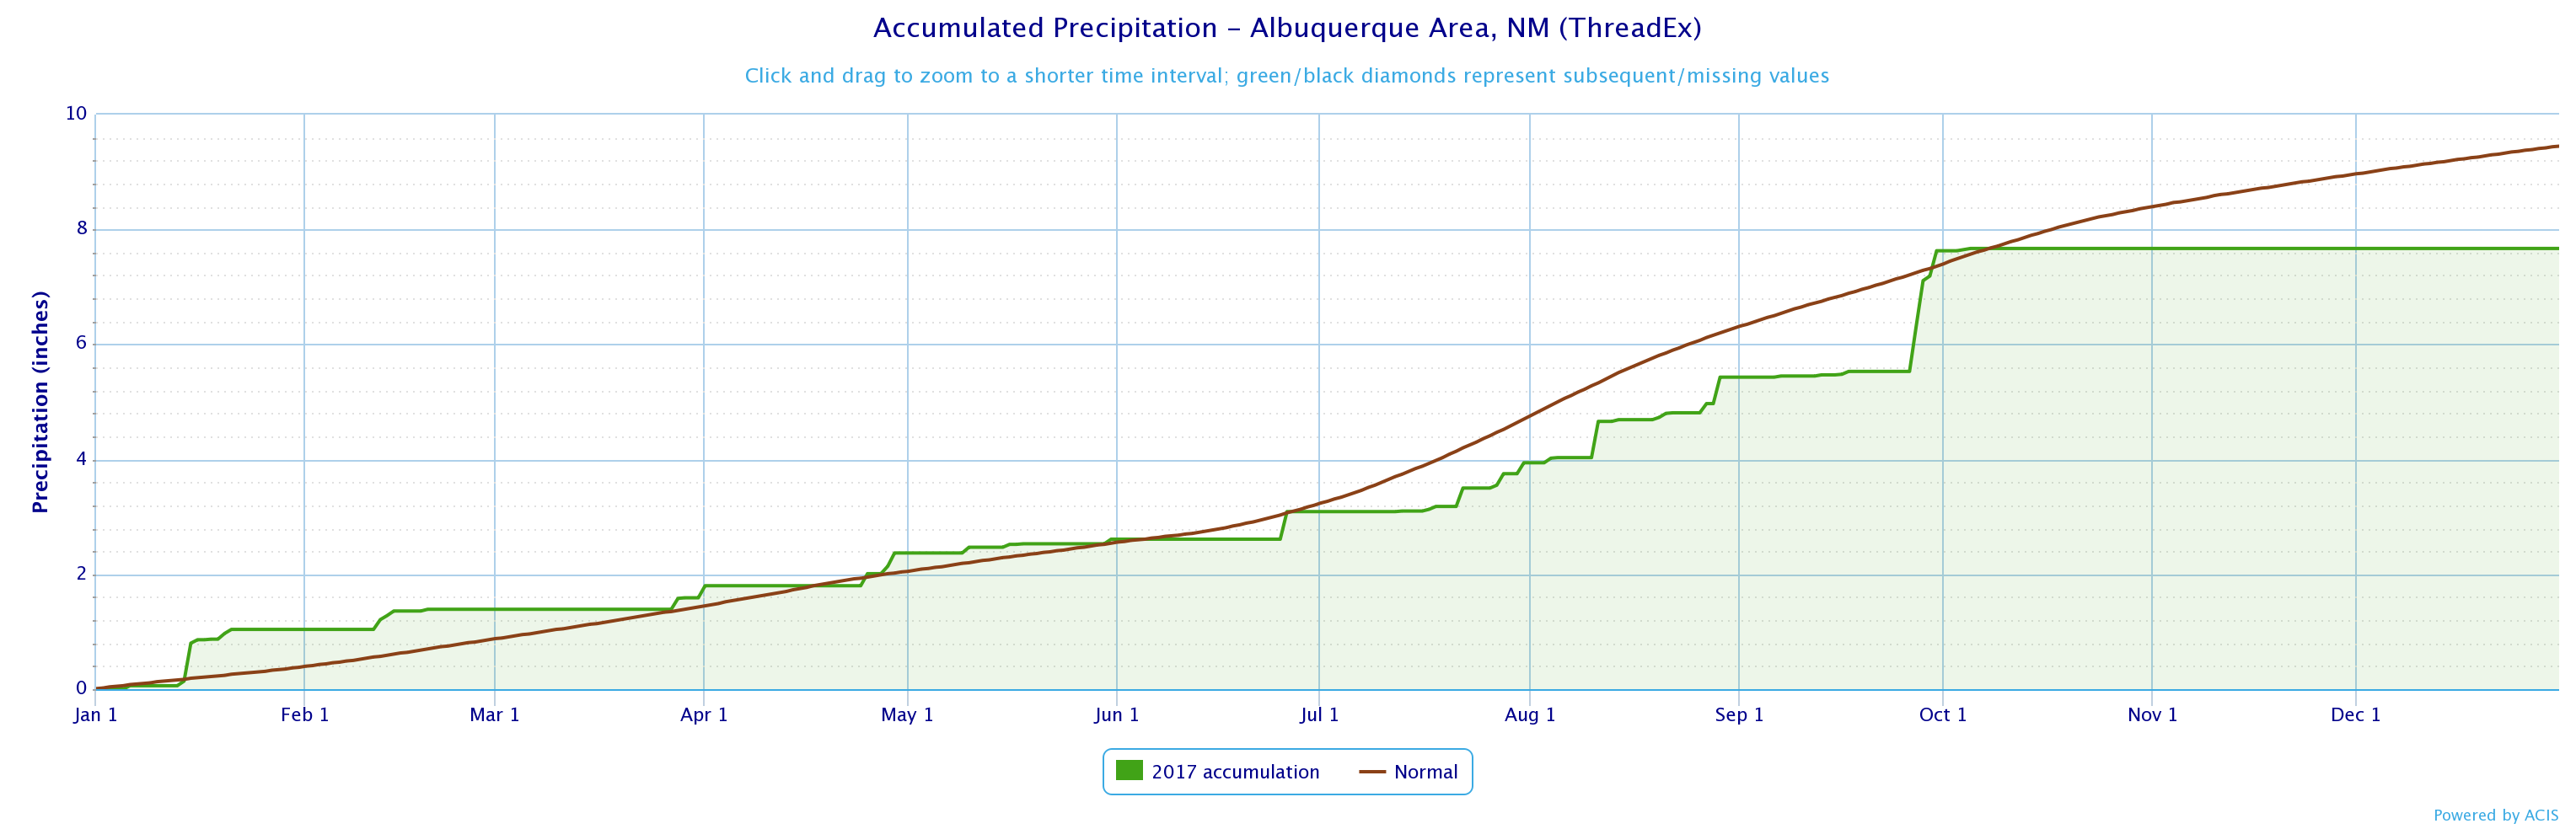
PRECIPITATION Precipitation in Albuquerque for 2017 was below normal, like many recent years have been. In the past decade, only 2015 recorded above normal precipitation. The graph below displays the actual daily precipitation (green line below) for 2017.
(click image to enlarge) Total precipitation in 2017 was 7.67 inches, while the official 30-year normal (1981-2010) is 9.45 inches. This was a deficit of 1.78 inches. It was another drier than normal year, with only 2015 wetter than normal in Albuquerque since 2007. The long term annual precipitation (1892 to current) averages 8.56 inches. 2017 was tied for the 50th driest on record since 1892. The monthly precipitation (orange) is shown below and is compared to the 30-year normal (light green), the long term period of record normal (cyan), and the departures from normal (green or brown).
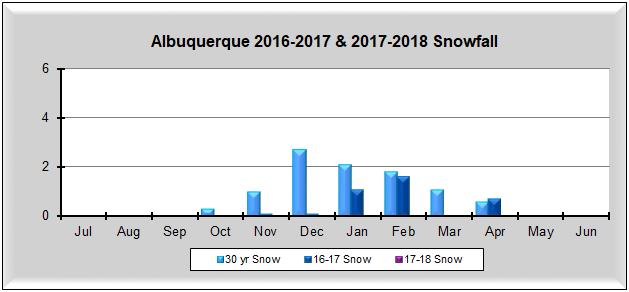
The year began with January above normal, then February through August were below normal, except April was slightly above. September was well above normal, then the final three months well below normal. In fact, the year ended up with 87 consecutive days with no measurable precipitation, the 6th longest stretch on record. SNOWFALL The Albuquerque Sunport (green line below) measured just 3.4 inches of snow in calendar year 2017. The 30-year normal (1981-2010) is 9.6 inches while the long term normal (1892-current) is 9.7 inches.
(click image to enlarge) The table below shows the snowfall for the 2016-2017 and 2017-2018 seasons so far, which officially run from July through June. The 2016-2017 total was just 3.6 inches while the current 2017-2018 season has no snowfall so far.
The Albuquerque South Valley received 10.61 inches of precipitation in 2017 and 3.7 inches of snow. |


.png)
.png)
.png)