August 2016 Weather Review
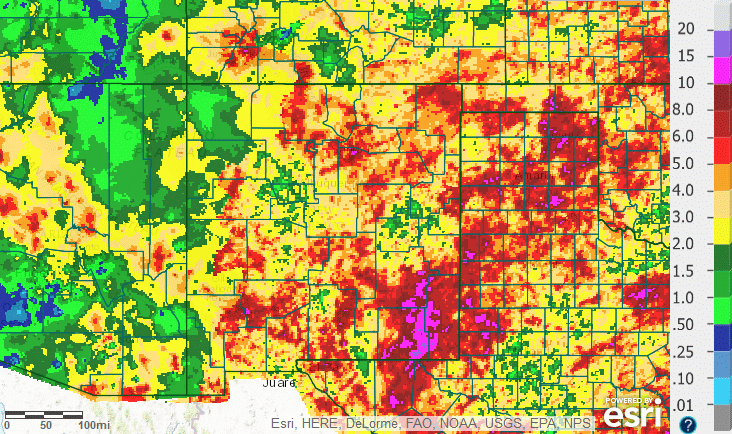
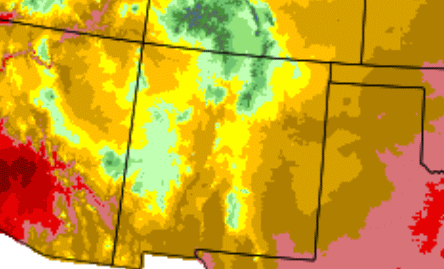
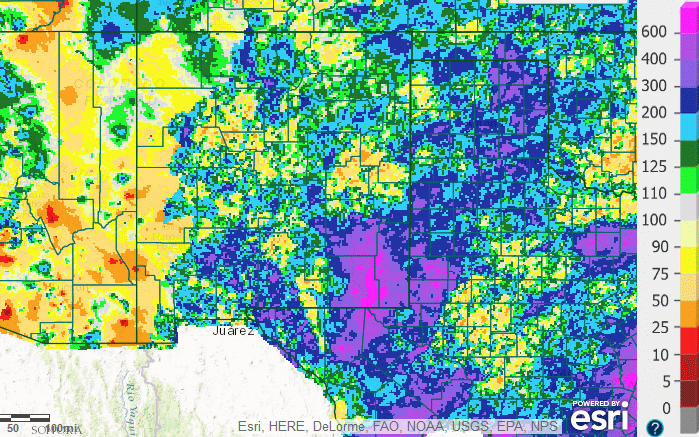
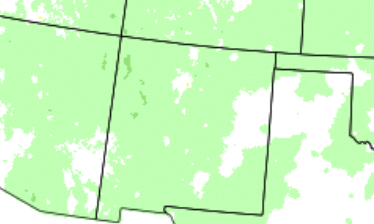
August in New Mexico was mostly wetter than normal, while temperatures were near to below normal.
The monsoon finally took hold of New Mexico the last two days of July, and continued through most of August. Isolated flash flooding was noted early in the month, on the 2nd through the 4th and on the 7th. It was not until the 21st and 22nd that flash flooding was reported again. Serious flooding occurred around Alcalde, La Villita, Hernadez, Chamita and Chama on the 22nd. The final week of the month was moderately active.
Statewide Precipitation and Temperatures
| Statewide Precipitation - Actual |
Statewide Temperatures - Actual |
 |

|
| |
 |
| Statewide Precipitation - Depature From Normal |
Statewide Temperatures - Departure From Normal |
 |
 |
| |
 |
Climate Cities Temperatures and Precipitation
| Albuquerque |
| |
|
There was 0.86 inches of precipitation measured at the Sunport in August 2016, compared to the normal of 1.50 inches, or 0.72 inches below the average of 1.58 inches.
The average temperature for Albuquerque in August 2016 was 74.1°, which was 2.1 degrees below the normal of 76.2°.
The average maximum temperature for the month was 85.8°. This was 1.4 degrees below the normal average maximum temperature of 87.2°.
The average minimum temperature for the month was 62.5°. This was 2.6 degrees below the normal average minimum temperature of 65.1 degrees.
Records: none
|
| |
| Clayton |
| |
|
There was 6.50 inches of precipitation measured at Clayton in August 2016, compared to the normal of 2.66 inches, or 3.56 inches above the average of 2.94 inches. This was the wettest August on record beating the old record of 5.85 inches in 1927.
The average temperature for Clayton in August 2016 was 71.7°, which was 1.6 degrees below the normal of 73.3°.
The average maximum temperature for the month was 84.3°. This was 1.9 degrees below the normal average maximum temperature of 86.2 degrees.
The average minimum temperature for the month was 59.2°. This was 1.1 degrees below the normal average minimum temperature of 60.3°.
Records: wettest August on record (since 1904).
|
| |
| Roswell |
| |
|
There was 5.05 inches of precipitation reported at Roswell during August of 2016, which is 3.08 inches above the normal of 1.97 inches. This was the third wettest August on record, behind only 1916 (9.56) and 1974 (6.48).
The average temperature in Roswell for August 2016 was 78.6°, which is 0.1 degrees below the normal of 78.7 degrees.
The average maximum temperature for the month was 91.1°. This was 0.6 degrees below the average maximum temperature of 91.7 degrees.
The average minimum temperature for the month was 66.1°. This was 0.3 degrees above the normal average minimum temperature of 65.8°
Records: Daily precipitation on the 21st: 2.19 inches.
|