 |
|||||||||||||
| Introduction | |||||||||||||
|
This web feature is a summary of a project focused on an observational analysis of the wettest year on record in New Mexico, the year 1941. The overarching goal of this project was to explain how and why the year 1941 was so abnormally wet across all of New Mexico and if these conditions are likely to occur again. Many different variables and climatic indices were examined, including the Palmer Drought Severity Index (PDSI), monthly precipitation statistics, temperature, monsoon rainfall, sea surface temperature (SST) anomalies, historic weather map analyses, tropical storm remnants, synoptic-scale composites, analyses of individual conditions that produce certain storm events, and external factors such as El Niño-Southern Oscillation indices over various spatial and temporal extents. |
|||||||||||||
| New Mexico annual average precipitation from 1896 through 2013 is shown in the graph below. In semi-arid locations such as New Mexico precipitation is highly variable as evident in the graph. However, there's one value that stands out as extreme - the annual precipitation for 1941 of 26.25 inches looks out of place when compared to other years and the average statewide precipitation of approximately 14 inches. At first glance, it looks like it might be an error in the data but examination of monthly precipitation values at numerous stations in New Mexico for 1941 indicates that the value is correct. 1941 had significant precipitation - almost double the long-term average of 13.96 inches. Imagine that in a typical year a foot of precipitation is received - then picture the implications of receiving twice that amount in 1941. | |||||||||||||
 |
|||||||||||||
|
The completion of an observational study of the extreme precipitation in 1941 is difficult because upper air data wasn't fully available until after 1950, making it challenging to identify atmospheric regimes that contributed to anomalous precipitation events. Still, the extreme nature of the 1941 precipitation prompts numerous questions, such as: What does it take to generate climate anomalies? Can this anomaly be explained by climate variability, a strong monsoon, active storm tracks, tropical storm remnants, or a combination of one or more of these factors? Is it a one-time event or could it happen again? Is it predictable?
A central theme of this analysis is whether the wet conditions in 1941 were the sum of individual, connected weather events - analogous to an unusual, but random and unpredictable run of dice throws at a casino - or alternatively, whether the extremely wet series of weather events described in the analysis can be explained in terms of one or more specific causes that acted to organize storm systems over time to produce the wet anomaly in 1941. |
|||||||||||||
| Severity, Area, and Duration of 1941 Precipitation Anomalies | |||||||||||||
 |
The 1941 anomaly was initially quantified through an evaluation of the severity, area, and duration (SAD) of precipitation anomalies. The percent of normal precipitation for climate divisions (sub-regions of each state that have relatively uniform climate characteristics) ranged from 100 to 300 percent of normal when comparing monthly precipitation for the climate divisions for New Mexico and adjoining states for different time periods. Shown to the left are the climate divisions in Utah, Arizona, Colorado, New Mexico, and Texas with 1941 precipitation values compared to a 60-year (1951-2010) time scale. Divisions in eastern New Mexico, western Texas, and western Arizona have the largest percent of normal. Though not shown here, anomalies on 12-month, 24-month, water year, and 80-year (1931-2010) record time scales show little variation. |
||||||||||||
| Historical Context | |||||||||||||
| Bounded historical records from the U.S. Department of Commerce Weather Bureau for 1941 are stored at the NWS Albuquerque Office. These publications contained many interesting weather details for the year and described impacts of the numerous rain events in 1941. An example of the records is shown below. | |||||||||||||
|
Highlights for the year obtained from these records include:
|
This is an example of the daily local record for September 28, 1941. About half an inch of precipitation was recorded in Albuquerque on this day. |
||||||||||||
|
This is an example of the NOAA Central Library Daily Weather Map for September 23, 1941. Observed rainfall is shaded in grey. |
The NOAA Central Library has a collection of historic U.S. daily surface weather maps for the period from 1871 to 2002. (More recent maps are available via the NOAA/NWS Weather Prediction Center.) Though the format changed during 1941, these surface maps feature temperatures, barometric pressure with analyzed isobars, wind velocity and direction, precipitation, synoptic features, and forecast discussions for various cities across the continental United States. The daily surface weather maps depict patterns at a synoptic scale. They also provide a written and visual analysis of the daily weather that occurred. These maps illustrate a limited number of weather observations in New Mexico, as well as observations and analyses across the continental United States. Examination of the daily maps indicates that a fairly high number days with precipitation in New Mexico during May and September, with associated surface low systems or moist upslope flow. |
||||||||||||
| Precipitation Distribution and Anomalies | |||||||||||||
|
|
The wet conditions can be examined in finer detail using single station precipitation data. The historic nature of the 1941 precipitation anomaly comes from multiple months with large precipitation totals and a high frequency of days with precipitation, as shown in the graph to the left. Daily precipitation for Albuquerque is shown as bars while daily normals are connected by the green line. Note that precipitation occurs throughout the year, thus the precipitation anomaly cannot be attributed to an active monsoon or a strong wintertime ENSO anomaly alone. On a long-term average, the rain gauge at the Albuquerque Weather Office (located at or near the Albuquerque airport) averages 24 days of precipitation greater than or equal to 0.1 inches in a year. Calendar years 1919 and 1992 (also wet years) reported 42 days of precipitation greater than or equal to 0.1 inches, while the year 1941 had 41 days of precipitation greater than or equal to 0.1 inches. Therefore, at Albuquerque, precipitation in calendar year 1941 was in the 99th percentile of the instrumental record. |
||||||||||||
|
A comparison of precipitation statistics for New Mexico and the observed values for 1941 is illustrated in the graph below. Box and whisker plots depict the characteristics of monthly precipitation while the light blue line represents the 1941 water year time series. |
|||||||||||||
|
In New Mexico, maximum precipitation generally occurs in July and August associated with the North American Monsoon System. April is the driest month and September experiences the greatest variability in precipitation for New Mexico - it can be exceptionally dry but also has the record values for the state. September 1941 is the wettest September on record, even overshadowing September 2013. A comparison of 1941 precipitation values to normal shows the two wettest months of 1941 statewide were September and May with large amounts of precipitation spread across both months. Nine out of 12 months in 1941 were anomalously wet (in the upper quartile) and three months (March, May, and September) were the maximum precipitation values for all water years from 1931 to 2012. November was the only month in 1941 with below average precipitation, while August and December were close to average. |
|
||||||||||||
| Temperature Distribution and Anomalies | |||||||||||||
|
1941 had below normal temperatures for all wet months, except for May. As expected, the departure from normal for the minimum and maximum temperatures throughout the year were below normal due to anomalously high frequency of cloudiness (89 cloudy days in 1941) and precipitation, indicating multiple low-pressure systems. The year 1941 had a cool spring and summer and overall was the coolest year since 1932. Summer temperatures are particularly well-correlated negatively with precipitation, but significant precipitation in 1941 is mainly noticed outside the summer precipitation season. The temperature departures were not dramatic, as the anomalies were mostly due to precipitation. |
|||||||||||||
| The Use of 20th Century Reanalyses | |||||||||||||
| Recall that 1941 did not have the advantage of analyses derived from upper-air data, so a determination of the anomalous patterns was difficult. The Earth Systems Research Laboratory created the 20th Century Reanalysis dataset as an alternative method of constructing upper-level atmospheric analyses. The reanalysis uses historical surface data that are assimilated by a modern atmospheric general circulation model with a consistent analysis scheme, essentially using the model to carry out a three-dimensional dynamical interpolation of sparse data using just surface weather data to anchor the analysis. The reanalysis product yields three-dimensional weather information for an era in which there are no direct upper air measurements. The 20th Century Reanalysis Dataset was used extensively in this study, with several examples included here. Additional variables at various levels were also examined, but are not included in this summary. | |||||||||||||
 |
|||||||||||||
|
The images above depict mid-atmospheric pressure anomalies (500 mb geopotential heights) generated by the 20th Century Reanalysis dataset for four major wet periods in 1941. The anomalies for three of the events, 1-5 May 1941, 21-25 May 1941 and 20-23 September 1941 (top left, top right and bottom left), indicate an amplified pattern with lower than average heights west of New Mexico associated with upper level troughs. The fourth event, 27-29 September 1941 (bottom right) show anomalies associated with fairly strong upper level high pressure east of New Mexico, a pattern that can support a south to north transport of moisture into New Mexico. |
|||||||||||||
 |
The graphic to the left shows anomalies of low level moisture (2 meter specific humidity) for the month of May 1941. Note the swath of above normal moisture stretching from northern Mexico through eastern New Mexico and west Texas to the northern Plains while much of the eastern U.S. is dry.
|
||||||||||||
 |
|||||||||||||
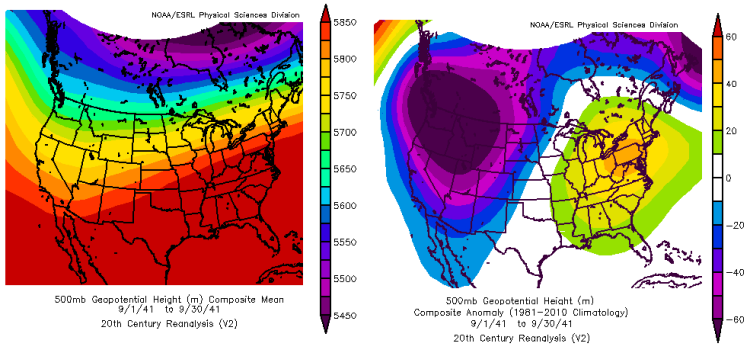
| The 500mb geopotential height composite mean (left) and composite anomaly (right) for September 1941 depict a mean trough position over the western states with well below normal heights and higher than normal pressure to the east. Forcing associated with four distinct upper level troughs, with the strongest system during the September 27-29 event, were identified. | |||||||||||||
| In conclusion, the composite and anomaly maps for the May and September periods help to identify the patterns associated with the extreme precipitation events that affected New Mexico. These events had different sources of moisture and different storm tracks, and thus were not meteorologically correlated events. This indicates that there is no single common cause for the May and September anomalies, and it is likely merely a coincidence that these two positive precipitation anomaly months occurred in the same year. | |||||||||||||
| The Effect of Tropical Storm Remnants | |||||||||||||
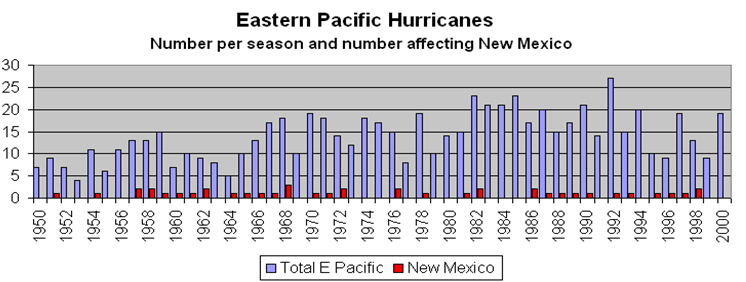
| New Mexico is not impacted by land falling hurricanes, but the moisture and associated circulations of tropical storms and hurricanes can result in heavy precipitation events. The majority of tropical storms that affect New Mexico originate in the Eastern Pacific and are associated with a deep trough west of the state that helps to steer the remnant circulations and moisture over New Mexico. In the chart below, the number of Eastern Pacific Hurricanes each season from 1950 through 2000 is plotted in blue, with the number that affected New Mexico plotted in red. Approximately every 3 out of 5 years, New Mexico receives heavy precipitation and often flooding from tropical storm remnants. | |||||||||||||
 |
|||||||||||||
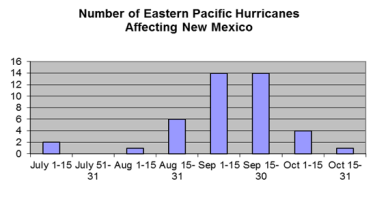 |
Tropical remnants affecting New Mexico are most common in September with equal chances of occurrence in the first and latter parts of the month. Tropical storm records for the eastern Pacific are not available for 1941, but historic records indicate that three tropical storms tracked along the west coat of Mexico in September of 1941. One broke a record for low barometric pressure and another caused considerable damage on the Baja Peninsula. It is possible that precipitation in September 1941 was enhanced by tropical storm remnants. |
||||||||||||
| The Impact of Climate Variability | |||||||||||||
| There are causal mechanisms that have been identified to explain and predict some observed climate anomalies and variability. El Niño-Southern Oscillation (ENSO) is one of the most important coupled ocean-atmosphere phenomena associated with global climate variability on interannual time scales, typically defined by changes in tropical Pacific sea surface temperatures. The Pacific Decadal Oscillation (or PDO) is a term used to describe the multi-decadal variability of sea surface temperature anomalies in the northern Pacific. The changes in sea surface temperatures in the Pacific not only affect the distribution and strength of precipitation in the United States, but also result in modified atmospheric circulations that can change the positions of the jet stream and storm tracks in the Northern Hemisphere. El Niño events are associated with higher than normal precipitation for New Mexico, the combination of a positive PDO value with a moderate El Niño can enhance the relationship. More details regarding these relationships are available here. | |||||||||||||
 |
 |
||||||||||||
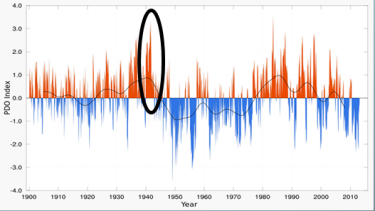
| As shown in the figure above and to the left, 1941 was considered to be a strong El Niño event and even a top 10 El Niño event of the 20th Century based on both strength and duration. Although the El Niño event of 1941 was ranked as strong, analyses of the precipitation anomalies (not shown here) indicate that only moderate ENSO forcing was present that year. The year 1941 was centered within a longer El Niño event from 1939-1942, embedded within an extended period of low ENSO activity. PDO values from 1900 through 2014 are shown in the figure above and to the right, and the highest value in this period occurred in 1941. The only other year that comes close to the 1941 PDO value of +1.99 is the year 1987 (another wet year) with an annual average PDO index of +1.82. Together, ENSO/PDO could tilt the odds toward above normal precipitation, but is not sufficient to explain the extreme1941 precipitation anomaly. | |||||||||||||
| An "Eye Witness" Prospective | |||||||||||||
|
A recent visitor to NWS Albuquerque mentioned that he had lived in New Mexico during 1941 and offered to share the following description. "As a 10-year old, I was lucky to be able to spend the summer of 1941 on a ranch in the Sacramento Mountains of Lincoln County. The ranch house was nine miles from the nearest paved road. Our south fence was the Lincoln County line - across the fence was Otero county and the beautiful Mescalero Apache reservation. Snow and rain had been good all winter and spring, and the summer monsoon brought spectacular thunderstorms. All plants were growing and blooming in splendid fashion, including the cacti. Stock tanks with dirt dams were overflowing so we could go swimming if we accepted the cold water and the floating cow chips. Grass was so tall in some meadow areas that we could not see the white-face calves even when they were standing. Deep mud meant that the ranch pickup could not get us into town for weeks at a time. Two bad-tempered old jersey cows provided milk and cream so we make ice-cream with hail from the tin roof, the only ice available on a ranch with no electricity. A sensational time in a gorgeous place. Our nearest "town" with more than one house was the tiny Mescalero village of Whitetail, 8 miles away. I understand that Whitetail holds the all-time New Mexico record for total precipitation in one year: something incredible like 60 inches in that year 1941." (NWS Comment: The highest observed annual precipitation total for New Mexico is 62.45 inches in 1941.) |
|||||||||||||
| Summary | |||||||||||||
|
|
|||||||||||||
| Acknowledgements | |||||||||||||
This web feature is a summary of Sharon Sullivan's undergraduate thesis "The 1941 Project: A Meteororological Reanalysis Investigation into an Abnormal Year of Precipitation" completed at the University of New Mexico under the guidance of Dr. David Gutzler of the Department of Earth & Planetary Sciences. |
|||||||||||||


