 |
||||
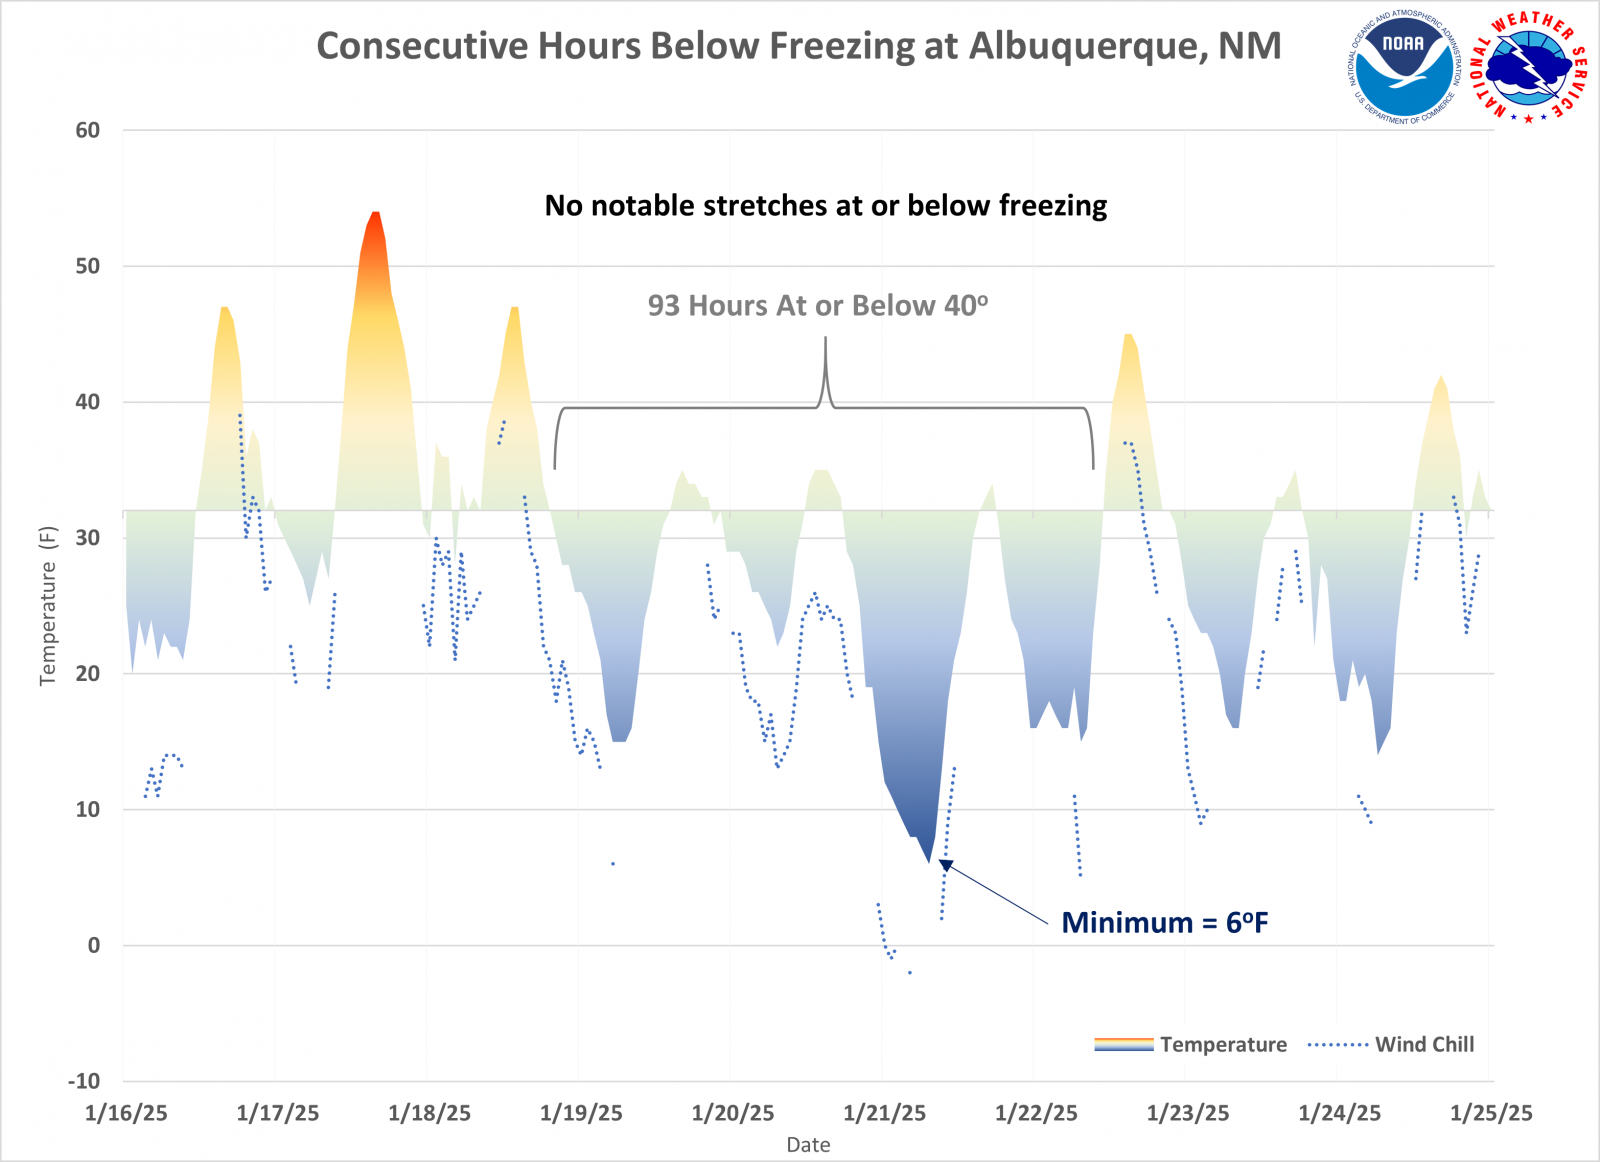
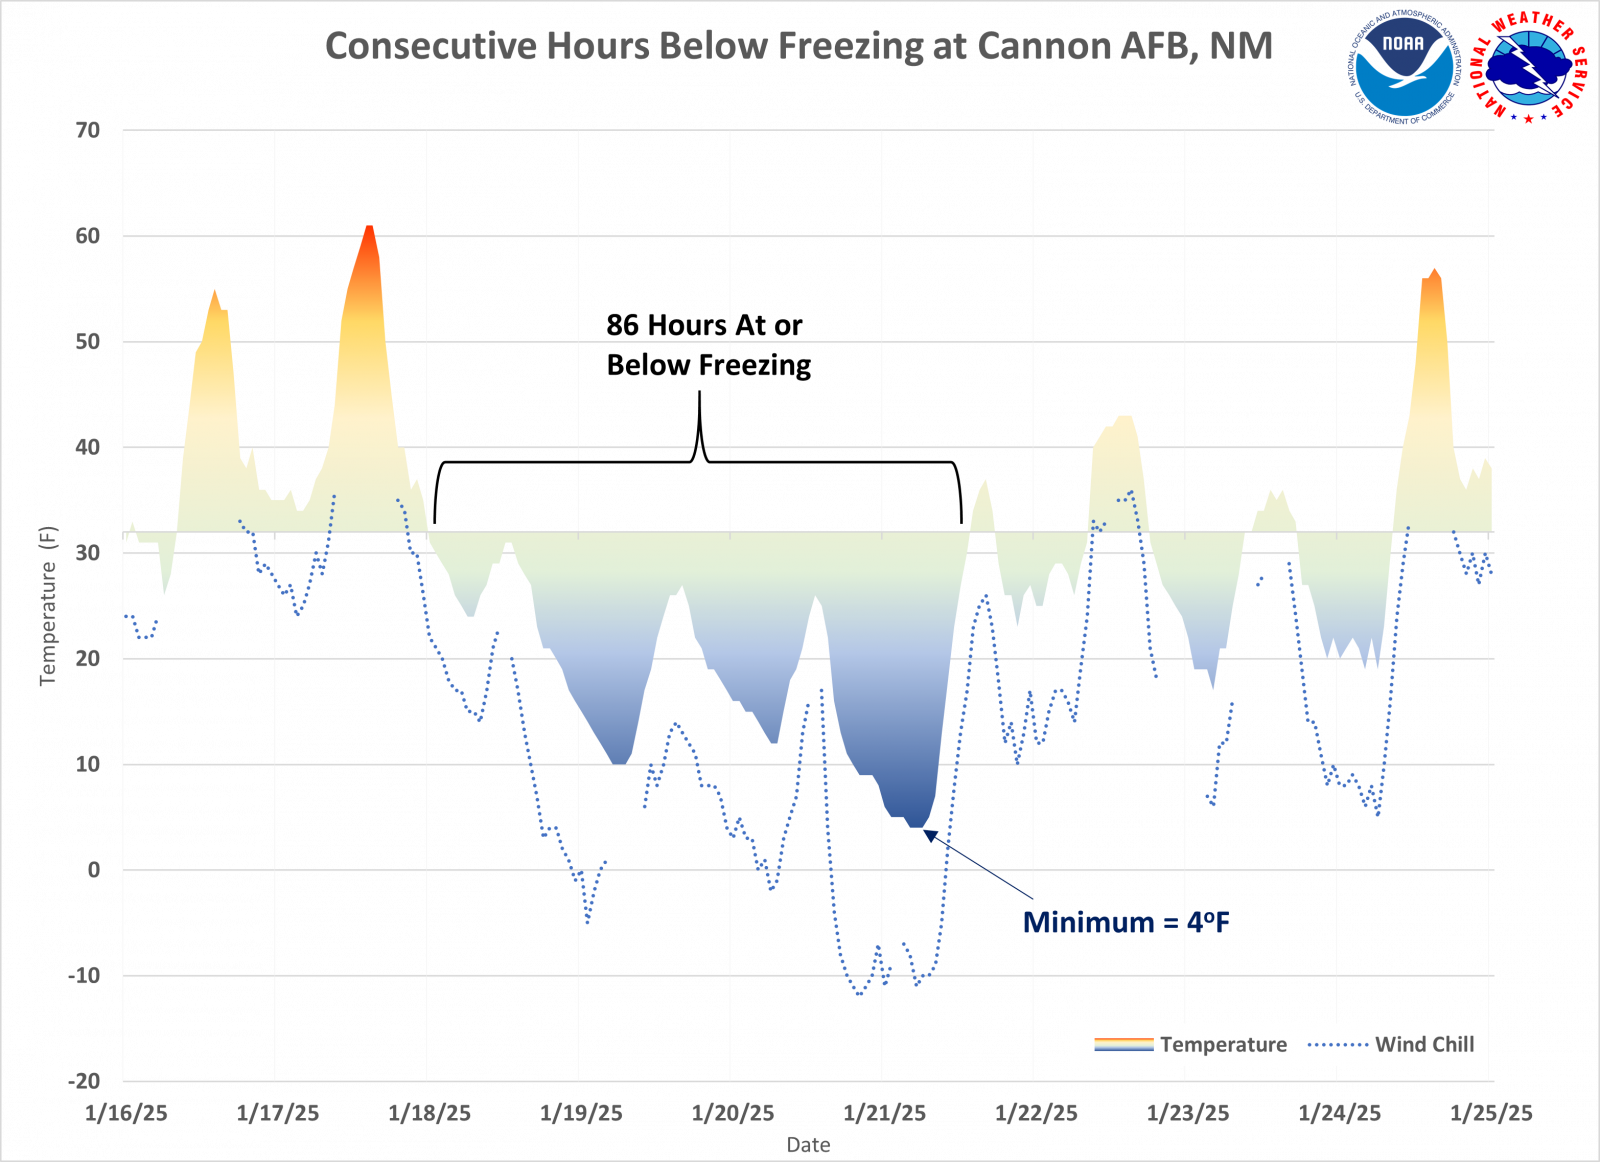
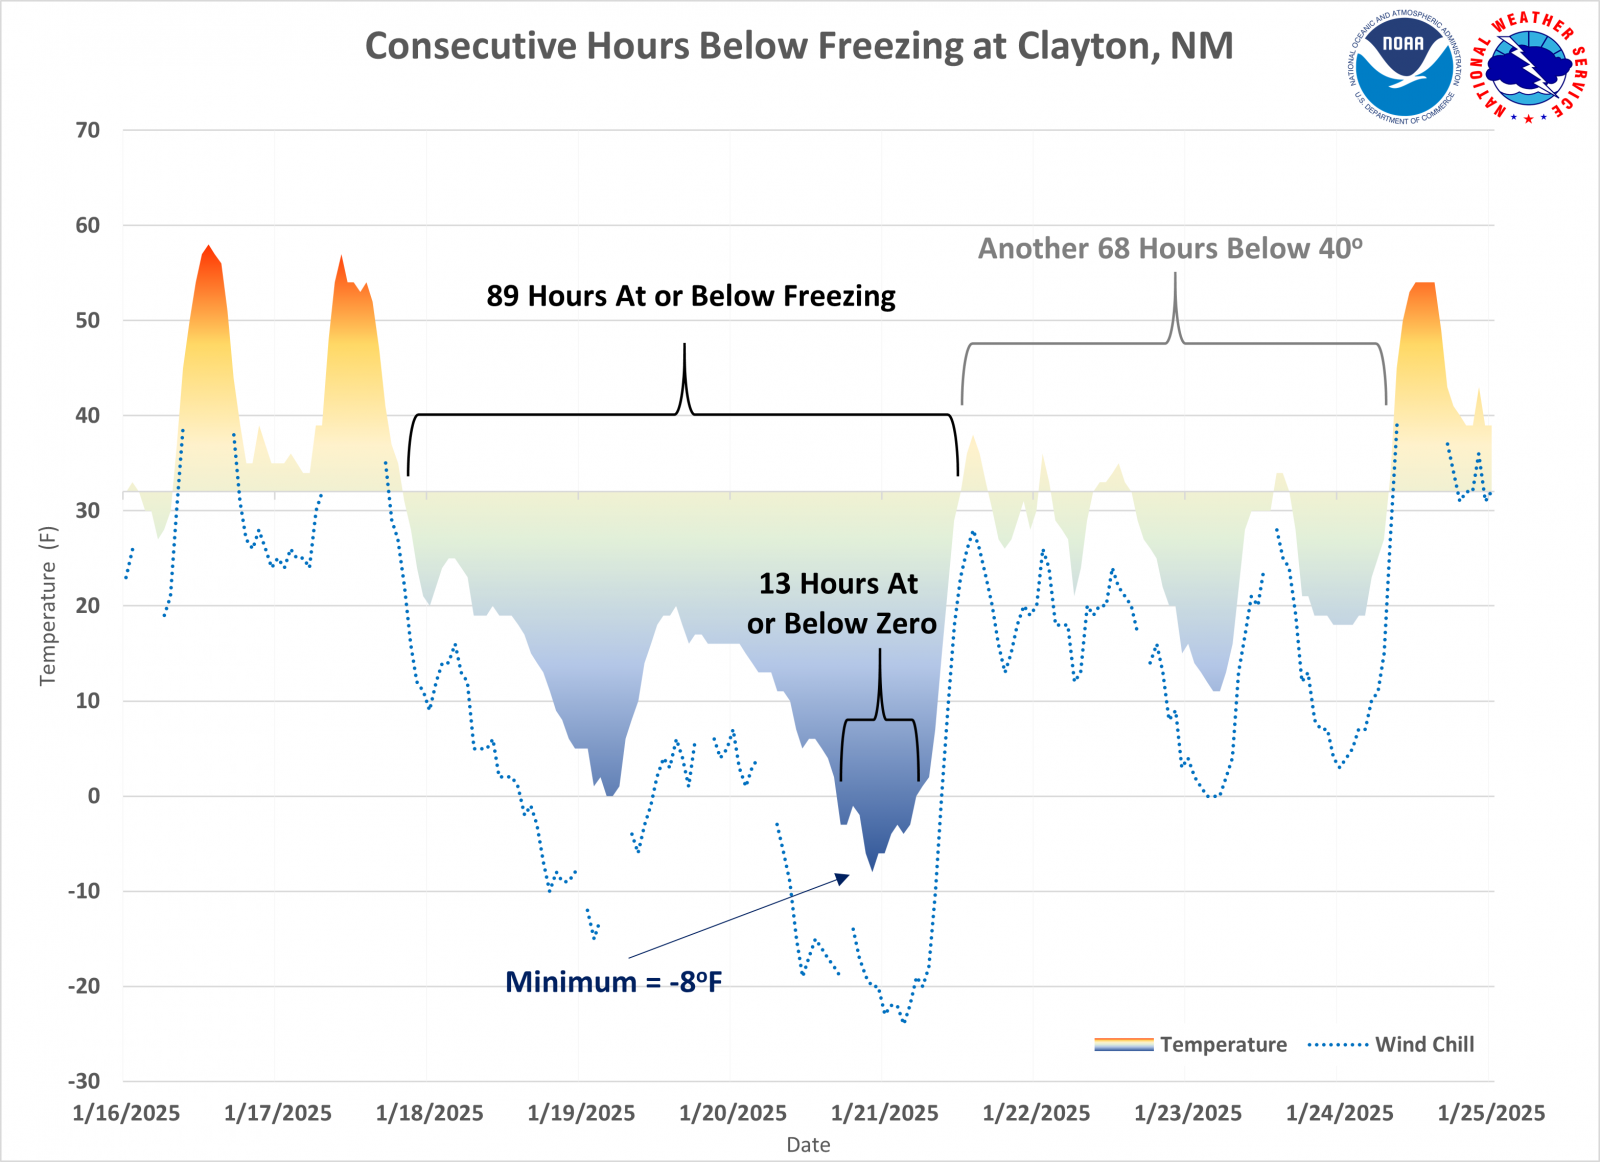
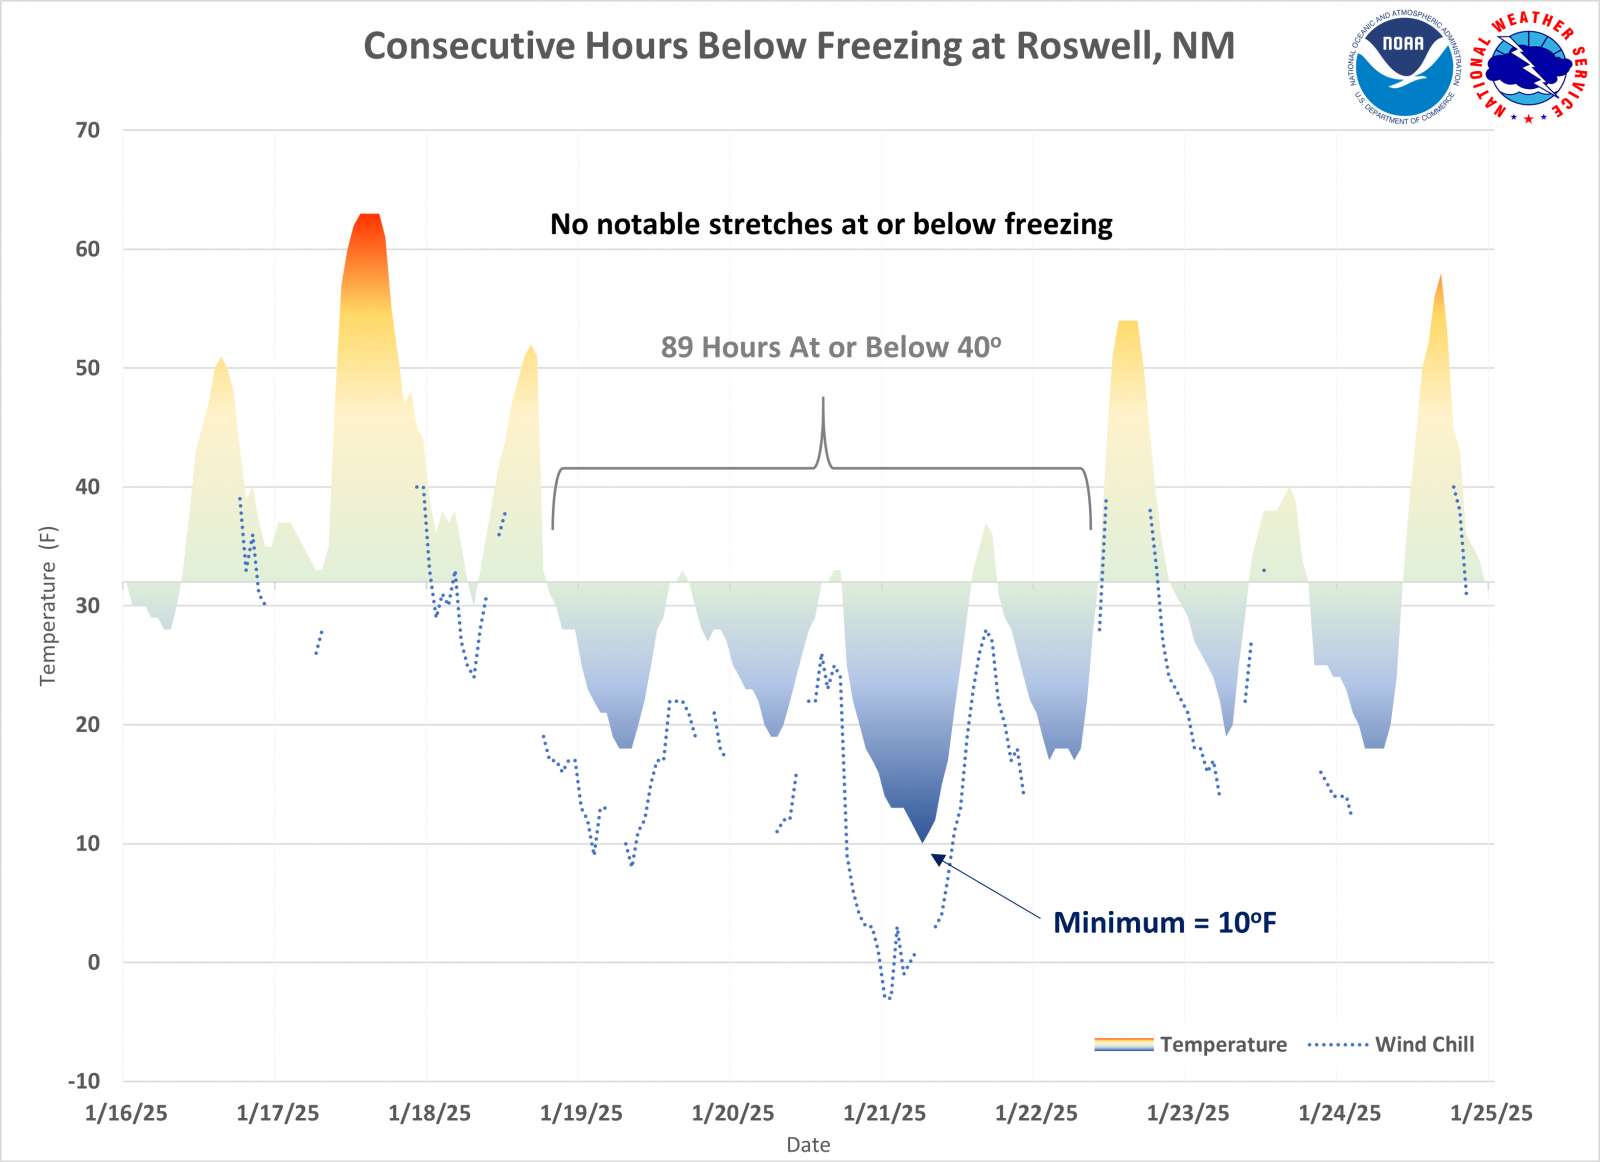
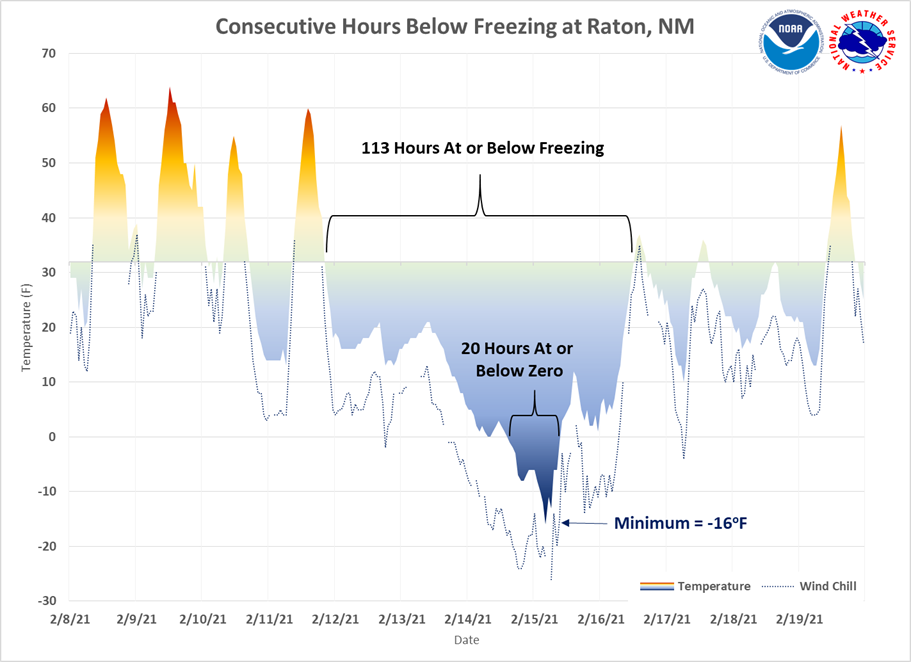
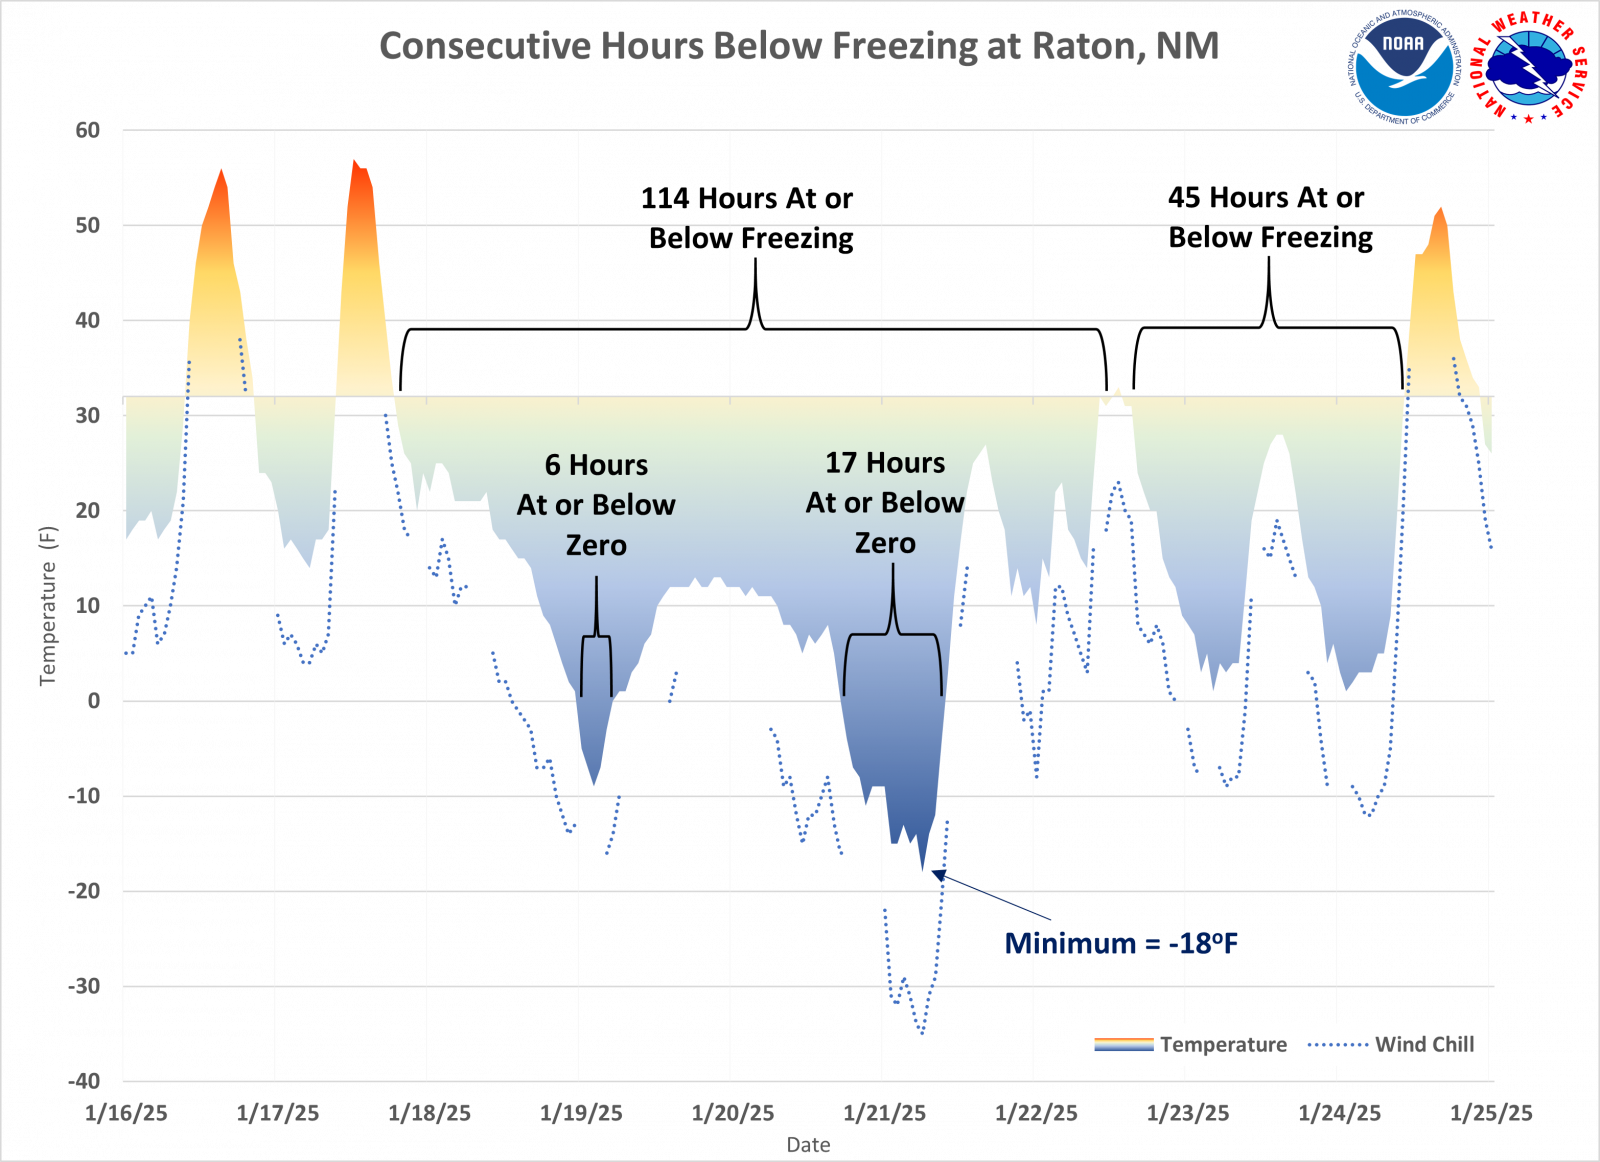
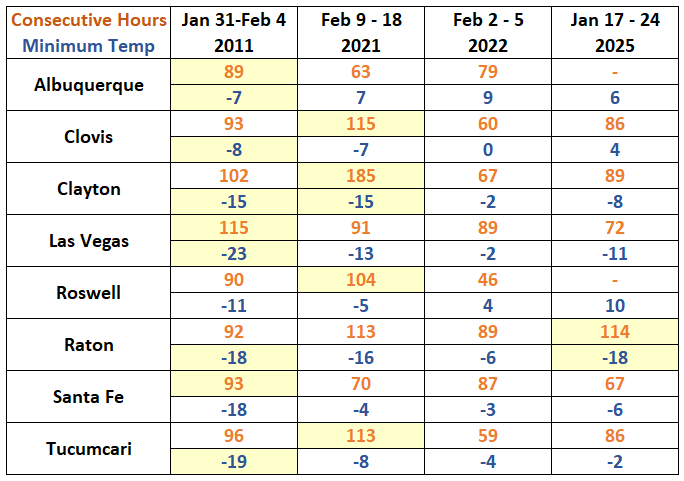
| Portions of central and eastern New Mexico have seen several events where the duration of sub-freezing temperatures have been significant. Several of these events occurred since 2020, while the first, and arguably the most impactful event occurred in early February of 2011. During this event, arctic air spread from northeast NM south and west, reaching both the Mexico and Arizona borders. This airmass was the coldest of the events described here and resulted in not only record low temperatures, but also impacts in the form of frozen and damaged pipes. In February of 2021, the duration of the sub-freezing temperatures was longer for much of eastern New Mexico, but the temperatures did not get as cold (except for Clayton). In 2022, the duration of freezing temperatures was longer at Albuquerque and Santa Fe, but the temperatures were not as cold as either the 2011 or 2021 events. In 2024, arctic air just nudged into northeast NM, resulting in a long duration sub-freezing event at Clayton, but not elsewhere. In January 2025, arctic air again spilled into northeast NM and eventually toward the Rio Grande Valley and as far south as Roswell. However, the really cold air did not linger in Albuquerque and Roswell like it did in other locations. Thus, there was no significant time period that was subfreezing, though it did get colder in Albuquerque than both the 2021 and 2022 events. Notably, Raton in 2025 got as cold as it did in 2011 and had a longer duration of freezing temperatures than any of the other events. The following graphs show the consecutive hours below freezing for each event for select New Mexico locations. | ||||
| Albuquerque | 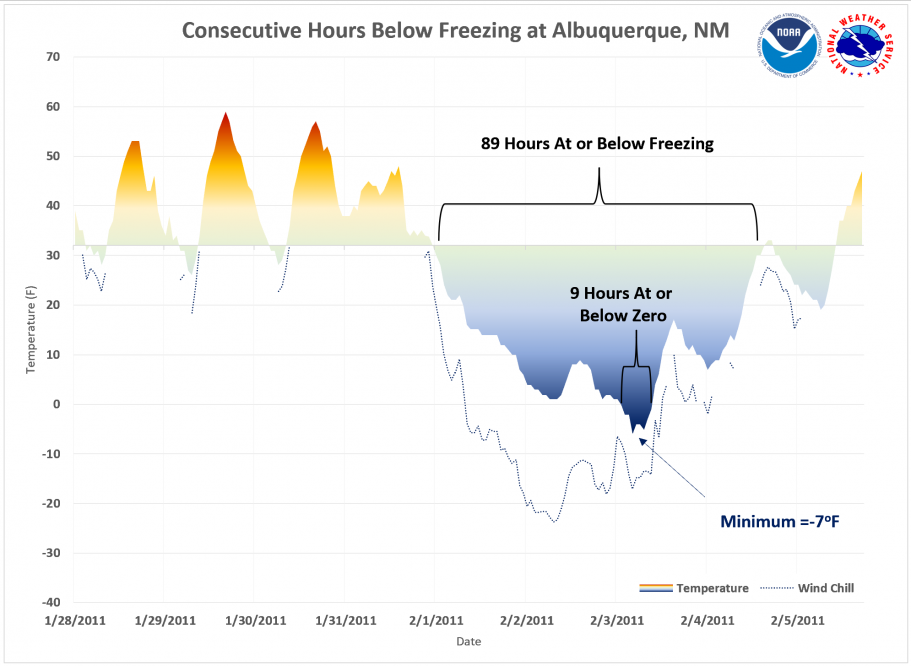 |
 |
 |
 |
| 2011 | 2021 | 2022 | 2025 | |
| Clovis | 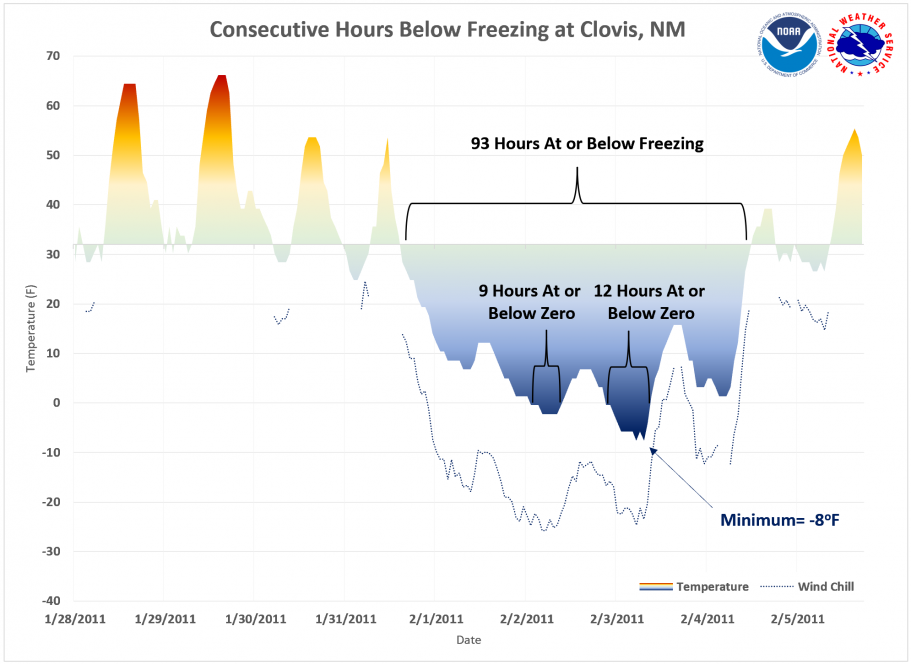 |
 |
 |
 |
| 2011 | 2021 | 2022 | 2025 | |
| Clayton | 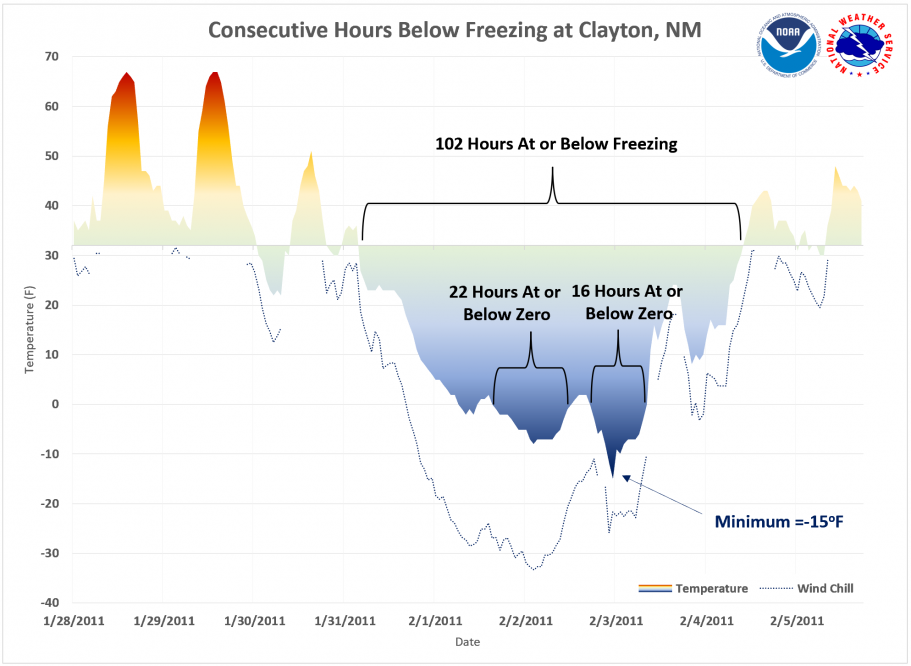 |
 |
 |
 |
| 2011 | 2021 | 2022 | 2025 | |
| Las Vegas | 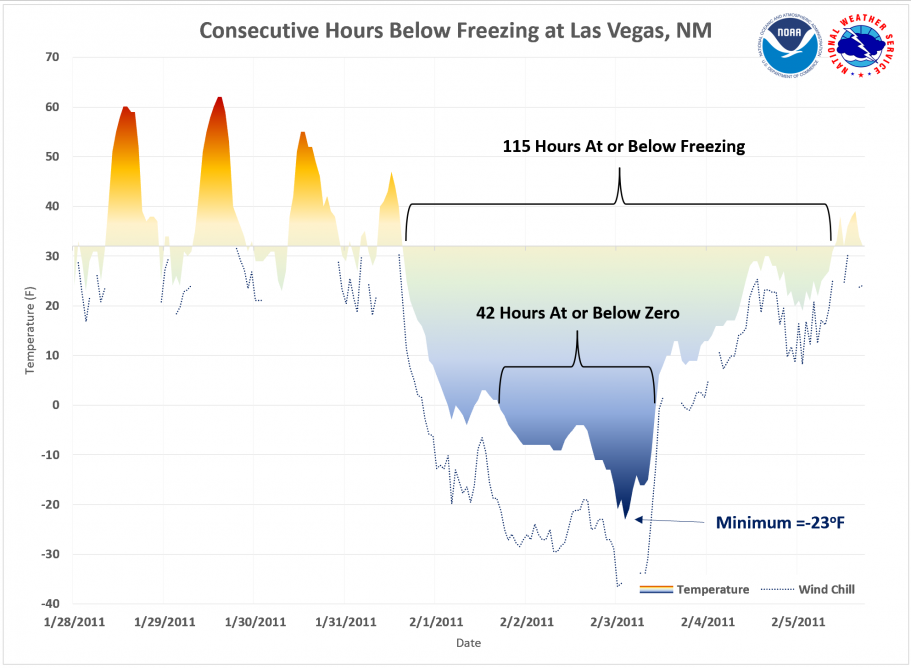 |
 |
 |
 |
| 2011 | 2021 | 2022 | 2025 | |
| Roswell | 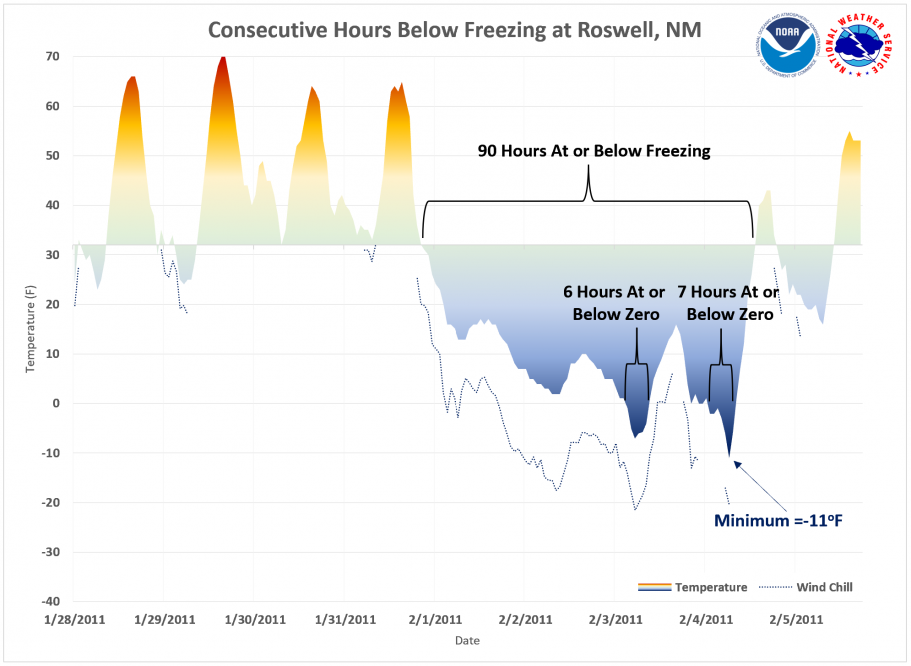 |
 |
 |
 |
| 2011 | 2021 | 2022 | 2025 | |
| Raton | 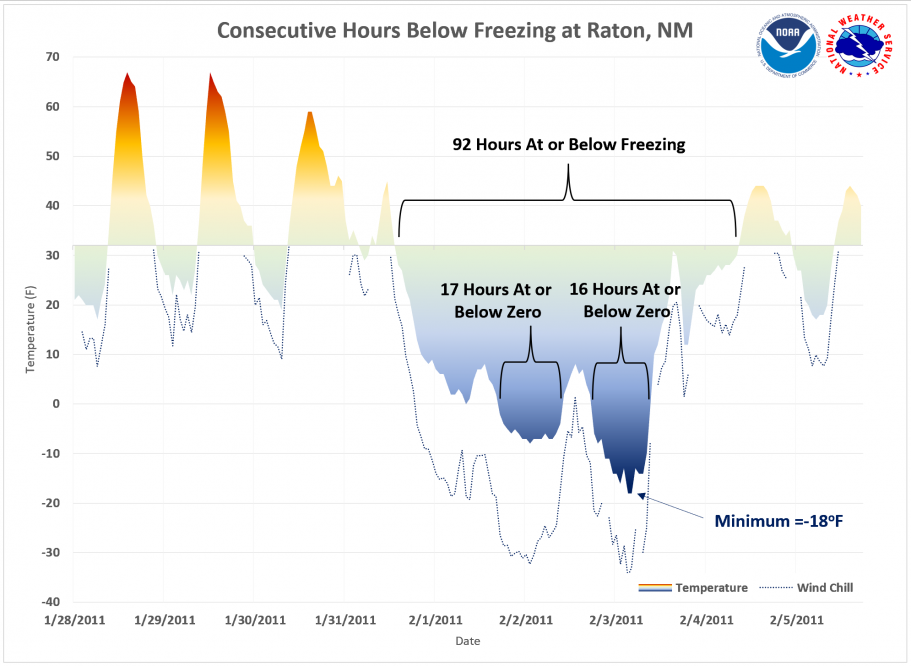 |
 |
 |
 |
| 2011 | 2021 | 2022 | 2025 | |
| Santa Fe | 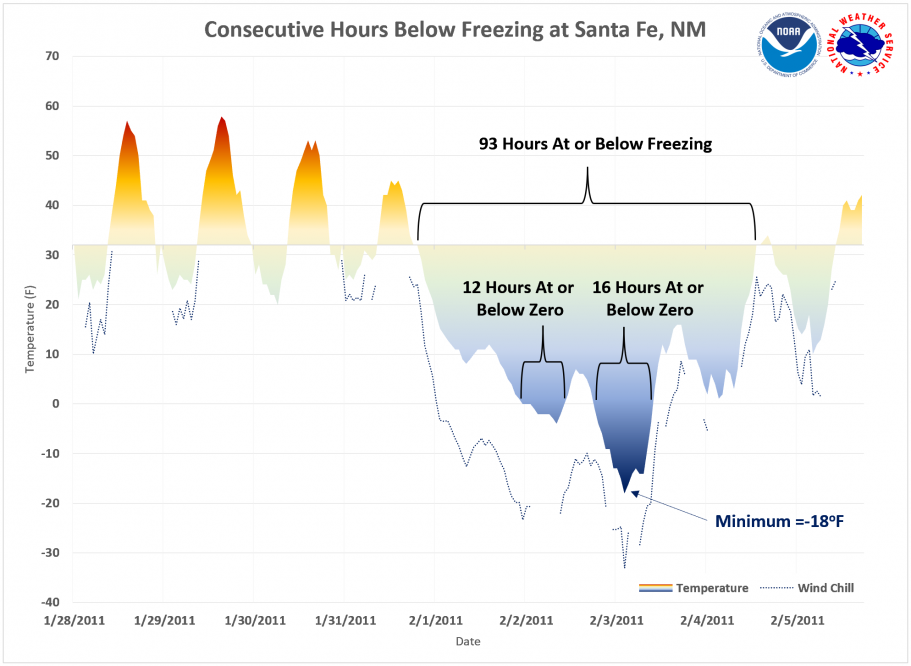 |
 |
 |
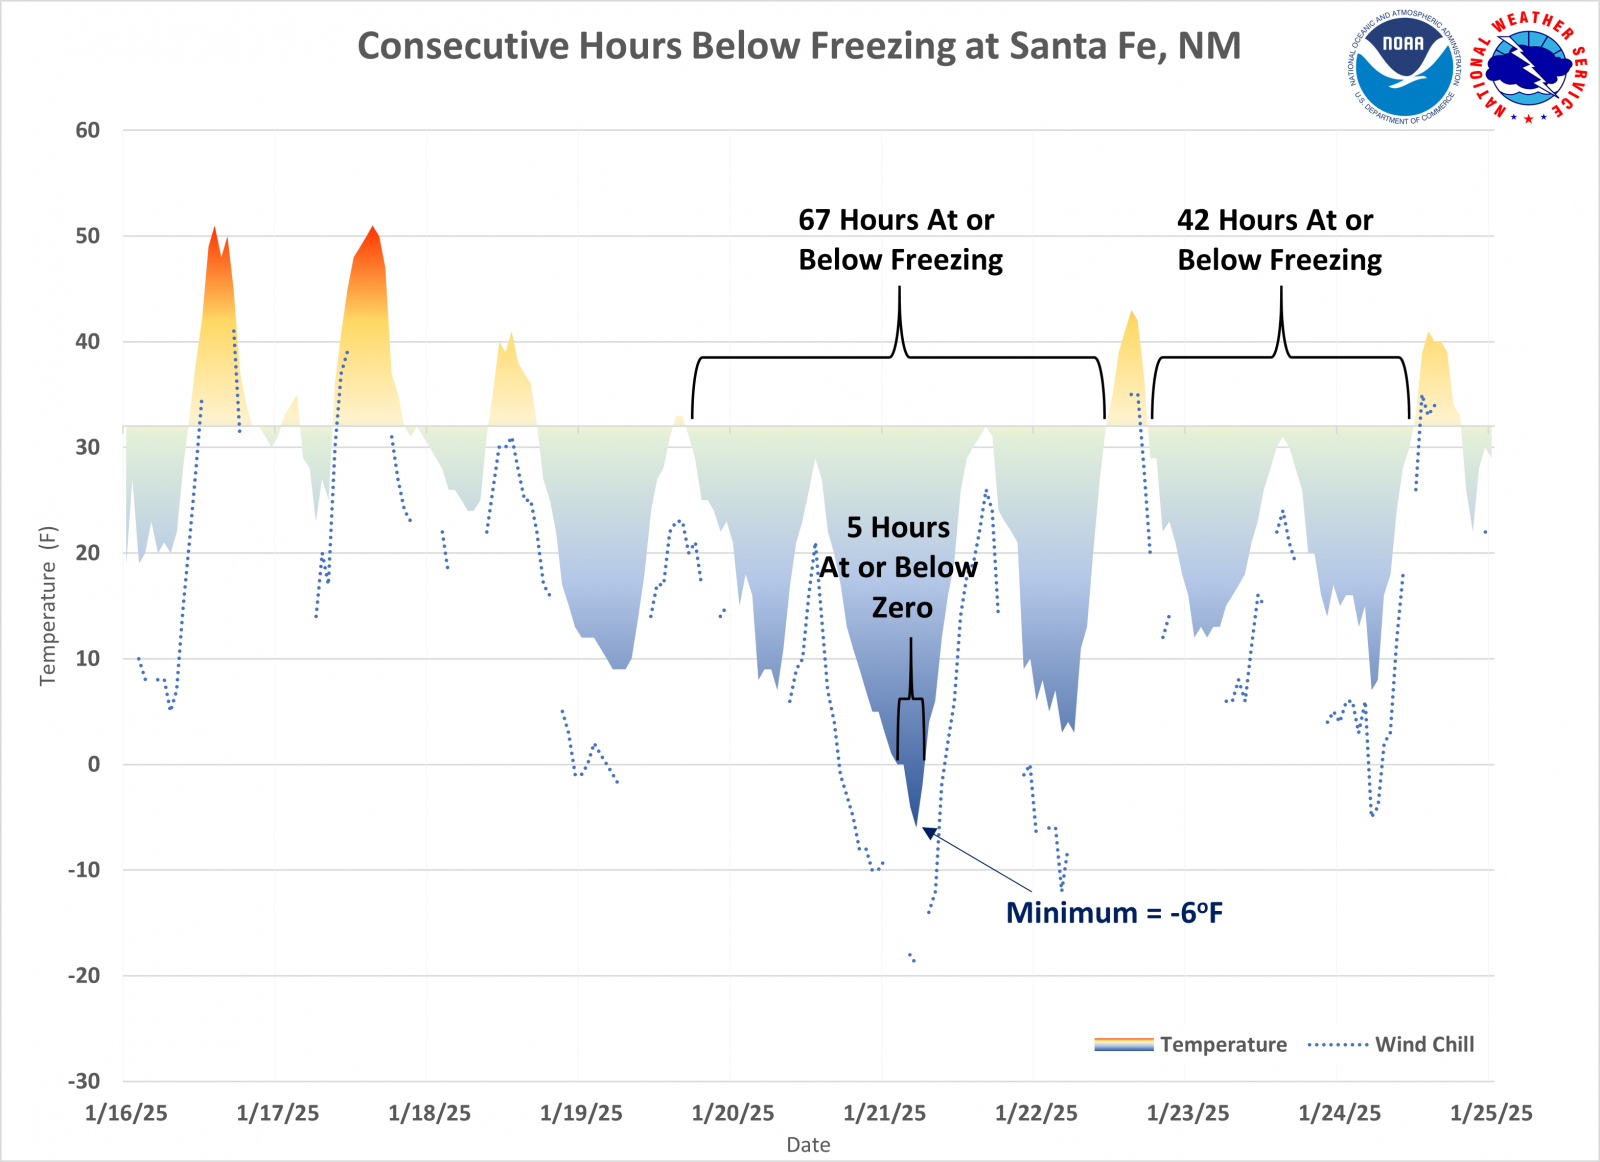 |
| 2011 | 2021 | 2022 | 2025 | |
| Tucumcari | 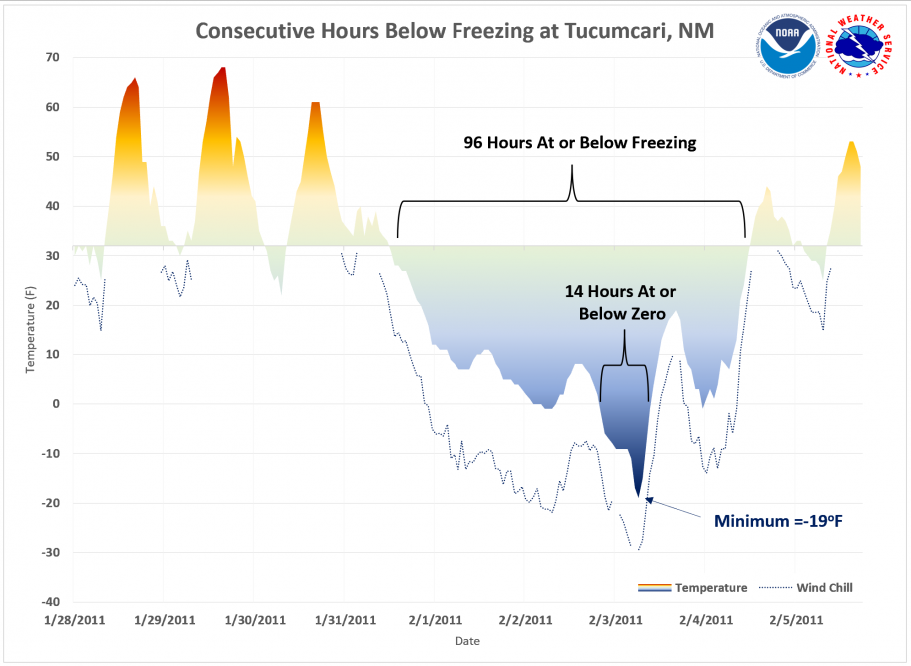 |
 |
 |
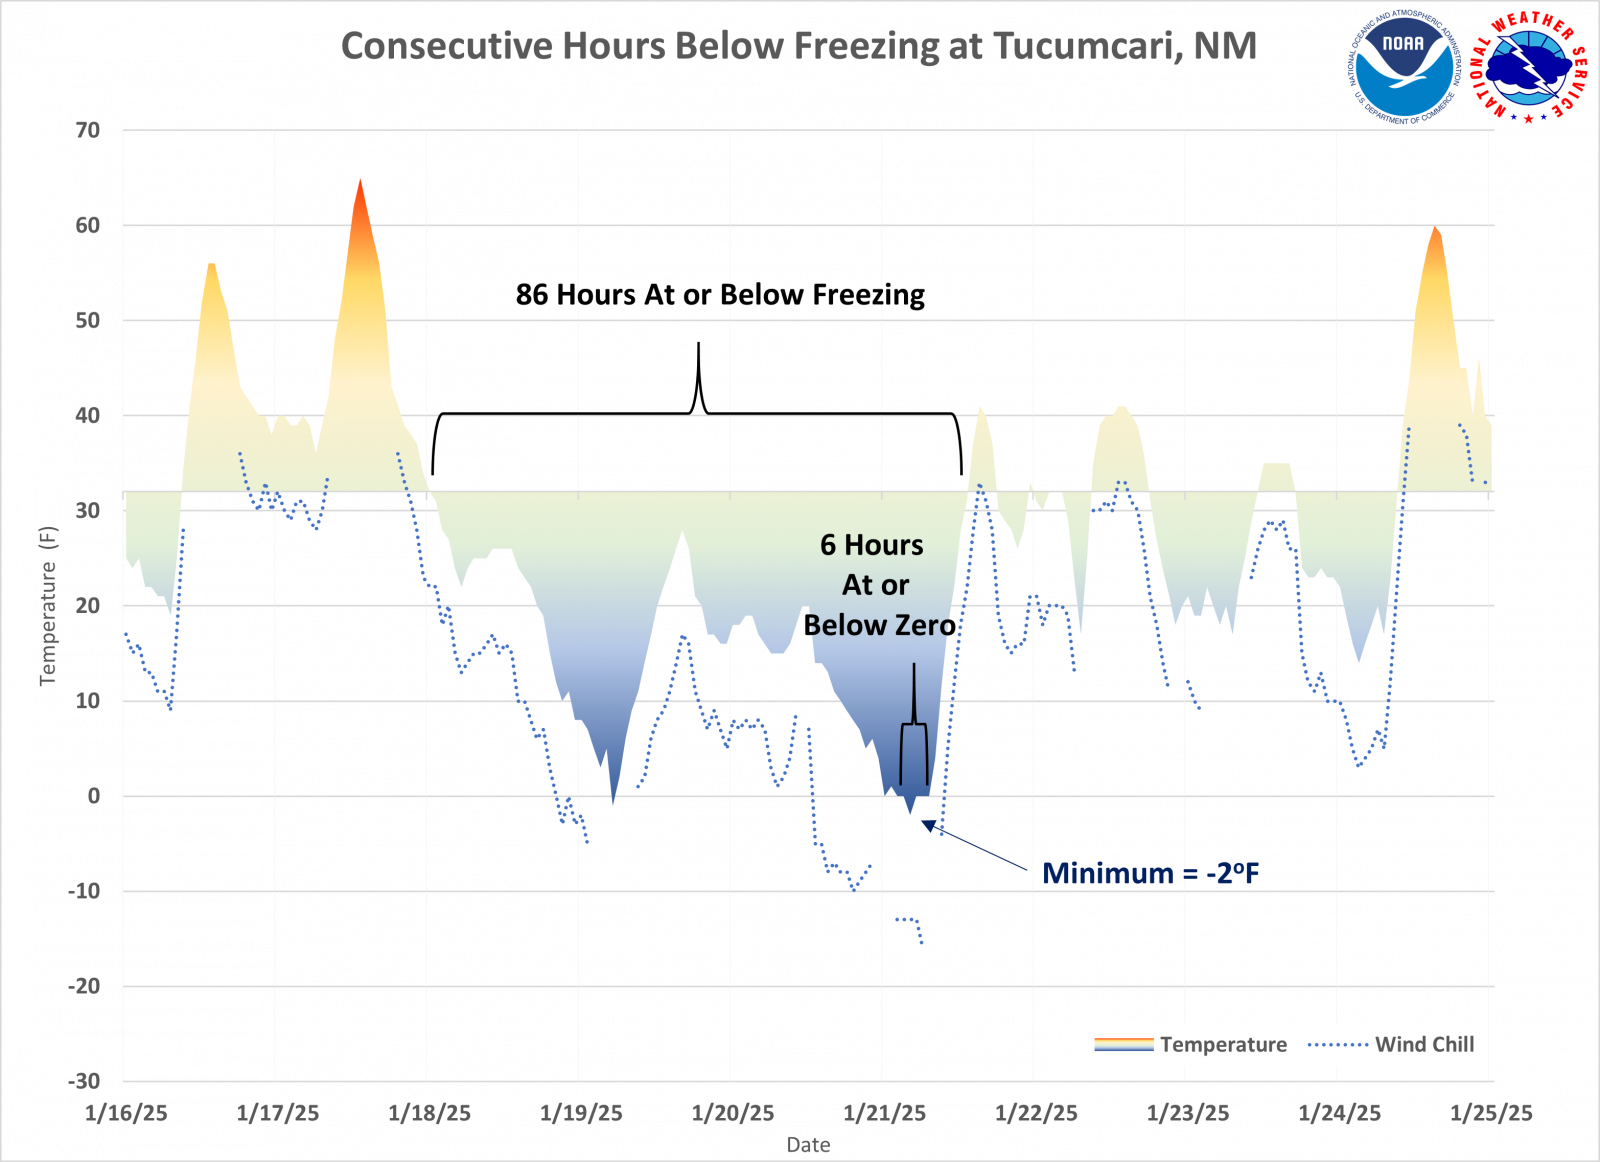 |
| 2011 | 2021 | 2022 | 2025 | |
| The table below shows the total number of consecutive hours and the minimum temperature that occurred for each time frame. Yellow highlighted boxes show which event had the greatest consecutive hours or the lowest temperature. |
||||
 |
||||