
A storm system will continue to produce widespread showers and thunderstorms as it progresses eastward across the central U.S. into the Northeast through the weekend. There are risks of severe thunderstorms and excessive rainfall on Saturday from the Ozarks into the mid-Mississippi River Valley with potential for damaging winds, large hail, tornadoes, and flash flooding. Read More >

...Highlights of 2021...

| Element | Jan | Feb | Mar | Apr | May | Jun | Jul | Aug | Sep | Oct | Nov | Dec | Year |
| Average High | 33.7 | 35.2 | 50.2 | 54.4 | 65.1 | 79.2 | 91.1 | 87.1 | 79.7 | 61.7 | 39.8 | 22.7 | 58.3 |
| Mean High (1991-2020 Normals) | 28.7 | 35.5 | 49.2 | 58 | 67.4 | 78.9 | 87.9 | 85.7 | 74.4 | 59.2 | 42.7 | 29.6 | 58.1 |
| Average Low | 8.6 | 9.1 | 20.6 | 27.1 | 39.9 | 47.8 | 56.5 | 54.8 | 46.5 | 31.6 | 15 | -1.7 | 29.7 |
| Mean Low (1991-2020 Normals) | 4.2 | 9.6 | 22.2 | 30.5 | 40.3 | 48.5 | 54.8 | 52.2 | 42.5 | 30.4 | 17.1 | 5.7 | 29.8 |
| Average Temperature | 21.3 | 22.1 | 35.4 | 40.8 | 52.5 | 63.5 | 73.8 | 70.9 | 62.9 | 46.7 | 27.4 | 10.5 | 44.0 |
| Mean Average Temperature (1991-2020 Normals) | 16.4 | 22.5 | 35.7 | 44.2 | 53.8 | 63.7 | 71.3 | 69 | 58.4 | 44.8 | 29.9 | 17.6 | 43.9 |
| Departure from Normal | 4.9 | -0.4 | -0.3 | -3.4 | -1.3 | -0.2 | 2.5 | 1.9 | 4.5 | 1.9 | -2.5 | -4.1 | 0.1 |
| Rank: Coldest to Warmest 103 years of record (P.O.R 12/1918-2022) |
81 | 44 | 63 | 16 | 34 | 58 | 92 | 94 | 100 | 72 | 38 | 15 | 61 |
| Highest Daily Maximum | 54 | 58 | 72 | 75 | 85 | 94 | 100 | 98 | 98 | 76 | 64 | 45 | 100 |
| Date of Occurrence | 13 | 10 | 27,28 | 22 | 27 | 18 | 18 | 11 | 5 | 21 | 2 | 2,12 | 7/18 |
| Lowest Daily Minimum | -5 | -14 | -13 | 9 | 27 | 37 | 49 | 47 | 36 | 17 | -11 | -39 | -39 |
| Date of Occurrence | 6 | 23 | 10 | 13 | 22 | 1,21 | 2 | 29 | 11 | 28 | 30 | 22 | 12/22 |
| Number of Days with: | |||||||||||||
| Maximum >= 90° | 0 | 0 | 0 | 0 | 0 | 7 | 21 | 8 | 9 | 0 | 0 | 0 | 45 |
| Maximum <= 32° | 11 | 10 | 7 | 0 | 0 | 0 | 0 | 0 | 0 | 0 | 7 | 25 | 60 |
| Minimum <= 32° | 31 | 28 | 28 | 23 | 3 | 0 | 0 | 0 | 0 | 17 | 29 | 31 | 190 |
| Minimum <= 0° | 4 | 10 | 4 | 0 | 0 | 0 | 0 | 0 | 0 | 0 | 1 | 16 | 35 |
| Record Highs Set or Tied | 0 | 0 | 2 | 0 | 0 | 0 | 1 | 0 | 2 | 0 | 0 | 0 | 5 |
| Record Lows Set or Tied | 0 | 0 | 2 | 0 | 1 | 0 | 0 | 0 | 0 | 0 | 0 | 0 | 3 |
| * Multiple day occurrence | |||||||||||||
Temperature Ranks and Records:
Daily Records:
Max:
March: 67 on the 2nd and 75 on the 28thJuly: 100 on the 18thSeptember: 95 on the 2nd and 98 on the 5th
Min:
March: -20 on the 10th and -14 on the 11th
May: 27 on the 22nd
| Top Ten Warmest July's on Record | |||||||
| Rank | Year | Average Temperature °F | |||||
| 1 | 2006 | 76.2 | |||||
| 2 | 2012, 2007 | 76.1 | |||||
| 3 | 2003 | 75.3 | |||||
| 4 | 2002 | 74.9 | |||||
| 5 | 2021, 2001 | 74.8 | |||||
| 6 | 2013 | 74.4 | |||||
| 7 | 1954 | 74.2 | |||||
| 8 | 2005 | 74.1 | |||||
| 9 | 2022 | 73.8 | |||||
| 10 | 2011 | 73.5 | |||||
| Top Ten Warmest August's on Record | |||||||
| Rank | Year | Average Temperature °F | |||||
| 1 | 2003 | 73.8 | |||||
| 2 | 2013/2000 | 73.0 | |||||
| 3 | 2001 | 72.9 | |||||
| 4 | 2012 | 71.9 | |||||
| 5 | 2020/2011 | 71.8 | |||||
| 6 | 2007 | 71.6 | |||||
| 7 | 1922 | 71.3 | |||||
| 8 | 1999 | 71.0 | |||||
| 9 | 2022/1983 | 70.9 | |||||
| 10 | 1929 | 70.7 | |||||
| Top Ten Warmest September's on Record | |||||||
| Rank | Year | Average Temperature °F | |||||
| 1 | 2015 | 63.6 | |||||
| 2 | 1998 | 63.5 | |||||
| 3 | 1990 | 63.4 | |||||
| 4 | 2022 | 62.9 | |||||
| 5 | 2009, 2001 | 62.3 | |||||
| 6 | 1938 | 62.2 | |||||
| 7 | 1948 | 62.1 | |||||
| 8 | 1940 | 62.0 | |||||
| 9 | 1963 | 61.8 | |||||
| 10 | 2021 | 61.6 | |||||
| Warmest Years on Record (100 Years) | |||||||
| Rank | Year | Average Temperature °F | |||||
| 1 | 2012 | 48.5 | |||||
| 2 | 2021 | 47.1 | |||||
| 3 | 2006, 1999 | 47.0 | |||||
| 5 | 1934 | 46.9 | |||||
| 6 | 2007 | 46.5 | |||||
| 7 | 2005, 1981 | 46.3 | |||||
| 9 | 1954 | 46.2 | |||||
| 10 | 2015 | 45.9 | |||||
| 40 | 2022 | 40.4 | |||||
| Top Ten Coldest Years on Record | |||||||
| Rank | Year | Average Temperature °F | |||||
| 1 | 1993 | 38.8 | |||||
| 2 | 1924 | 39.5 | |||||
| 3 | 1984, 1944 | 39.7 | |||||
| 5 | 1978 | 40.1 | |||||
| 6 | 1985 | 40.3 | |||||
| 7 | 1968, 1929 | 40.5 | |||||
| 9 | 1975 | 40.8 | |||||
| 10 | 1986, 1932 | 41.0 | |||||
| 61 | 2022 | 44.0 | |||||
 |
 |
| Average Annual Temperature for Period of Record - Click on Graph to Enlarge | |
 |
Learn more about the National Weather Service's efforts to build a Weather-Ready Nation! |

| Element | Jan | Feb | Mar | Apr | May | Jun | Jul | Aug | Sep | Oct | Nov | Dec | Year |
| Total (inches) | 0.24 | 0.37 | 0.89 | 1.44 | 3.55 | 0.4 | 0.1 | 0.7 | 1.45 | 0.54 | 0.88 | 0.86 | 11.42 |
| Mean Precipitation (1991-2020 Normals) |
0.35 | 0.43 | 0.71 | 1.31 | 1.98 | 1.09 | 0.70 | 0.45 | 0.80 | 0.93 | 0.44 | 0.31 | 9.5 |
| Departure from Normal | -0.11 | -0.06 | 0.18 | 0.13 | 1.57 | -.69 | -0.6 | 0.25 | 0.65 | -0.39 | 0.44 | 0.55 | 1.92 |
| Percent of Normal | 69 | 86 | 125 | 110 | 179 | 37 | 14 | 156 | 181 | 58 | 200 | 277 | 120 |
|
Rank - Driest to Wettest |
63 | 74 | 87 | 72 | 89 | 24 | 15 | 79 | 91 | 43 | 90 | 99 | 90 |
 |
|||||||||||||
| Greatest 24-HR Total | 0.18 | 0.22 | 0.21 | 0.54 | 1.19 | 0.31 | 0.05 | 0.25 | 0.54 | 0.25 | 0.26 | 0.50 | 1.19 |
| Dates of Occurrence | 6 | 15-16 | 8 | 23 | 31 | 1 | 28 | 25 | 16 | 24 | 29 | 13 | 5/31 |
| Number of Days with: | |||||||||||||
| Precipitation >= 0.01 | 3 | 5 | 8 | 8 | 8 | 5 | 4 | 9 | 7 | 9 | 7 | 4 | 72 |
| Precipitation >= 0.10 | 1 | 2 | 5 | 4 | 7 | 1 | 0 | 3 | 4 | 2 | 4 | 2 | 35 |
| Precipitation >= 1.00 | 0 | 0 | 0 | 0 | 2 | 0 | 0 | 0 | 0 | 0 | 0 | 0 | 2 |
| Daily Precipitation Records Set or Tied | 0 | 0 | 1 | 0 | 2 | 0 | 0 | 0 | 1 | 0 | 0 | 0 | 4 |
One Day Precipitation Records:
March: 0.31" on the 9th.
May: 1.16" on the 4th and 1.19" on the 31st.
September: 0.54" on the 16th.
| Top Ten Wettest Months of December on Record | |||||||
| Rank | Year | Precipitation (inches) | |||||
| 1 | 1955 | 0.96 | |||||
| 2 | 2016 | 0.93 | |||||
| 3 | 1997 | 0.86 | |||||
| 4 | 2022 | 0.86 | |||||
| 5 | 1968 | 0.85 | |||||
| 6 | 1982 | 0.79 | |||||
| 7 | 1924 | 0.75 | |||||
| 8 | 1972 | 0.72 | |||||
| 9 | 1979 | 0.70 | |||||
| 10 | 1985 | 0.68 | |||||
| Top Ten Driest Months of July on Record | |||||||
| Rank | Year | Precipitation (inches) | |||||
| 1 | 1921/1953/1957 | 0 | |||||
| 2 | 2006 | 0.03 | |||||
| 3 | 1943/1999 | 0.04 | |||||
| 4 | 1945 | 0.05 | |||||
| 5 | 1920/1932 | 0.07 | |||||
| 6 | 1924/2011 | 0.08 | |||||
| 7 | 1949/1996/2005/2022 | 0.10 | |||||
| 8 | 1972 | 0.12 | |||||
| 9 | 1929/2016 | 0.13 | |||||
| 10 | 1964 | 0.14 | |||||
| Top Ten Driest Years on Record | |||||||
| Rank | Year | Precipitation (inches) | |||||
| 1 | 1988 | 3.75 | |||||
| 2 | 2012 | 3.98 | |||||
| 3 | 1974 | 4.12 | |||||
| 4 | 1954 | 4.85 | |||||
| 5 | 2001, 2006 | 5.07 | |||||
| 7 | 2020 | 5.62 | |||||
| 8 | 1966 | 5.66 | |||||
| 9 | 1990 | 5.71 | |||||
| 10 | 1922 | 5.91 | |||||
| 90 | 2022 | 11.42 | |||||
| Top Ten Wettest Years on Record | |||||||
| Rank | Year | Precipitation (inches) | |||||
| 1 | 1923 | 18.43 | |||||
| 2 | 2017 | 15.86 | |||||
| 3 | 2016 | 15.24 | |||||
| 4 | 1941 | 14.74 | |||||
| 5 | 1912 | 14.73 | |||||
| 6 | 1993 | 13.49 | |||||
| 7 | 1998, 1995 | 13.41 | |||||
| 9 | 1971 | 13.11 | |||||
| 10 | 1947 | 12.45 | |||||
| 15 | 2022 | 11.42 | |||||
 |
 |
| Annual Precipitation for Period of Record - Click on Graph to Enlarge | |
 |
|
| Click on Graph to Enlarge | |
|
Learn more about the National Weather Service's efforts to build a Weather-Ready Nation! |

| Element | Jan | Feb | Mar | Apr | May | Jun | Jul | Aug | Sep | Oct | Nov | Dec | Year |
| Total (inches) | 3.9 | 4.9 | 17.8 | 4.5 | T | 0 | 0 | 0 | 0 | 1.2 | 11.5 | 17.9 | 61.7 |
| Mean Snowfall (1991-2020 Normals) | 5.5 | 7.4 | 6.5 | 7.2 | 2.1 | 0.0 | 0.0 | 0.0 | 0.6 | 4.4 | 5.3 | 5.3 | 44.3 |
| Departure from Normal | -1.6 | -2.5 | 11.3 | -2.7 | -2.1 | 0.0 | 0.0 | 0.0 | -0.6 | -3.2 | 6.2 | 12.6 | 17.4 |
| Percent of Normal | 71 | 66 | 274 | 63 | 0 | 0 | 0 | 0 | 0 | 27 | 217 | 338 | 139 |
| Rank - Least to Most 104 years (P.O.R 1918-2022) |
58 | 64 | 96 | 61 | 72 | NA | NA | NA | NA | 56 | 91 | 94 | 102 |
|
|||||||||||||
| Greatest 24-HR Total | 2.7 | 2.1 | 2.7 | 2.3 | T | 0 | 0 | 0 | 0 | 1.2 | 3.4 | 9.6 | 9.6 |
| Dates of Occurrence | 6 | 16 | 8,16 | 12 | 13,21 | 0 | 0 | 0 | 0 | 24 | 29 | 22 | 12/22 |
| Number of Days with: | |||||||||||||
| Snowfall >= 1.0 inch | 1 | 2 | 5 | 1 | 0 | 0 | 0 | 0 | 0 | 1 | 4 | 3 | 17 |
| Daily Snowfall Records Set or Tied | 0 | 0 | 1 | 0 | 0 | 0 | 0 | 0 | 0 | 0 | 0 | 0 | 1 |
|
* 69 months of May on record a trace or 0.0" of snowfall. |
|||||||||||||
One Day Snowfall Records (inches):
March: 9.3" on the 9th.
| Top Ten Snowiest March's on Record | |||||||
| Rank | Year | Snowfall (inches) | |||||
| 1 | 2015 | 22.1 | |||||
| 2 | 1997 | 21.7 | |||||
| 3 | 1967 | 19.5 | |||||
| 4 | 1923 | 18.5 | |||||
| 5 | 2022 | 17.8 | |||||
| 6 | 2008 | 15.2 | |||||
| 7 | 1972 | 15.0 | |||||
| 8 | 1940 | 14.0 | |||||
| 9 | 2021 | 11.4 | |||||
| 10 | 2019, 2002, 1937 | 11.0 | |||||
| Top Ten Snowiest November's on Record | |||||||
| Rank | Year | Snowfall (inches) | |||||
| 1 | 1983 | 22.0 | |||||
| 2 | 2015/1942 | 19.0 | |||||
| 3 | 1920 | 17.0 | |||||
| 4 | 1985 | 15.2 | |||||
| 5 | 1978 | 14.8 | |||||
| 6 | 1938/1919 | 14.0 | |||||
| 7 | 1967 | 13.5 | |||||
| 8 | 1928 | 13.0 | |||||
| 9 | 2019 | 12.5 | |||||
| 10 | 2022 | 11.5 | |||||
| Top Ten Snowiest December's on Record | |||||||
| Rank | Year | Snowfall (inches) | |||||
| 1 | 1985/1972 | 19.0 | |||||
| 2 | 2022 | 17.9 | |||||
| 3 | 1978 | 16.5 | |||||
| 4 | 1979/1967 | 15.0 | |||||
| 5 | 1968 | 14.5 | |||||
| 6 | 2016 | 12.9 | |||||
| 7 | 2007/1955 | 12.5 | |||||
| 8 | 1987 | 12.0 | |||||
| 9 | 1982 | 11.9 | |||||
| 10 | 1924 | 11.7 | |||||
| Top Ten Snowiest Years on Record | |||||||
| Rank | Year | Snowfall (inches) | |||||
| 1 | 1920 | 77.0 | |||||
| 2 | 2017 | 71.1 | |||||
| 3 | 2013 | 70.6 | |||||
| 4 | 2009 | 62.5 | |||||
| 5 | 2022 | 61.7 | |||||
| 5 | 2020 | 61.7 | |||||
| 5 | 2016 | 61.7 | |||||
| 7 | 2010 | 60.1 | |||||
| 8 | 1919 | 58.0 | |||||
| 9 | 1923 | 56.2 | |||||
| 10 | 1944 | 55.4 | |||||
 |
 |
 |
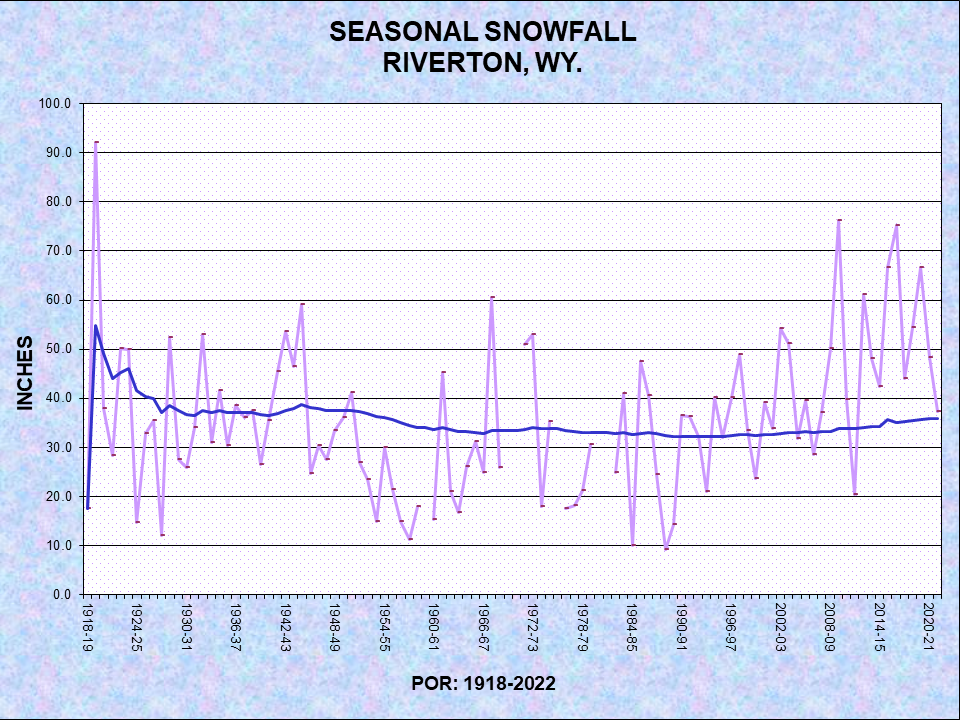 |
| Annual and Seasonal Snowfall for Period of Record - Click on Graph to Enlarge | |
|
Learn more about the National Weather Service's efforts to build a Weather-Ready Nation! |
|
Learn more about the National Weather Service's efforts to build a Weather-Ready Nation! |

