April 13 – 15, 2018 Flash Flooding on Kauai and Oahu
Event Summary
An upper level low pressure system which tapped into enhanced moisture embedded within the low level trade winds produced torrential rainfall and severe flooding over portions of Kauai and Oahu from late Friday, April 13 through Sunday, April 15, 2018. The event started as a highly localized but intense event over east Oahu during the early nighttime hours of April 13. Heavy rain over Kauai initiated later that night and continued through most of April 15, resulting in severe flash flooding over most of the north and east sides of the island. Portions of south Kauai were also affected by flash flooding during the afternoon of April 15. The Hawaii Emergency Management Agency reported that 532 homes were affected by flooding on Kauai and Oahu. Damage estimates were close to $20 million just for public properties. Estimates of damage to private and other properties were not yet available. In addition to the flood damage, numerous landslides over north Kauai west of Hanalei cut off access to Wainiha and Haena for more than two weeks. It was fortunate and amazing that there were no deaths or reports of serious injuries.
Large scale conditions
A loop of color enhanced water vapor channel images shows the evolution of the low pressure system from April 11 through April 16. The water vapor channel depicts moisture in the upper portions of the atmosphere. Dark orange colors indicate drier upper atmospheric conditions while blues indicate areas with the highest moisture content. The loop starts with a counter-clockwise rotating area west of Kauai on April 11 which corresponds to the low pressure system. This initial low appears to weaken and opens up to a low pressure trough which passes over the main Hawaiian Islands on April 13 and helps trigger the Oahu heavy rain event. A stronger low pressure system subsequently develops in the area to the west of the initial low's position on April 14. This low helped produce thunderstorms and flash flooding over Kauai through April 15.
The figure below shows the geopotential height contours at the 250 millibar level (approximately 35,000 ft above sea level) around the Hawaiian Islands at 2 PM HST on April 15, 2018 (0000 UTC, April 16). The green solid lines are the height contours with labels showing the heights in decameters. Green wind barbs indicate wind direction and speed in knots. This large low pressure system, also seen in the water vapor channel loop above, is centered several hundred miles west of Kauai. Short wave troughs moving northward within the eastern semicircle of the low's circulation helped produce areas of enhanced instability over the west half of the main Hawaiian Islands.

---------------------------------------------
The two figures below show the North Pacific surface analysis at (panel A) 8 PM HST April 13 (0600 UTC April 14) and (panel B) 8 AM HST April 15 (1800 UTC April 15). Solid black lines are mean sea level pressure (MSLP) contours (isobars) in millibars. The contour labels show only the last two digits of the pressure values (e.g. "24" = 1024 mb). Wind barbs indicate wind speed and direction in knots. The red dashed lines through the slight curvature of the MSLP contours depict a weak surface-based low pressure trough over the state (panel A), and just west of 160W longitude (panel B). A westward moving trough such as this can enhance rainfall development along and just east of the trough axis.


---------------------------------------------
The figure below shows a loop of Morphed Integrated Microwave Imagery at CIMSS (MIMIC) total precipitable water (TPW) from the University of Wisconsin's Cooperative Institute for Meteorological Satellite Studies (CIMSS). The loop starts at 6 AM HST April 13 (1600 UTC April 13) and continues until 6 PM HST April 15 (0400 UTC April 16). A vertical color bar on the right of the loop shows TPW values in inches (left column) and millimeters (right). The loop starts with elevated moisture content over the island chain and a larger, more significant area of moisture to the east near 140W longitude. This eastern area moves westward over the next couple of days and contributes to the Kauai heavy rainfall.

Oahu and Kauai Event Details
Oahu rainfall
Intense rainfall on Oahu came from a mesoscale convective system (MCS) that was moving westward toward Oahu in the trades. The following loop shows Digital Hybrid Reflectivity data from the Molokai WSR-88D radar which captures the main portion of the event. Prior to making landfall, the MCS appears to have merged with a leeside convective cloud line streaming off of northwest Molokai and intensified. The area of intense rainfall with rates greater than 4 inches per hour moved across east Oahu between 7:00 PM and 9:00 PM HST on April 13. Although the affected area was localized, the intensity of the rainfall produced tremendous amounts of runoff which produced substantial damage to communities from Maunawili to Waimanalo over the windward slopes of the Koolau Range, and from Aina Haina to Hawaii Kai along the leeward slopes.
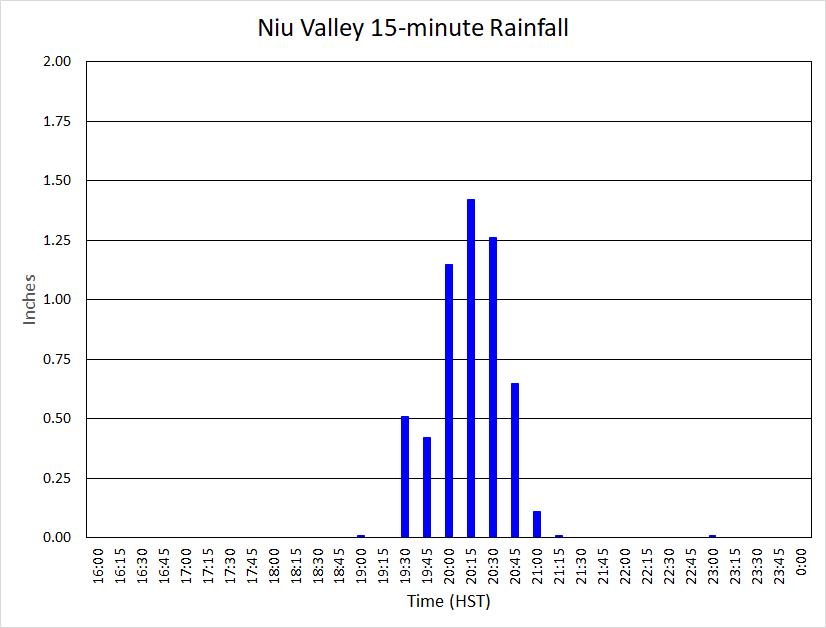
A bar graph of 15-minute rainfall data from the automated rain gage in Niu Valley shows how intense and short-lived the event was over the area. The peak 15-minute rainfall total of 1.42 inches (extrapolated hourly rate of 5.68 inches per hour) occurred from 8:00 to 8:15 PM HST. The same gage recorded 5.52 inches over the two-hour period from 7:00 to 9:00 PM HST, which encompassed most of the event. According to NOAA Atlas 14 these totals have annual probabilities of 4 to 10 percent (15-minute value) and 0.5 to 1 percent (two-hour value).
The rainfall map covering the 24-hour period ending at midnight, April 14 shows the localized nature of the heavy rainfall event. Significant rainfall was confined to the eastern third of the island with locations west of Honolulu mostly having less than 0.10 inches.

---------------------------------------------
East Oahu Streamflow
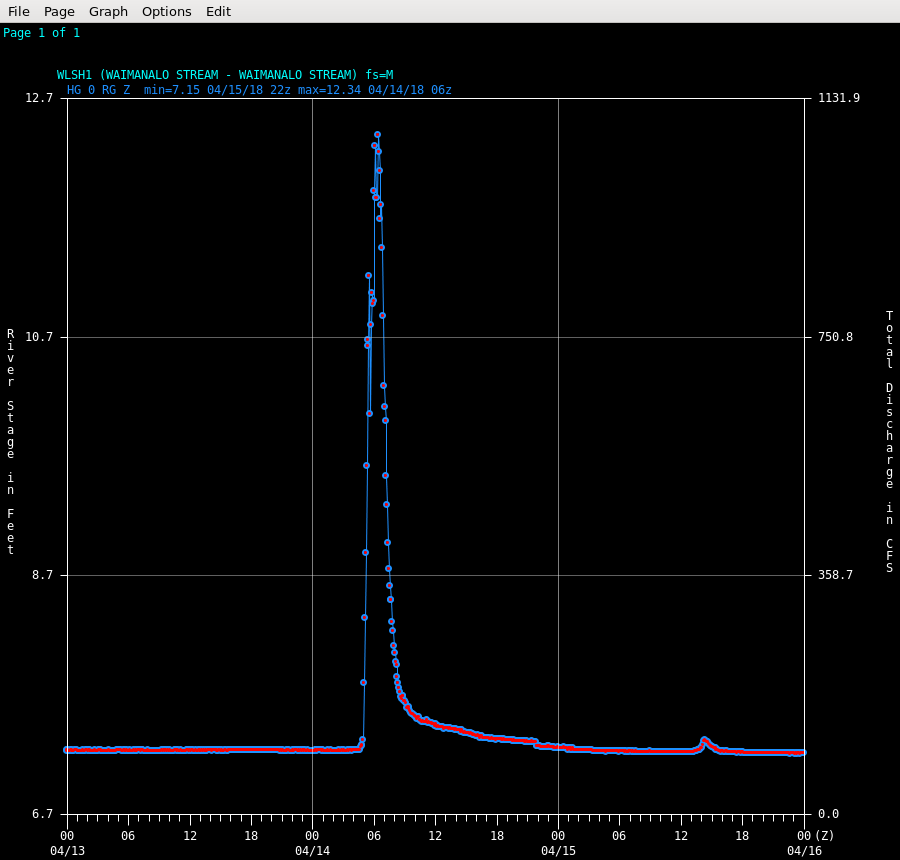
Drainage basins responded rapidly to the burst of rain over east Oahu. At Waimanalo Stream on the windward side of the Koolau Range, the water level rose 3 feet in about 30 minutes and 5 feet in an hour (see hydrograph below based on data from the U.S. Geological Survey). A peak streamflow gage at Wailupe Gulch on the leeward side registered a water level increase of over 8 feet. Out of 3 real-time and 5 peak streamflow gages operated by the U.S. Geological Survey (USGS) in east Oahu, there were no sites that showed the April 13 event broke any long term records. For additional information and flood statistics, please refer to the USGS' informational document linked here.
Oahu Flood Impacts
Flooding mainly impacted the communities of Aina Haina, Hawaii Loa Ridge, Niu Valley, Kuliouou, Hawaii Kai, Waimanalo Beach, Waimanalo, and Bellows Air Force Station. These areas are highlighted in the east Oahu map below. The larger Oahu map is provided for context and illustrates the localized nature of the flood event. The blue circles with numbers correspond to the images below the maps.
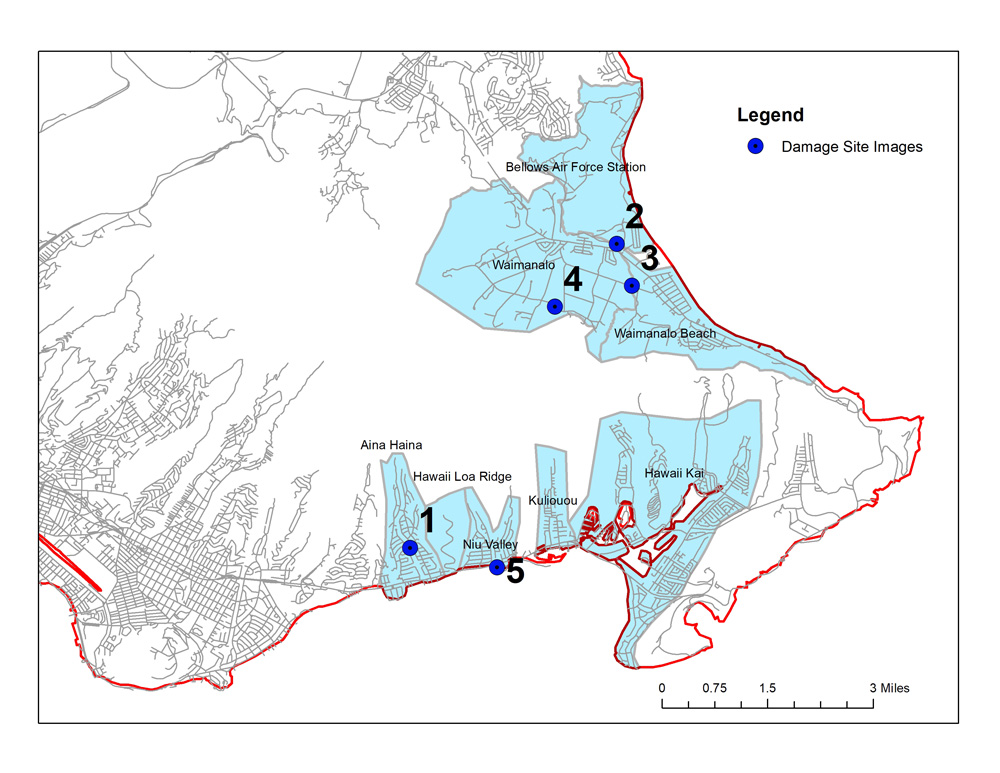

Image 1. Wailupe Gulch facing downstream. High water marks clearly evident along the banks.

Image 2. Kahawai Stream channel at Bellows Air Force Station. Vegetation debris along the banks shows that water got high enough to spill over the road.

Image 3. Tributary of Kahawai Stream at Hihimanu St. Temporary rails were reinstalled after the event. The channel is quite small at this location and easily overflowed.

Image 4. Waikupanaha Street. The road is clear but considerable runoff occurred at this location during the event based on the large amount of debris deposited in the area.

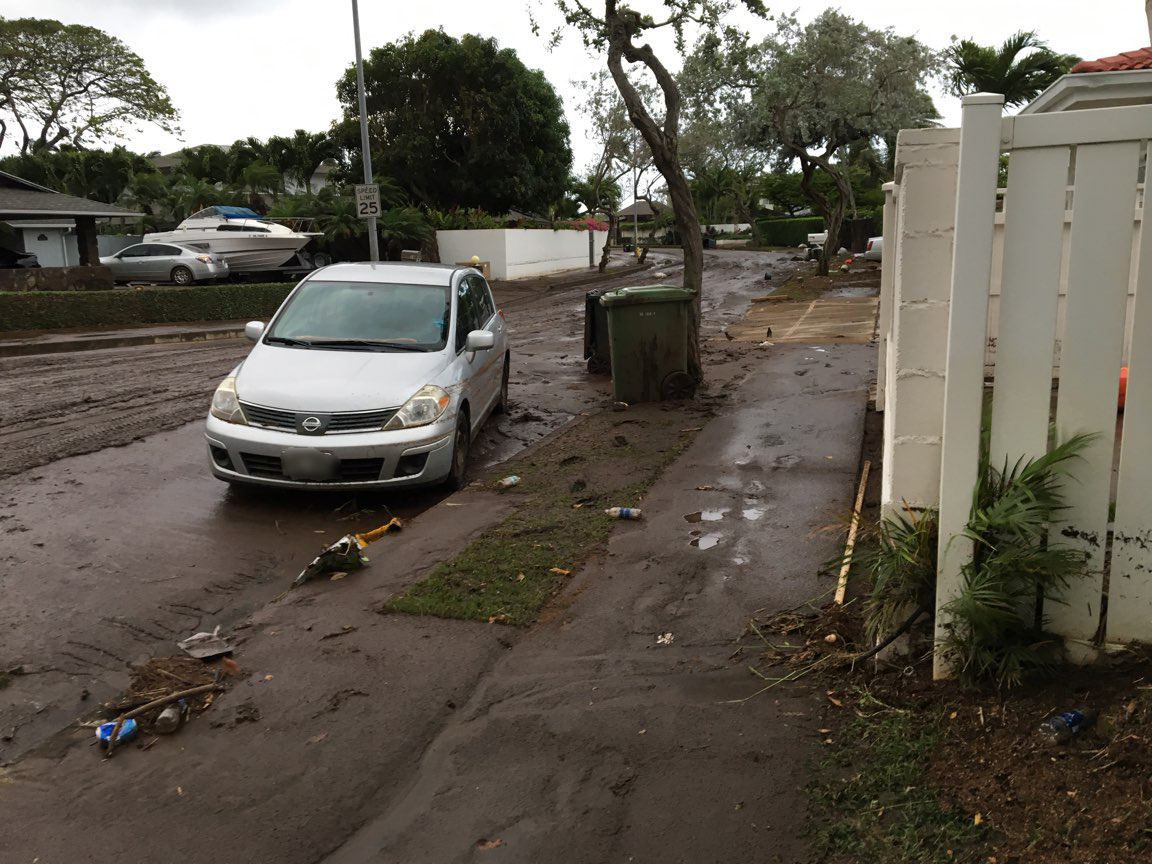
Image 5 (courtesy of Department of Emergency Management, City and County of Honolulu). Niuiki Circle. Niu Valley runoff surged into Niuiki Circle, one of the hardest hit areas from the flood. Residents indicated at least a couple of feet of muddy water in their homes which caused extensive damage. Note the muddy high water marks on the driver-side door of the car in the foreground and also along the white wall in the background of the image.
---------------------------------------------
Kauai Rainfall Details
Shortly before midnight on Saturday, April 14 the initial thunderstorms of the event moved over north Kauai. Several waves of thunderstorms through the morning hours resulted in the closure of Kuhio Highway at Haena and at the Hanalei Bridge. The Saturday morning heavy rainfall was not sustained as the cells moved across the area instead of anchoring in one spot. By 8 AM HST, the highway at the Hanalei Bridge reopened as conditions settled down. However, shortly after noon the first of three episodes of intense rainfall initiated over north Kauai. Unlike most heavy rain events which affect the island, this round of rainfall was centered along the lower elevations and coastal sections instead of over the upper slopes. Around this time several landslides near Wainiha closed Kuhio Highway. As rainfall continued through the afternoon, severe flooding washed out the Wainiha Powerhouse Road and destroyed two unoccupied homes. The first intense rainfall episode ended at around 7 PM HST as rainfall eased over north Kauai. The following loop consists of WSR-88D Digital Hybrid Reflectivity (DHR) images from 4:26 PM HST to 6:58 PM HST, April 14, during the first intense rainfall episode. The reddish areas indicate the most intense rainfall cores. These cores repeatedly develop and move over the lower elevations of north Kauai.
The second intense rainfall episode started around midnight on April 15 with thunderstorms firing up over the north-facing slopes of Kauai. Rainfall rates 5 to 7+ inches per hour were recorded during the peak of this episode. With heavy rainfall covering most of the northern drainage basins, stream and river responses were tremendous. Flash flooding in Hanalei River put portions of Kuhio Highway near Hanalei Bridge under 5 to 8 feet of water. Large flood waves in Wainiha River and Kalihiwai Stream inundated several properties as well. At around sunrise, the thunderstorm centroid shifted off the northern drainages and moved over northeast Kauai. While this helped lower water levels in the north part of the island, the shift resulted in damaging flash floods in Anahola and Kapaa Streams, and flooding in other smaller drainages. Thunderstorms rapidly weakened then dissipated around 8 AM HST to end the second episode. The loop below contains DHR images from 11:31 PM HST, April 14 to 2:00 AM HST, April 15. Notice how the intense rainfall becomes "anchored" farther up the slopes of north Kauai and covers almost the entire Hanalei River basin for several hours.

By 10 AM HST, April 15, it became evident that the event was not over as rain bands developed east of Kauai and moved over the island. The intensification of these rain bands marked the start of the third rainfall episode, and these thunderstorms became anchored once again over the northern slopes of the island. With the drainage basins already saturated, the resulting flood wave in Hanalei River was very large and put Kuhio Highway under deep water once again. Around 1 PM HST, the thunderstorms shifted to the northeastern portion of the island. Over the next several hours, the storm centroid shifted slowly southwestward putting intense rainfall of over 4 inches per hour over eastern then southeastern Kauai. Significant flooding occurred in the Koloa and Kalaheo areas, with homes off of Wailaau Road sustaining considerable damage. The last thunderstorms of the third rainfall episode dissipated around sunset. The DHR loop below covers the period from 9:59 AM HST to 12:31 PM HST, April 15. Seemingly minor rain bands move onshore from the east, rapidly intensify over the Hanalei River basin, and remain nearly stationary for several hours.
---------------------------------------------
This GOES-15 infrared image and lightning flash overlay loop covers the second and third intense rainfall episodes over Kauai. Each frame is a 15-minute interval. The coldest and highest cloud tops are depicted as yellow, orange, and maroon shades in the images. Lightning flashes are plotted as small plus and minus symbols. A total flash count for each image is in the upper left portion of the frame. Note how the thunderstorms are developing and "anchored" over the northern portion of the island. An even larger thunderstorm complex is northeast of Kauai with taller cloud tops. The second intense rainfall episode ends during the middle of the loop as the thunderstorms dissipate and lightning activity over Kauai ceases. However, another thunderstorm complex develops over north Kauai which represents the third intense rainfall episode. In addition to the rainfall, residents reported hearing HOURS of continuous thunder.

Rainfall totals on Kauai were tremendous and in some cases record-breaking. The map below shows rainfall totals (in inches) for the 48-hour period ending at 6 PM HST, April 15. Most of the depicted sites are automated, near real-time telemetered gages. Totals in red cover only a portion of the 48-hour period. In the case of Hanalei, the observation period runs from 6 PM HST, April 13 through 2 AM HST, April 15 when the data logger failed. The red square is a manually read rain gage which is part of the Community Collaborative Rain, Hail, and Snow Network (CoCoRaHS) in lower Wainiha Valley. The observer reported 36.49 inches during the period from 7:45 AM HST April 14 through 7:00 AM HST April 15. The blue triangle is an automated gage in Waipa but does not transmit data in real-time. A couple of days after the event, data from this site were retrieved and analyzed by a person affiliated with the Waipa Foundation, the owner of the gage. The results showed that this site recorded 53.57 inches in 48-hours, including 49.69 inches during the 24-hour period ending at 12:45 PM HST April 15. This 24-hour total, if certified, breaks the current U.S. 24-hour record of 43 inches at Alvin, TX on July 25-26, 1979, and the State of Hawaii record of 38 inches at Kilauea (Kauai) on January 24-25, 1956. The National Climatic Extremes Committee is in the process of validating this claim.
Another interesting aspect of the rainfall is that the highest totals over north Kauai were over the lower elevations rather than over the upper slopes as is often the case during rain events. This suggests that a significant portion of the event was driven by larger storm scale processes rather than the usual enhancement of rainfall by the mountainous terrain.

A bar graph of 15-minute rainfall accumulations from Waipa clearly shows the extreme intensity of the event. The graph covers the period from 22:00 (10:00 PM) HST, April 14 to 06:00 (6:00 AM) HST, April 15, which encompasses the second intense rainfall episode described above. The maximum 15-minute accumulation of 1.77 inches extrapolates to an hourly rate of 7.08 inches per hour.

The maximum rainfall totals at Waipa for different durations are listed below, followed by the times of occurrence. The values in parentheses are the annual exceedance probabilities from NOAA Atlas 14. Keep in mind that as of June 30, the rainfall totals from Waipa have not been validated and are considered to be unofficial.
15-minute: 1.77 inches, 00:45 - 01:00 HST, April 15 (< 0.2%)
1-hour: 5.51 inches, 00:45 - 01:45 HST, April 15 (0.5% to 1%)
6-hour: 19.52 inches, 13:00 - 19:00 HST, April 14 (< 0.2%)
12-hour: 33.33 inches, 16:00 HST, April 14 - 04:00 HST, April 15 (< 0.2%)
24-hour: 49.69 inches, 12:45 HST, April 14 - 12:45 HST, April 15 (< 0.2%)
---------------------------------------------
Kauai Streamflow
The map below shows the main streams and rivers affected by the Kauai flash flood event. Also shown are the locations of USGS gages referenced in the discussion.
Additional information on stream and river flow estimates from the USGS can be found here:

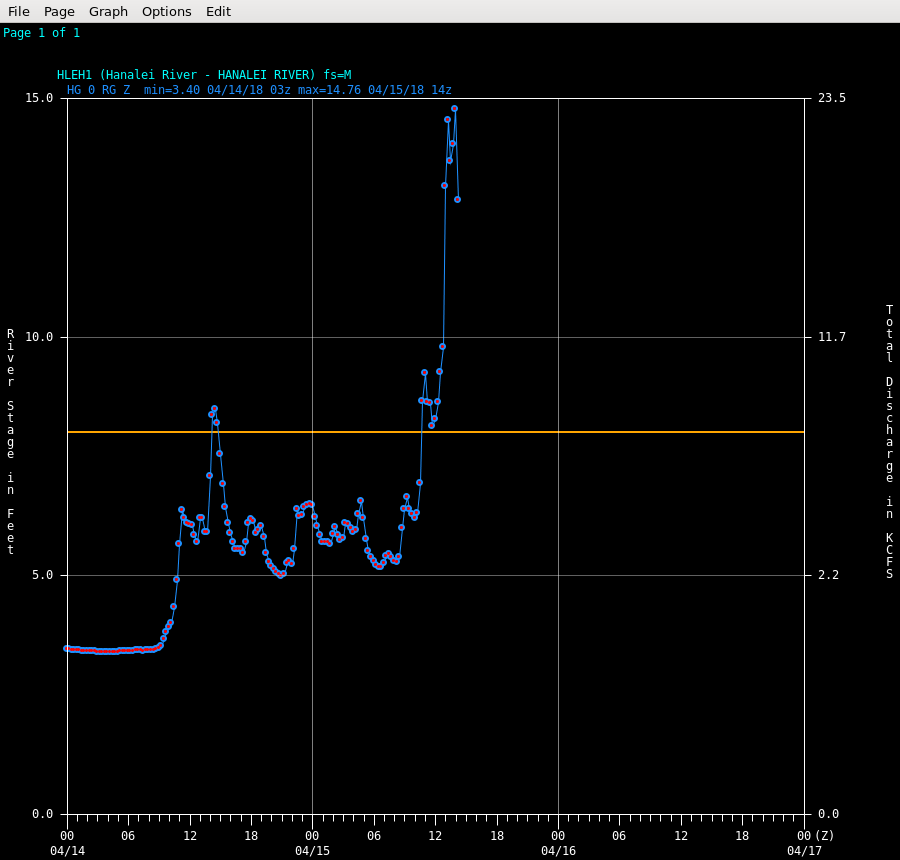
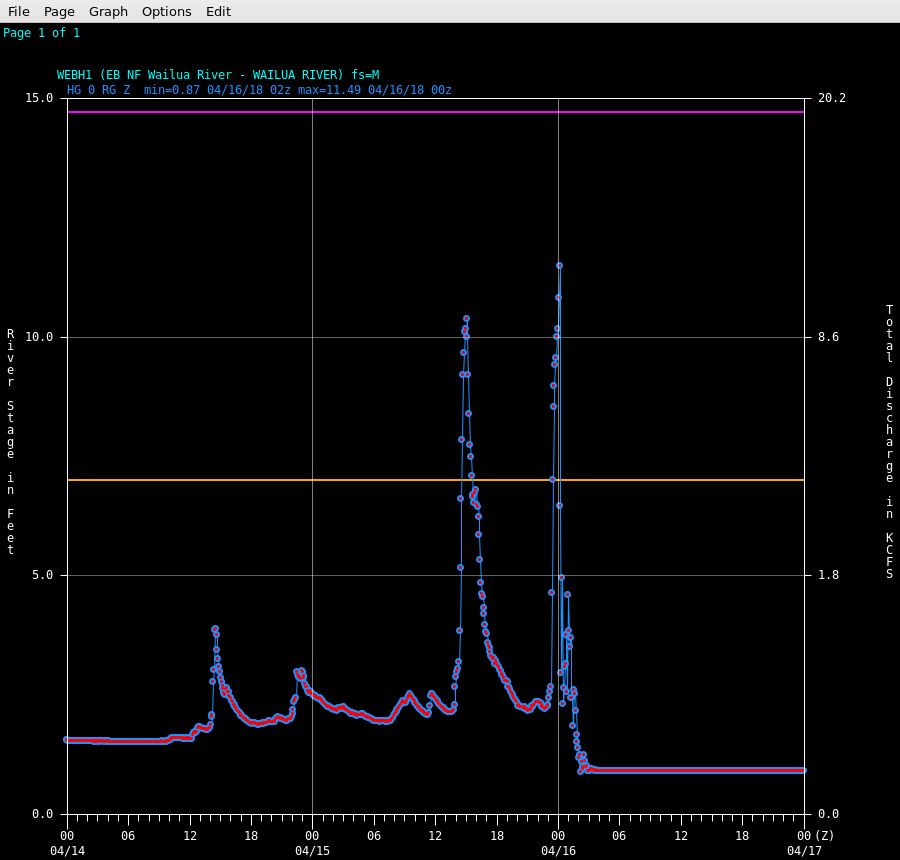
Large flood flows were recorded by USGS stream and river gages across north and east Kauai. Severe bank erosion damaged several gage sites resulting in a loss of data. The largest event flow on Kauai was estimated by the USGS to be 32,700 cubic feet per second (cfs) at their Hanalei River gage (NWS ID: HLEH1, first hydrograph below). This represents a water level increase of about 15 feet and discharge increase of over 30,000 cfs from pre-event levels. The estimated flow of 32,700 cfs occurred shortly after data transmissions from the site ceased. The horizontal orange line is correlated with the level at which flood waters inundate Kuhio Highway near the coast just east of Hanalei town. The second hydrograph is from the USGS' East Branch, North Fork Wailua River gage. A large flash flood was recorded by this site during the previously referenced third intense rainfall episode. The water level increased 6 feet in 20 minutes with discharge going from 406 cfs to 6685 cfs. Although the data logger continued to transmit after the flash flood, the data quality became disrupted due to significant physical changes in the river channel. Out of 12 real-time and 10 peak streamflow gages operated by the USGS on Kauai, only Wainiha River registered a record-breaking flow. This may come as a surprise to some considering the nature of the record-breaking rainfall. However, the highest rainfall values occurred at low elevation locations below the USGS stations so the recorded flows did not reflect this aspect of the event.
---------------------------------------------
Kauai Flood Impacts
The most severe flooding impacts occurred over north Kauai from Hanalei to Haena. Compounding the damage and destruction of homes due to the flooding was loss of road access to communities west of Hanalei from several landslides. For several days, evacuations and the delivery of relief supplies could only occur via helicopter and small boats. The largest landslides were in the area of Waikoko between Hanalei and Wainiha which covered Kuhio Highway in several locations. The map below shows a portion of north Kauai roughly from Kilauea to Haena. The blue circles with numbers correspond to the locations that the images below the maps were taken.
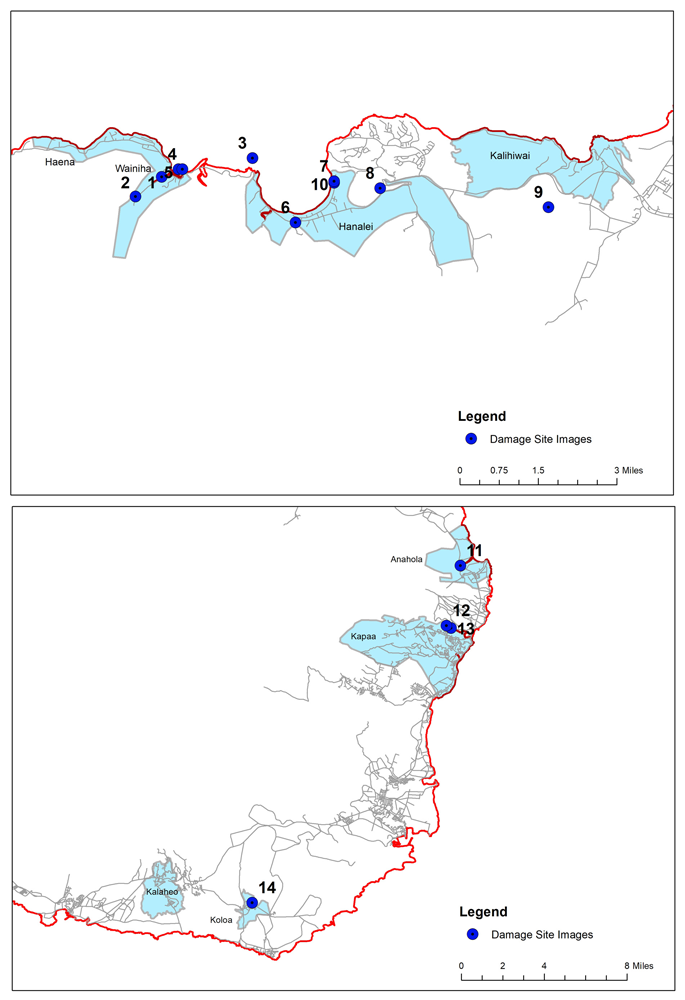
Image 1 (courtesy of the Kauai Emergency Management Agency). Flooding at the intersection of Kuhio Highway and Wainiha Powerhouse Road. Kuhio Highway is the left to right road completely inundated in the middle of the image.

Image 2 (courtesy of the Kauai Emergency Management Agency). Destroyed home off of Wainiha Powerhouse Road. The structure was reported to be unoccupied during the event.

Image 3. The center of the image shows several landslides in the Waikoko area which covered Kuhio Highway. This area has had landslides in the past.

Image 4. Landslide scars are evident just below the center of the image. These slides, along the east side of Wainiha Bay, also covered Kuhio Highway.
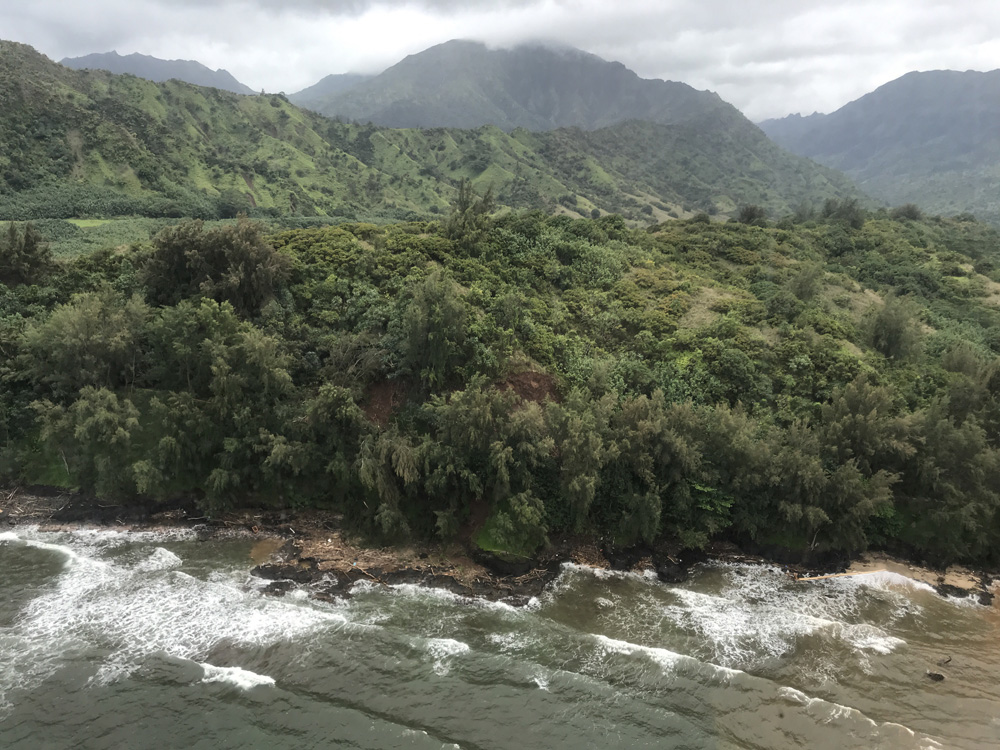
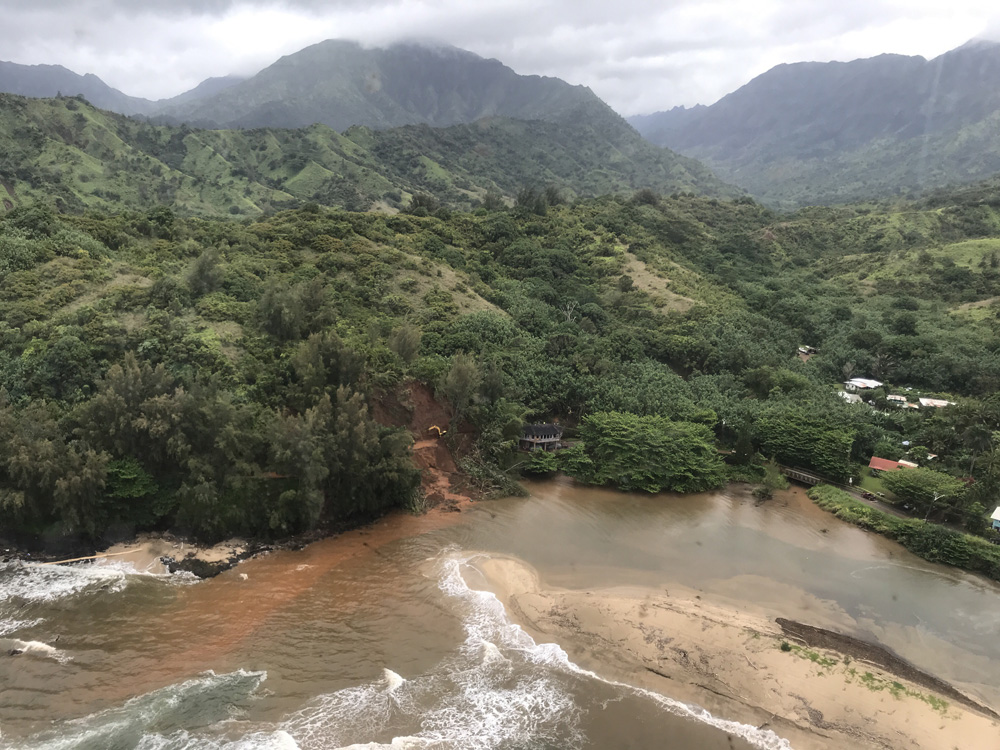
Image 5. Another landslide scar on the east side of Wainiha Bay. This image was taken southwest of the Image 4 position. Note the piece of heavy equipment working on clearing Kuhio Highway.
Images 6A and 6B. The next two images below were taken over the western side of Hanalei looking toward the south and southwest. Waioli Stream is in the foreground of both images. Although some of the scars are old, there are fresh, large landslide scars clearly evident with significant debris cones at the base of the slopes.
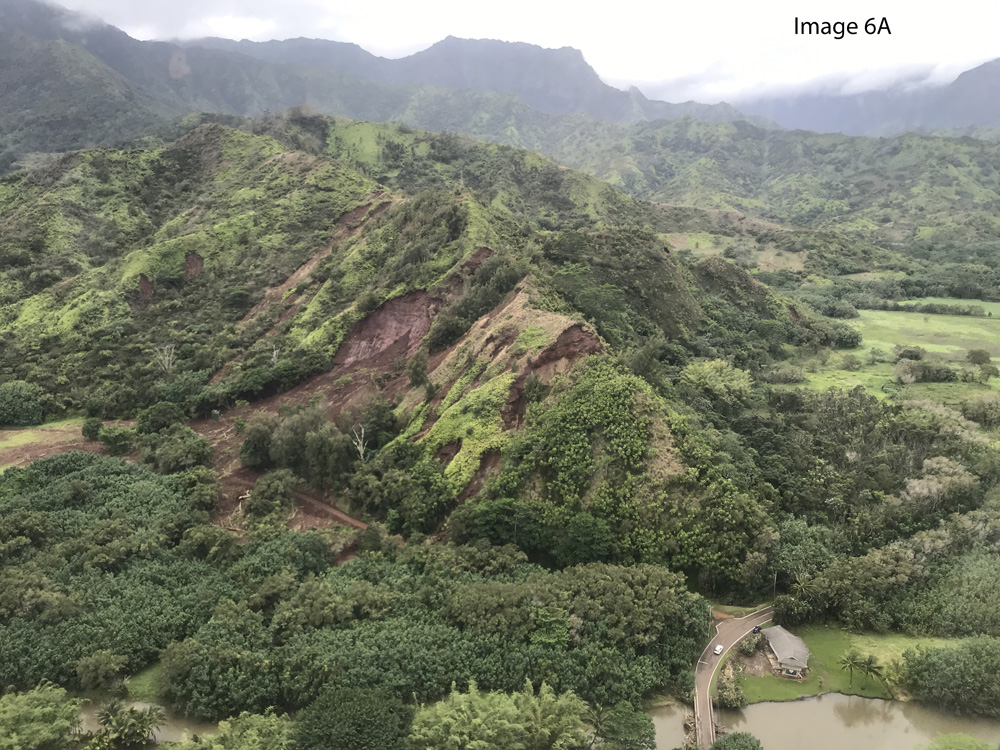

Image 7. Taken over the beach at Hanalei Bay facing east-southeast. The two yellow circles identify large washouts where the road has collapsed. A ground view of the area in the lower circle is provided in Image 10A. The collapsed home in Image 10B is to the left of the lower circle with the large dark gray roof adjacent to the beach.

Image 8. This image was taken facing northeastward over the taro fields in Hanalei Valley. Hanalei River is in the lower portion of the image. The portion of Kuhio Highway descending into the valley is in the center. Landslide scars are evident along the highway left and right of the image center. The community of Princeville occupies the upper half of the image.
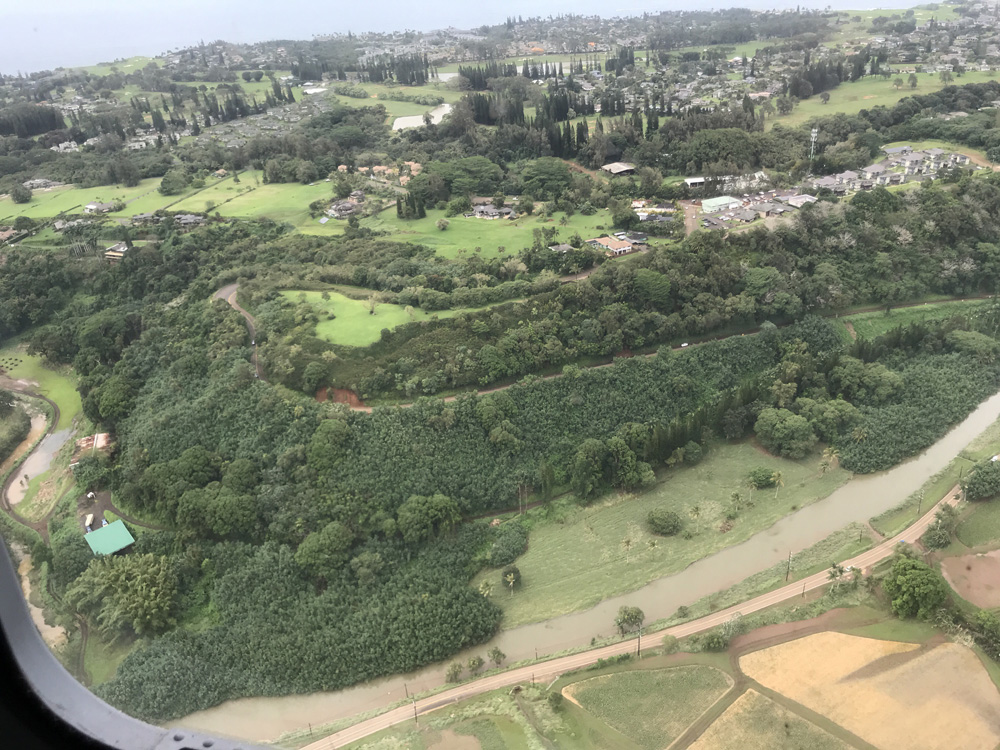
Image 9. Kalihiwai River above the Kuhio Highway Bridge. The lower center of the image shows a large swath of trees and vegetation knocked down by flash flooding. Several structures and vehicles were damaged or destroyed in Kalihiwai Valley.

Images 10A and 10B. Image 10A shows a large washout of Weke Road near the Hanalei Pier. Another large washout is in the distance marked by the green vegetation in the middle of the road. Image 10B shows a collapsed house downstream (off the left side) of Image 10A. An aerial view of this location is provided in Image 7 above.


Images 11A and 11B. Severe flash flooding also occurred in Anahola Stream in the northeastern portion of Kauai. Image 11A shows a large flood swath looking upstream from the Kuhio Highway bridge. The stream channel is visible through the trees on the left side of the image. The image shows the same area where three people were killed in the December 14, 1991 Anahola Flood. Image 11B is looking downstream from the bridge. Significant property damage occurred in the area downstream from the bridge.
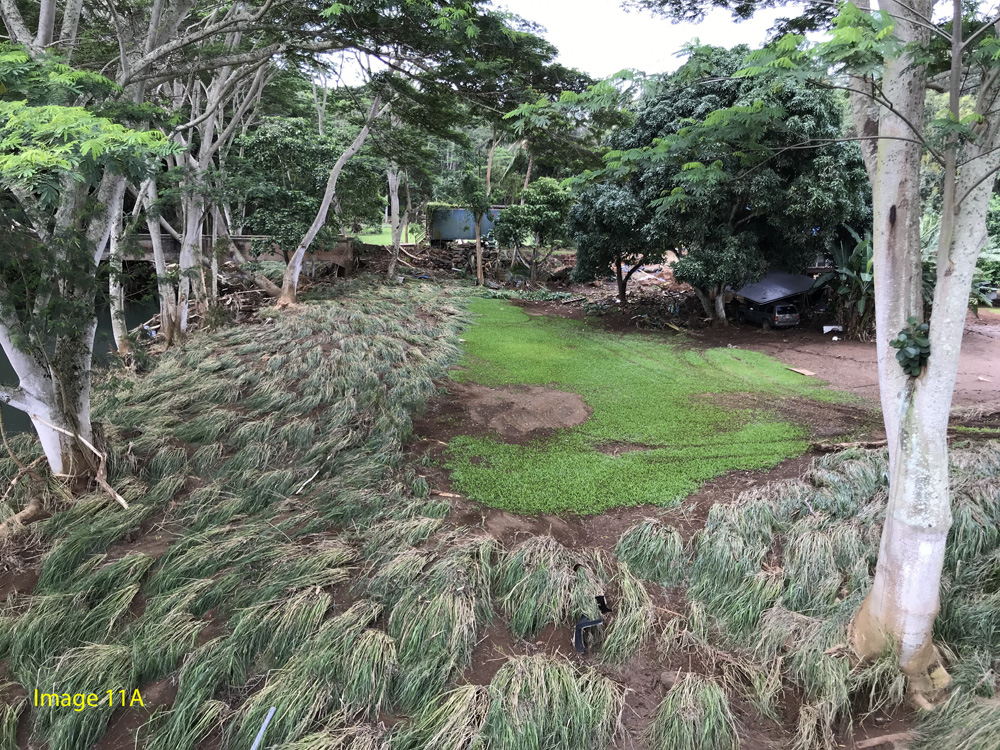

Image 12. Debris lines show how high and wide flash flooding got within and outside the banks of Kapaa Stream. In the center distance is the Keapana footbridge. The water level got up to the base of the bridge. Although intact, the bridge has been inaccessible for many months. Several homes in the Keapana area were damaged or destroyed by flooding.

Image 13. Kapaa Stream about a quarter-mile downstream from Image 12. Vegetation flattened in the foreground and left hanging on the tree branch at left indicate how high the water level reached at this location. Debris and damage to mailboxes along the road at left also indicated the maximum height of the flood waters.

Image 14. Near the town of Koloa in the southeastern side of Kauai, several homes were inundated when a tributary of Waikomo Stream overflowed its banks at Waihohonou Road and Aloha Place. The horizontal mud line several feet off the ground on the house in the image indicates the maximum water level reached during the event.


 Follow us on YouTube