On the morning of June 22, 2015, two bursts of strong winds moved across portions of southeast South Dakota, northwest Iowa. and southwest Minnesota. The first burst of wind was associated with the leading edge of a severe squall line, called a derecho, that moved from central South Dakota into southern Wisconsin. Wind with the leading edge of the squall line ranged from 50 to 100 mph and caused significant damage in Garretson, South Dakota and Sheldon, Iowa. The second round of damaging winds, in some cases stronger than what occurred earlier in the morning, affected many portions of southeast South Dakota and southwest Minnesota. In this case, the damaging winds persisted for 15 to 30 minutes. Many places saw winds gust between 50 and 80 mph with the highest gust near DeSmet, South Dakota. Other notable wind gusts occured at Beaver Creek, MN (80 mph) Jackson, MN (76 mph), Rushmore, MN (75 mph), Worthington, MN (74 mph) and Sioux Falls, South Dakota (73 mph).

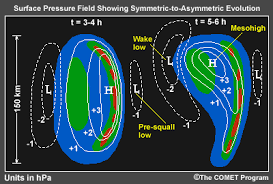
These winds were associated with a wake low. Below is a depiction of rainfall and pressure associated with a squall line. This graphic is courtesy of the Cooperative Program for Operational Meteorology, Education and Training (COMET). Right behind the line of thunderstorms is a feature called a meso high. The mesohigh is the result of cold air being produced by evaporation of rain within the thunderstorm. The strength of the mesohigh is typically determined by how cold the air is behind the line of thunderstorms. Behind the mesohigh is the wake low. The wake low is typically behind the area of lighter rainfall that forms behind squall line. This forms as a result of warming air several thousand feet above the surface.
This image shows the precipitation associated with the squall line on Monday morning. This radar picture was taken at 6:03 am CDT, Monday, June 22, 2015. Based upon the radar picture, we have estimated where the mesohigh (south of Marshall, MN) and wake low (near Sioux Falls, SD) would be located. A more detailed analysis would be necessary to determine the exact location of each feature.

Typically, the wind flows clockwise around high pressure and counterclockwise around low pressure. If that were the case, you would expect southerly winds across southwestern Minnesota with the wake low. However, because the distance between the mesohigh and wake low is generally 50 to 100 miles and these features develop so quickly, the air actually flows directly from high pressure to low pressure. As a result, from the simplified image of the high and low above, we would expect northeast winds across southwest Minnesota. In fact, when the winds were strongest on Monday morning, they were out of the north.
The automated weather observing system at Sioux Falls, South Dakota, provided 1-minute data of the pressure, wind, temperature and dew point on Monday morning. With both the strong winds at the leading edge of the squall line and those associated with the wake low, these observations provide a unique opportunity to observe the difference in how the strong winds developed along the leading edge of the squall line and near the wake low.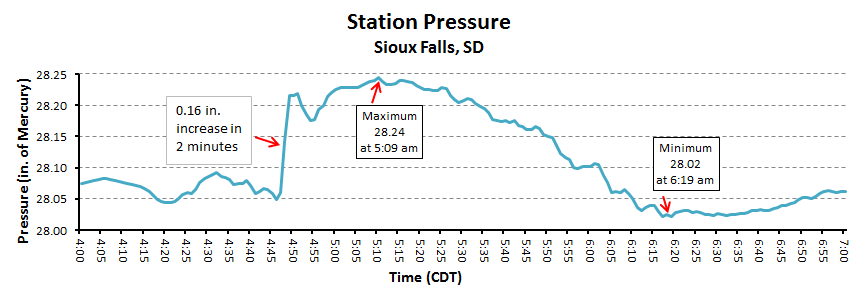
Above is the pressure trace for Sioux Falls between 4 am and 7 am CDT. The pressure shown is the measured station pressure - it has not been corrected to sea level as is typical for most pressure readings provided by meteorologists. Between 4 am and 4:45 am, the pressure was fairly steady, fluctuating between 28.05 and 28.10 inches. At 4:47 am, the pressure rose very rapidly - going from 28.06 inches at 4:47 am CDT to 28.21 inches at 4:49 am CDT. A pressure rise of 0.15 inches in 3 hours is considered very rapid so to happen in 2 minutes was unusual and showed how strong the squall line was. After briefly falling in the next 5 minutes, the pressure slowly climbed to its maximum of 28.24 inches at 5:09 am. After that, the pressure began a slow fall initially and then a more rapid fall beginning around 5:30 am. The pressure fell a total of 0.22 inches in just over an hour, reaching a minimum of 28.02 inches at 6:19 am CDT. Again, this rapid fall was unusual when it occured over an hour.
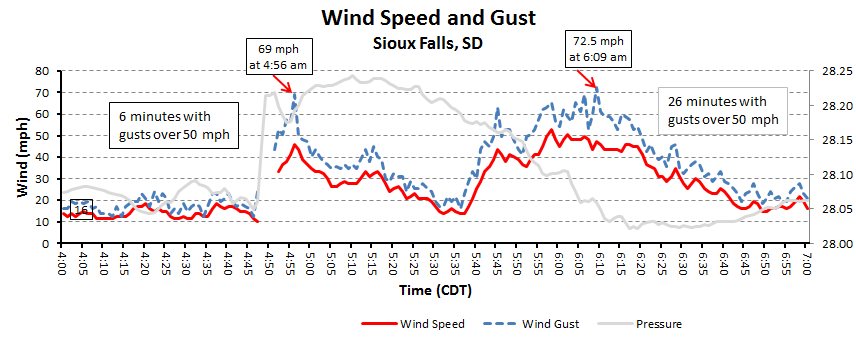
Let's look at the wind next. This is the one-minute wind speed and wind gust for Sioux Falls for the same time period. The wind speed is in red with the wind gust the dashed blue line. We have also included the pressure trace from above as a light grey to help visualize how pressure changes were related to the wind. There was a gap in the wind speed and gust between 4:48 and 4;51 am. While hard to see, the wind gust began to increase just as the pressure began to rise at 4:47 am. The maximum gust at that minute was 21 mph. When the winds returned at 4:51 am, the winds were then gusting to 44 mph in Sioux Falls and, while strong, these winds are not considered severe. Instead the strongest winds with the thunderstorms occurred at 4:56 am when the wind gusted to 69 mph. This is approximately 8 minutes after the rapid rise in pressure. After 4:56 am, the winds quickly subsided as the pressure rose more slowly. In fact, the winds were only greater than 50 mph for 6 minutes with the inital leading edge of the squall line.
By 5:30 am, winds were back below 20 mph and the pressure up to that point was only slowly falling - with the pressure only 0.03 inches lower than its peak at 5:09 am. The pressure fall began to accelelerate after that, falling 0.11 inches over the next 30 minutes It was during this time frame that winds again increased in speed. Around 5:45 am, winds gusted to 63 mph. After a brief respite from the wind, when gusts fell below 50 mph, they again increased rising back over 50 mph at 5:53 am. Several times over the next 26 minutes, the wind gusted over 60 mph reaching a peak gust of 73 mph at 6:09 am. The pressure reached its minimum value at 6:19 am, which is also the last time the wind gusted over 50 mph. The wind continued to slowly decrease over the next half hour as the pressure slowly rose between 6:30 and 7 am CDT.

Finally, the temperature and dew point trace from Sioux Falls are shown above. Notice that as the gust front moved through and the pressure rose rapidly around 4:47 am, the temperature fell 10 degrees in 9 minutes. As noted above, the strength of the mesohigh is related to how cold the air is behind the initial line of thunderstorms. After reaching a minimum of 64 degrees, the temperature began a slow rise as the storms move to the east. Even as the wake low approaches, the air did not get colder. In fact at the time of the strongest wind gust at 6:19 am, the temperature had warmed to 71 degrees. This is evidence that the strongest wind gusts were not associated with the development of a second pool of cold air near the surface and were driven by the pressure difference beween the mesohigh and wake low. At the same time, the air was also became drier as the dew point fell into the upper 50s .
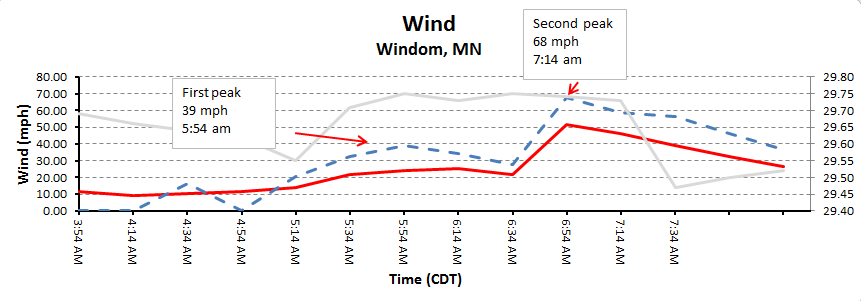
Below are some pressure traces and graphs from southwestern Minnesota. Unlike Sioux Falls, we only receive data every 20 minutes for the following locations, so we are unable to determine how quickly the pressure rose and how much the wind fluctuated.


If you have any comments or questions about this post, please comment on our Facebook page at https://www.facebook.com/NWSSiouxFalls and we will try to answer those questions.


 Weather Story
 Weather Map
 Local Radar
 Follow us on YouTube