...Preliminary NWS Damage Survey for Humboldt, South Dakota Tornado...
Overview...
A brief tornado developed late Tuesday evening, June 17, 2014, southeast of Humboldt, South Dakota and traveled to the
northwest.  The tornado was on the ground for 18 minutes and affected two family residences along its route with one
family at home during the tornado.  The family was in bed as the storm approached and received a call from their daughter
informing them of the tornado and the warning that was issued for their location.  They immediately went to the basement
for shelter and a few minutes later the tornado struck their home.  They received no injuries and today credit their
daughter and the warning for their safety.
| EF Scale Rating | EF-2 |
| Estimated Peak Wind | 125 mph |
| Path Length in statute miles | 3.43 |
| Maximum path width | 400 yds |
| Fatalities | 0 |
| Injuries | 0 |
| State Date | June 17, 2014 |
| Start Time | 10:44 pm CDT |
| Start Location | 3.5 miles SSE of Humboldt, SD |
| End Date | June 17, 2014 |
| End Time | 11:02 pm CDT |
| End Location | 1.5 miles SW of Humboldt, SD |
Map of the Humboldt, SD tornado track
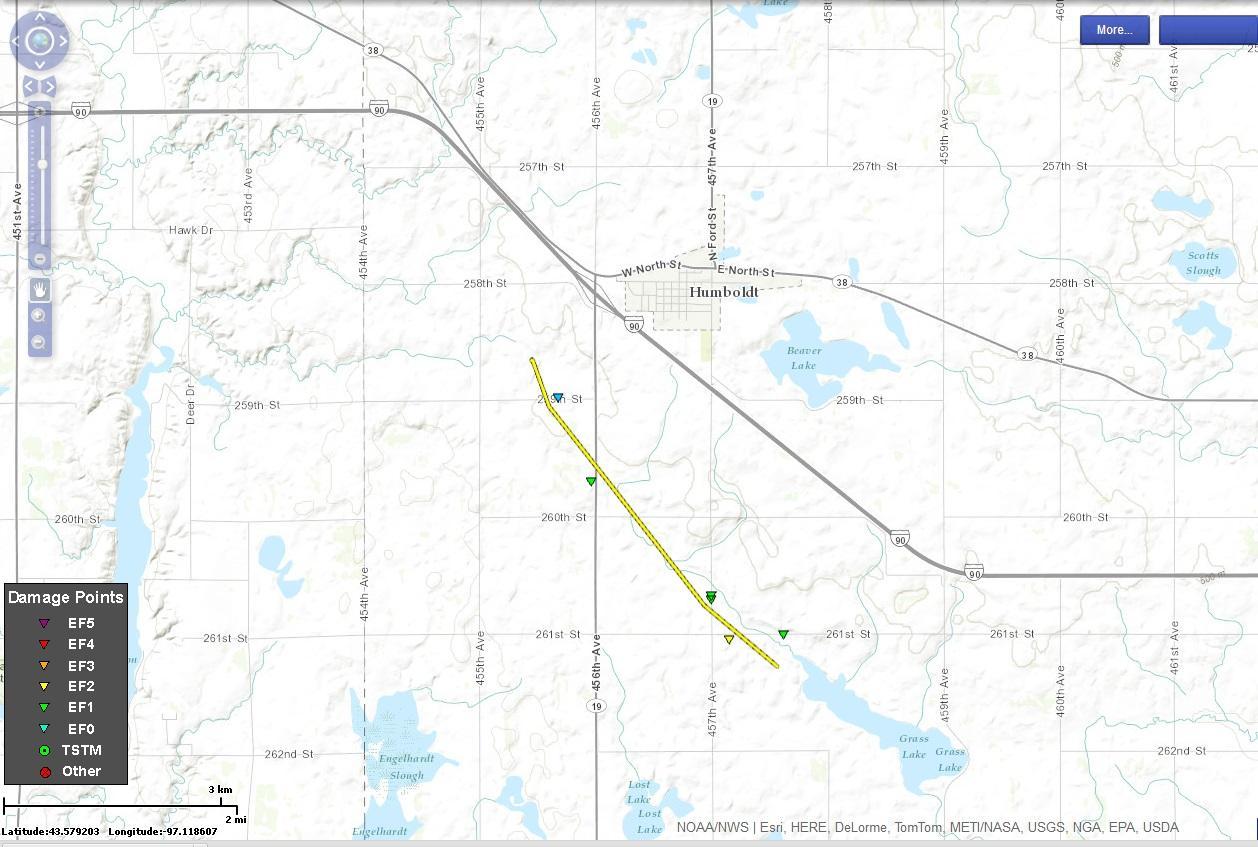
Click on map to download a kmz file tha twill display this path in Google Earth.  If you download the kmz file and import it into Google Earth, each triangle
will link to a description of the damage that was observed and may also include photos.
 |
 |
Above are photos taken of damage associated with the tornado.  This damage occurred about 3 miles
south of Humboldt.  The photo on the left shows damage to outbuildings of a farm.  The photo on the
right shows significant damage to a home.  Notice that most of the exterior walls have been removed from
the house.
Track of the tornadic circulation as seen on radar
This image is of the track of the tornadic circulation as seen on radar. Note that the location of the circulation on radar
does not necessarily match the track of the tornado. In many cases, the radar signature of the tornado can be seen several
minutes prior to the tornado developing. Also the location of the tornado on the ground can be a few miles from the location
of the tornadic signature on radar.
The track of this tornado was more erratic than most tornadoes as its motion varied from south to west to northwest during
its life.
Above is the change in the average wind speed within the tornadic circulation from the time a circulation was detected
by radar around 10:24 pm CDT and when it dissipated at 11:10 pm CDT.  Notice that it takes almost 30 minutes for the
circulation to reach its maximum value after detection and then dissipated in only 15 minutes.
 |
 |
|
Radar reflectivity of the Humboldt, SD tornado at 10:48 pm CDT. |
Radar reflectivity of the Humboldt, SD tornado at 10:53 pm CDT. |
Unlike many strong tornadic thunderstorms, there is not a hook echo evident on this storm when the tornado was at its
strongest.  In fact, looking at only the reflectivity image from this storm, it would be very difficult to determine that there was
a strong tornado south of Humboldt at this time.  However, when one examines the radial velocity data at the same time,
the location of the tornado becomes obvious as can be seen below.  The tornado shows up as the very light green next
to the pink in the center of the images below.
 |
 |
|
Radial Velocity image of the Humboldt, SD tornado at 10:48 pm CDT |
Radial Velocity image of the Humboldt, SD tornado at 10:53 pm CDT |
Another interesting aspect of the radar display of this storm is evidence of a minimum in reflectivity at the location where
the tornadic circulation was maximized on radar.  The images below show a very small area where the reflectivity was
much lower the surrounding area.  This has been documented by research scientists using very high resolution radars but has
not been seen often by National Weather Service radars.  At the same time this minimum in reflectivity was seen, some of the
strongest velocities of a tornadic circulation ever sampled by National Weather Service radar were also observed.  At 10:48 pm CDT,
the maximum inbound was 95 mph and the maximum outbound velocity was 84 mph.  Five minutes later, the maximum inbound increased
to 117 mph with the maximum outbound at 96 mph.  The wind speeds observed on radar at 10:53 pm CDT were equivalent to an EF-2.
 |
 |
| The 0.5 degree reflectivity image at 10:48 pm CDT. | The 0.5 degree velocity image at 10:48 pm CDT. The circulation was sampled at approximately 870 ft above the ground. |
 |
 |
| The 0.5 degree reflectivity image at 10:53 pm CDT. | The 0.5 degree velocity image at 10:53 pm CDT. |
Click on each image to enlarge.

EF0...Weak......65 to 85 mph
EF1...Weak......86 to 100 mph
EF2...Strong.....111 to 135 mph
EF3...Strong.....136 to 165 mph
EF4...Violent....166 to 200 mph
EF5...Violent....Greater than 200 mph
Note:
The information in this statement is preliminary and subject to change pending final review of the
event and publication in the National Weather Service Storm Data.


 Weather Story
 Weather Map
 Local Radar
 Follow us on YouTube