Hail Climatology
Southeast Wyoming and WEstern Nebraska
|
Strong to severe thunderstorms with large hail frequent southeast Wyoming and western Nebraska during the summer months. The impacts from these storms can be extremely costly resulting in damages to homes, vehicles, crops, etc. Using hail reports from NCEI's Storm Events Database, we assessed various aspects and characteristics, including the temporal and spatial distribution of hail reports and hail days across southeast Wyoming and western Nebraska since 2000. This climatology will help provide information on typical hail occurrences across the region, but also provide reference point to highlight the rarity of various events in context to the climatological normal. |
Distribution of Hail Sizes |
|
|
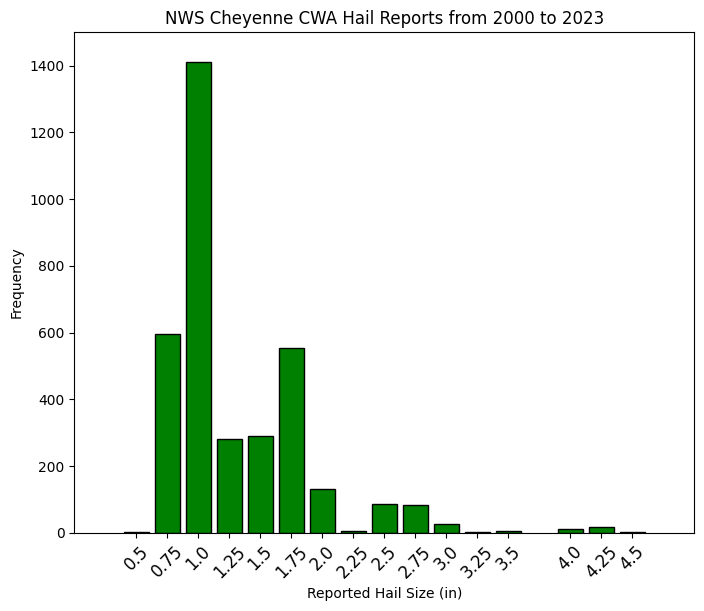
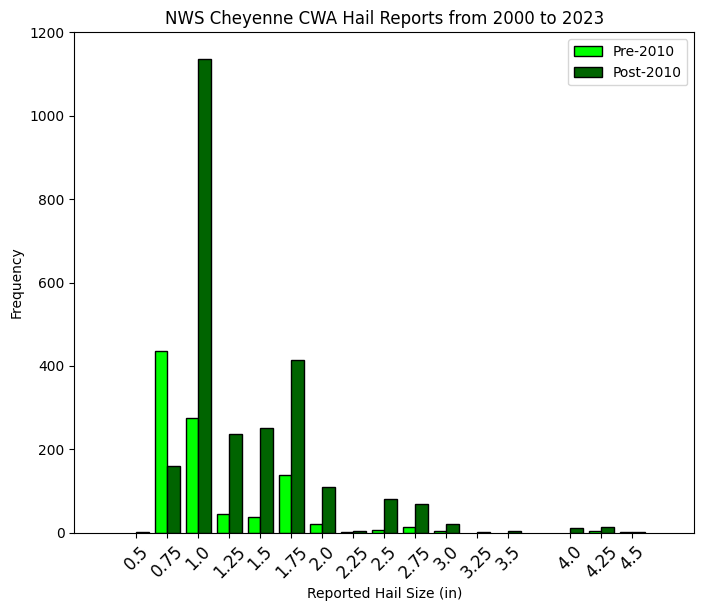
The bar plots below show the distribution of reported hail sizes across the NWS Cheyenne County Warning Area (CWA). Quarter size hail was the most frequently documented hail size, but has seen an uptick in reported frequency since the NWS Severe Thunderstorm criteria for hail changed from 3/4 inch to 1 inch diameter in 2010. Golf ball size hail was the second most commonly documented severe hail size, which leads to the question about whether or not golf ball size hail is over-reported. Additionally, very few reports of hail at 2.25 inches existed within the database likely due to hail size charts skipping from 2 inch hail (lime) to 2.5 inch hail (tennis ball). Therefore, hail reports of this size would have had to been specifically measured rather than being compared to a common object. It is worth noting that very few hail reports at 0.5 inch and none at pea size (0.25 inch) were recorded in the NCEI Storm Events Database. These events are usually little impact with minimal reported damages and therefore not recorded in the official database. One exception would be when large amounts of small hail fall. Therefore, the subsequent sections and images do not account for most hail occurrences with reported sizes of 0.5 inch or less. |
|
 |
 |
| Click to Enlarge Image | |
Temporal Distribution of Hail Reports |
|
|
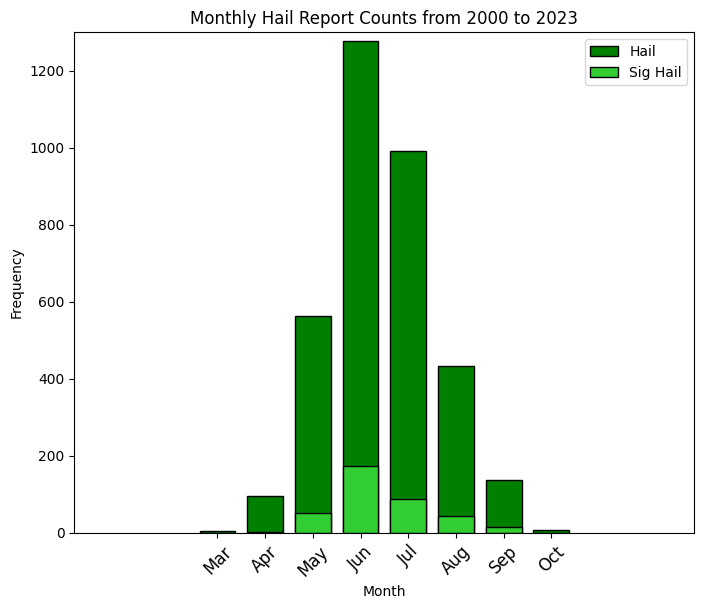
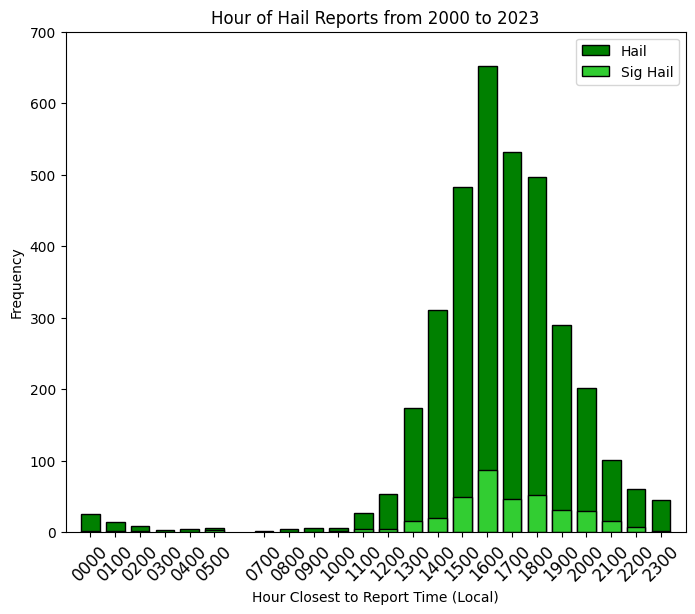
The bar plots below show the total number of hail reports per month (left) and hour of the day in local time (right) between 2000 and 2023 across our area. The month of June stands out as the month with the most documented hail reports with July ranked second. Hail across our area can still occur as early as March and has been reported as late in the year as October. As far as hour of the day goes, most hail reports are issued in the late afternoon and early evening with 4 PM local time having the highest frequency, but hail can still occur almost any time of the day. Significant hail (2 inches or greater) showed similar trends with the highest frequency also in June and the hour closest to reports was 4 PM local time. |
|
 |
 |
| Click to Enlarge Image | |
Hail Reports and Hail Days by Year |
|
|
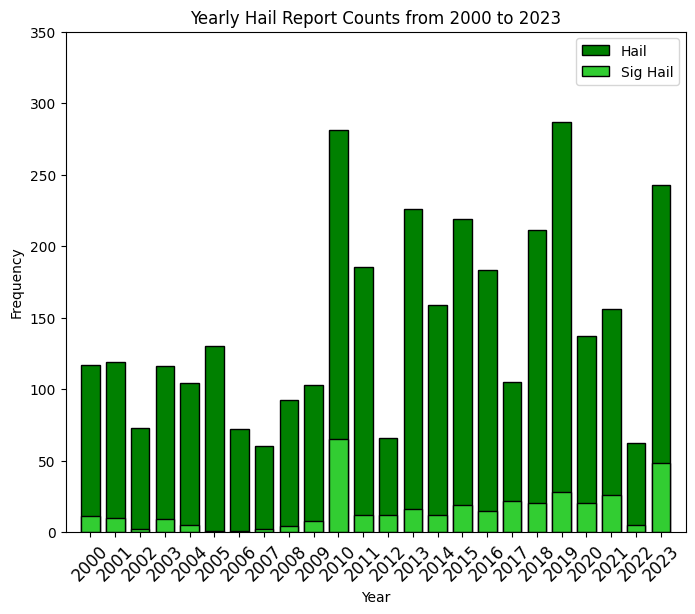
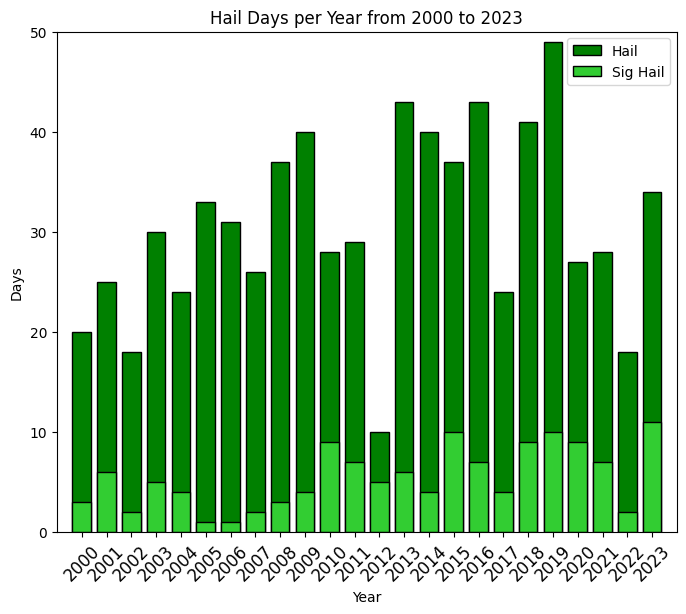
This next set of bar plots shows the number of reports (left) and days (right) of hail and significant hail (2 inches or greater) since 2000 within the NWS Cheyenne coverage area. Only 2 years in the period of record saw over 250 hail reports issued, being 2010 and 2019, with 2023 not too far away from that mark. While 2010 also saw the most significant hail reports issued, 2023 was the second highest. In order to normalize hail report counts per year, we also present the number of unique days per year with hail and significant hail being reported. While 2019 observed the most hail days per year at nearly 50 total, 2023 observed the most days with significant hail being reported across the NWS Cheyenne coverage area. |
|
 |
 |
| Click to Enlarge Image | |
Spatial Distribution of Hail Reports |
|
|
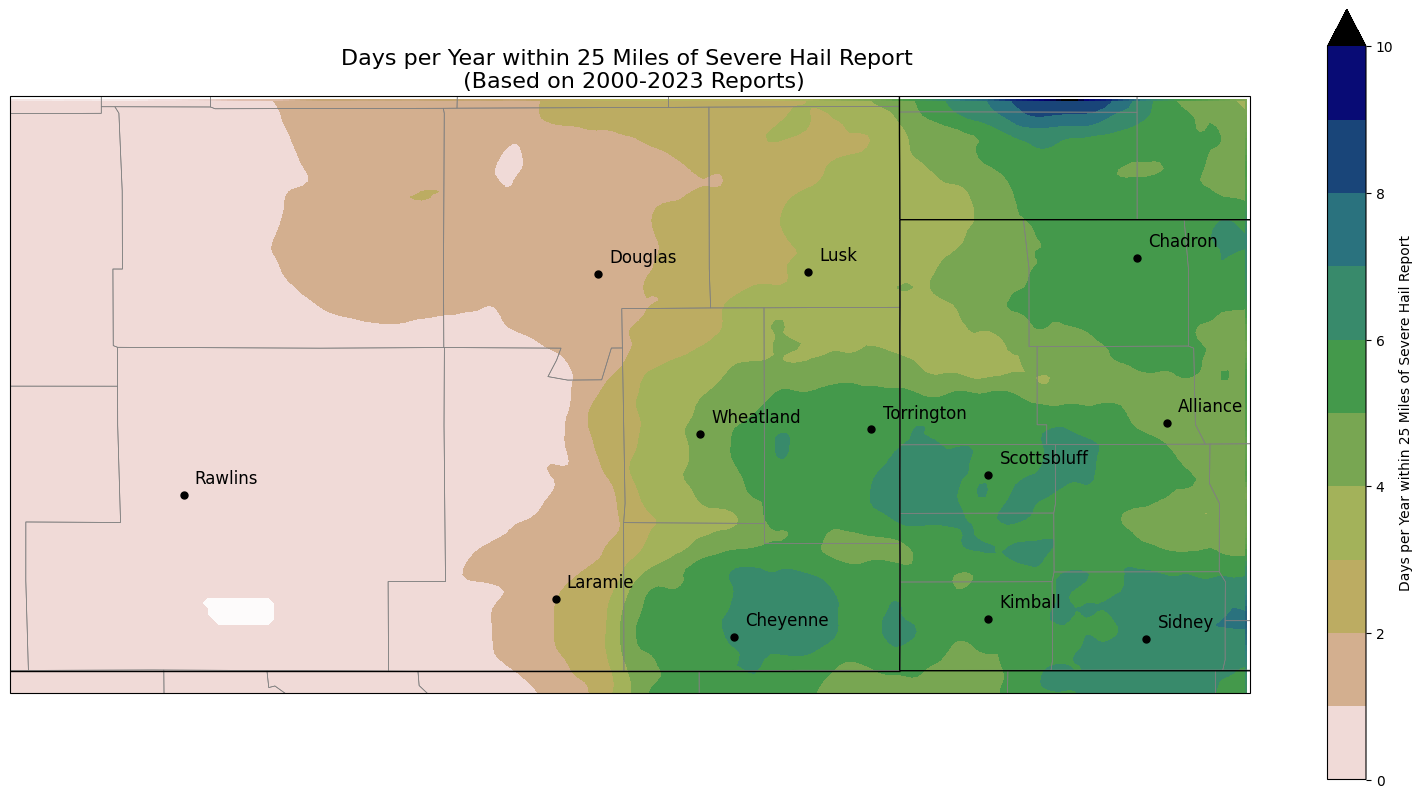
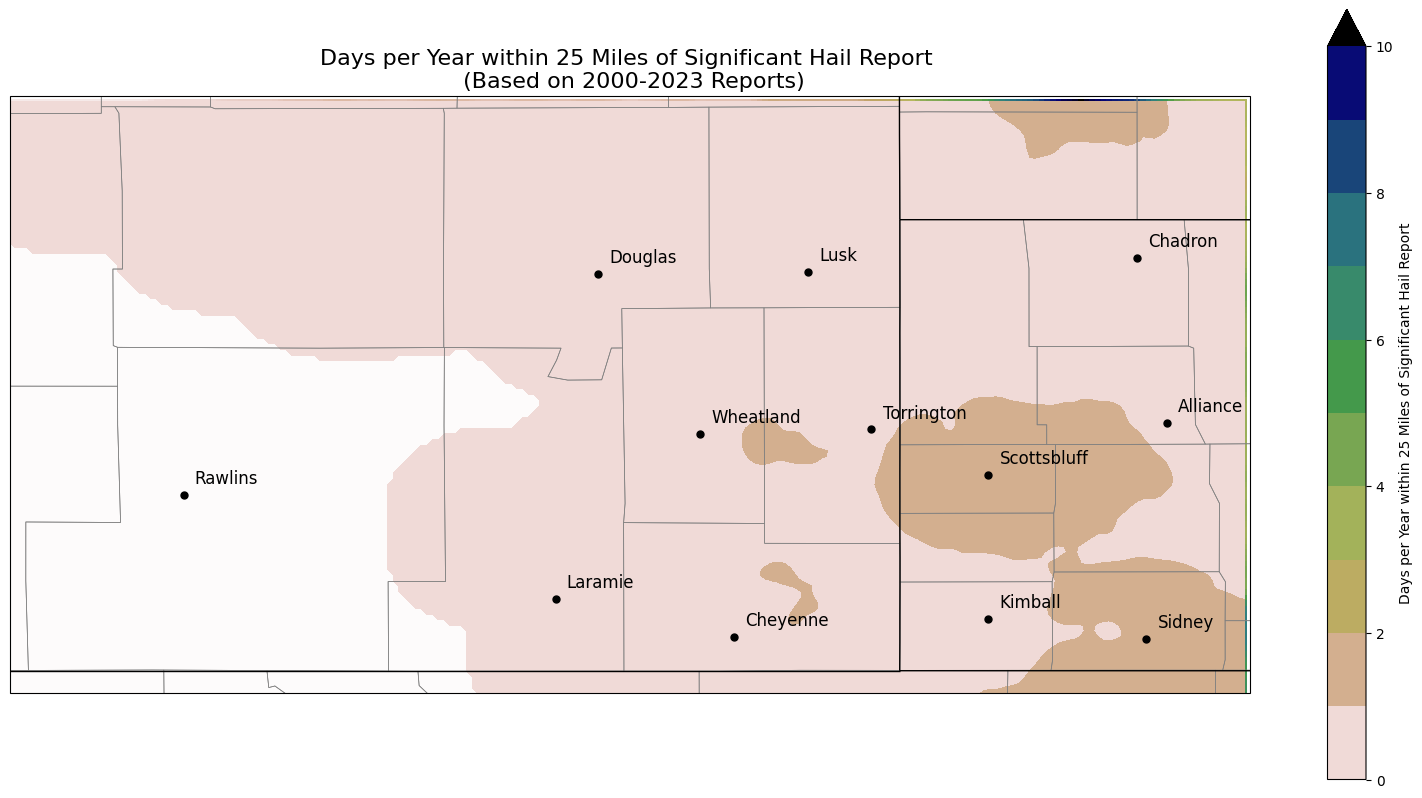
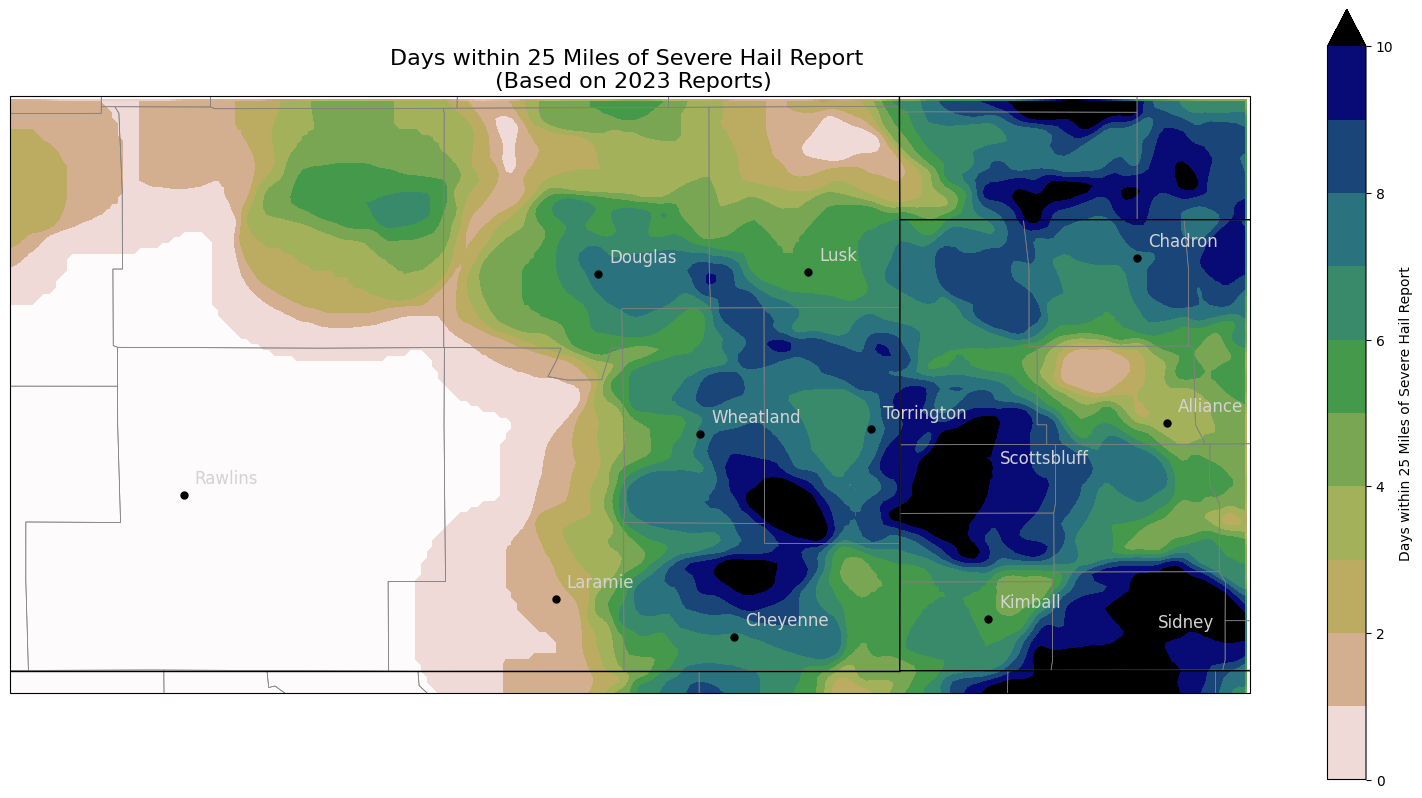
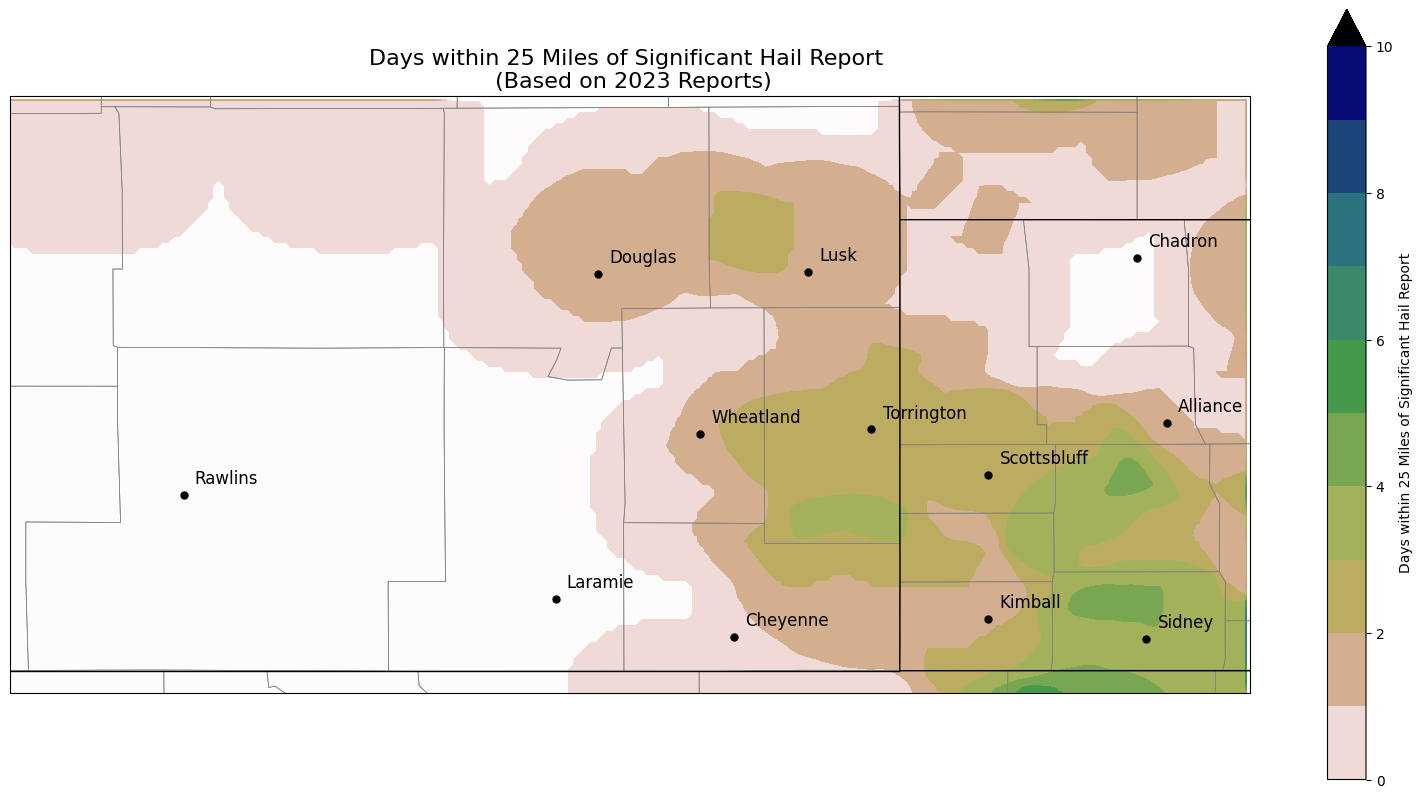
The following maps show the average number of hail days per year across southeast Wyoming and western Nebraska for severe hail greater than 1 inch diameter (upper left) and significant hail greater than 2 inch diameter (upper right). The images on the bottom row highlights the active Summer 2023 convective season compared to the climatological normal. A "hail day" was defined as a unique day with a hail report being located within 25 miles of any given location. In order to prevent inaccurate minimums from occurring along the CWA border, hail reports in neighboring counties from NWS Boulder, North Platte, Rapid City, Riverton, and Grand Junction CWAs were added to the database. On average, Cheyenne and Sidney (and surrounding areas) observe over 6 days per year with reports of severe hail in the vicinity. Additionally, the North Platte River valley from the Platte/Goshen County line through Scottsbluff observe 5-6 days per year of severe hail. The northern Nebraska panhandle, specifically Dawes County, also observes around 5 days per year of severe hail with the maximum extending northward towards the Black Hills. As far as significant hail days, Scottsbluff and Sidney are the two bullseyes with 1-2 days per year. For Summer 2023, most areas saw well above average numbers of severe hail and significant hail days. Certain areas had 10+ days in 2023 with severe hail reported in the area, including north of Cheyenne, Scottsbluff, and Sidney. Portions of Cheyenne and Morrill Counties in Nebraska observed over 4 days in 2023 with significant hail reported nearby. One caveat with these maps is the spatial distribution of population density and road networks that likely leads to certain areas under-reporting occurrences of severe hail. Specifically, northern Converse and Niobrara Counties in east-central Wyoming and Sioux County in northwest Nebraska can see their fair share of severe thunderstorms, but population is sparse in these areas. |
|
 |
 |
 |
 |
| Click to Enlarge Map | |
Probability of Hail Reports Throughout the Calendar Year |
|||
|
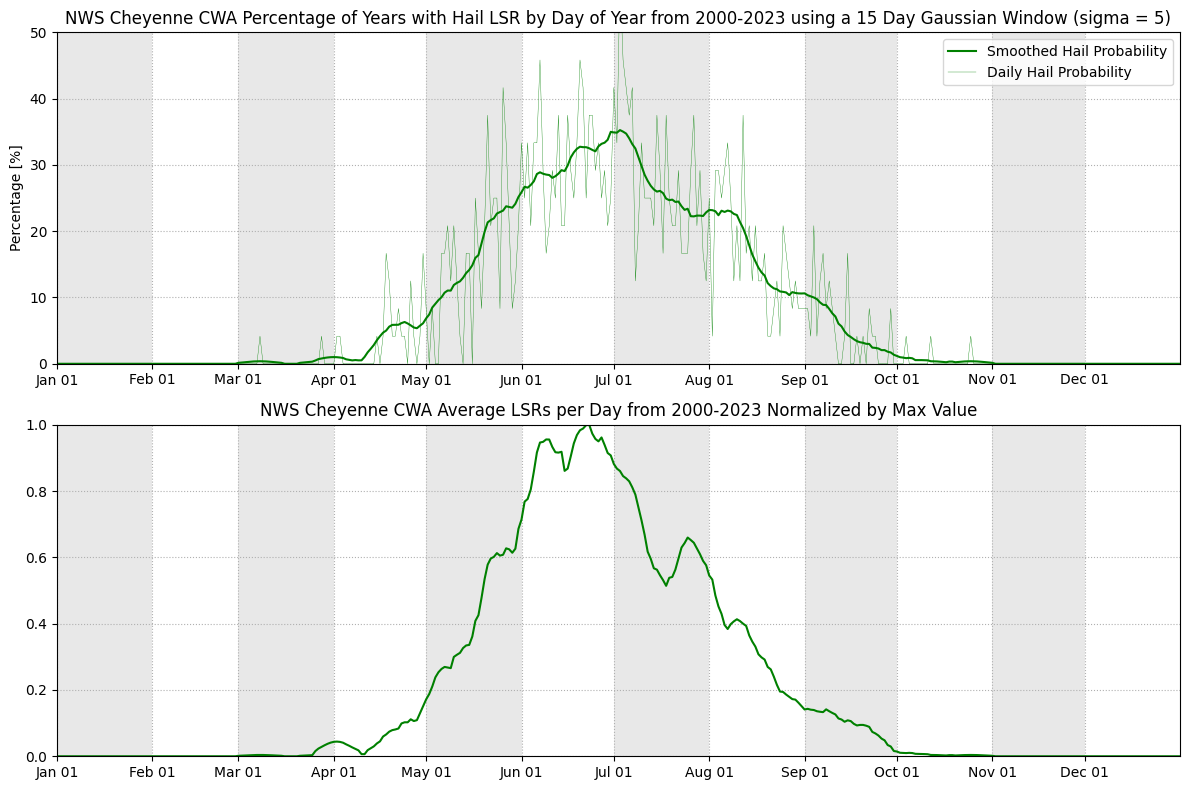
The calendar time series plots below highlight the time of year when hail is most likely to occur across the region. The percentage of years with a hail report was calculated over the period of record from 2000 to 2023 on each day of the calendar year. This data was then smoothed using a 15-day moving window to determine the probability of receiving a hail report for any day in the calendar year (top). Overall, the probability of receiving a hail report on any given day across the NWS Cheyenne CWA is around 35% near the start of July. Daily probabilities exceeding 10% start in the beginning of May and continue until early September. Additionally, the average LSRs per day normalized by maximum value plots (bottom) highlight the peak times for hail throughout the year across the NWS Cheyenne CWA. The peak of hail season occurs in June with a secondary maximum in late July for the NWS Cheyenne CWA. The following plots break down these probabilities by individual counties across southeast Wyoming and western Nebraska. The same caveat with the previous maps applies here as each county has varying population density and road networks that could lead to under-reporting occurrences of hail. |
|||
 |
|||
| Click to Enlarge Image | |||
|
|
|||
Southeast Wyoming Counties |
|||
Albany Co
|
Carbon Co
|
Converse Co
|
|
Goshen Co
|
Laramie Co
|
Niobrara Co
|
|
Platte Co
|
|||
| Click to Enlarge Image | |||
|
|
|||
Western Nebraska Counties |
|||
Banner Co
|
Box Butte Co
|
Cheyenne Co
|
|
Dawes Co
|
Kimball Co
|
Morrill Co
|
|
Scotts Bluff Co
|
Sioux Co
|
||
| Click to Enlarge Image | |||


 Weather Story
 Weather Map
 Local Radar