This page is undergoing development. Some links may not be functional, and you may observe layout changes. Please send comments, questions or suggestions regarding this page to bruno.rodriguez@noaa.gov
The HDWI is computed by multiplying maximum sustained wind speed and vapor pressure deficit in the lowest ~50 mb of the atmosphere. Heat, moisture, and wind are thus incorporated (fuels are not). Model input for HDWI computation comes from the GFS Ensemble system (GEFS), which is a suite of relatively coarse resolution global ensembles. Therefore, it can provide an effective, simple view to highlight days which are more likely to have adverse atmospheric conditions surrounding wildland fires for a general geographic area. It is not ideal for assessing conditions at the most local level given the native GEFS resolution. For more plots and information on the HDWI, visit this page
Probability of HDWI Exceeding...
Day 0
Day 1
Day 2
Day 3
Day 4
Day 5
Day 6
75th Percentile
90th Percentile
US Drought Monitor
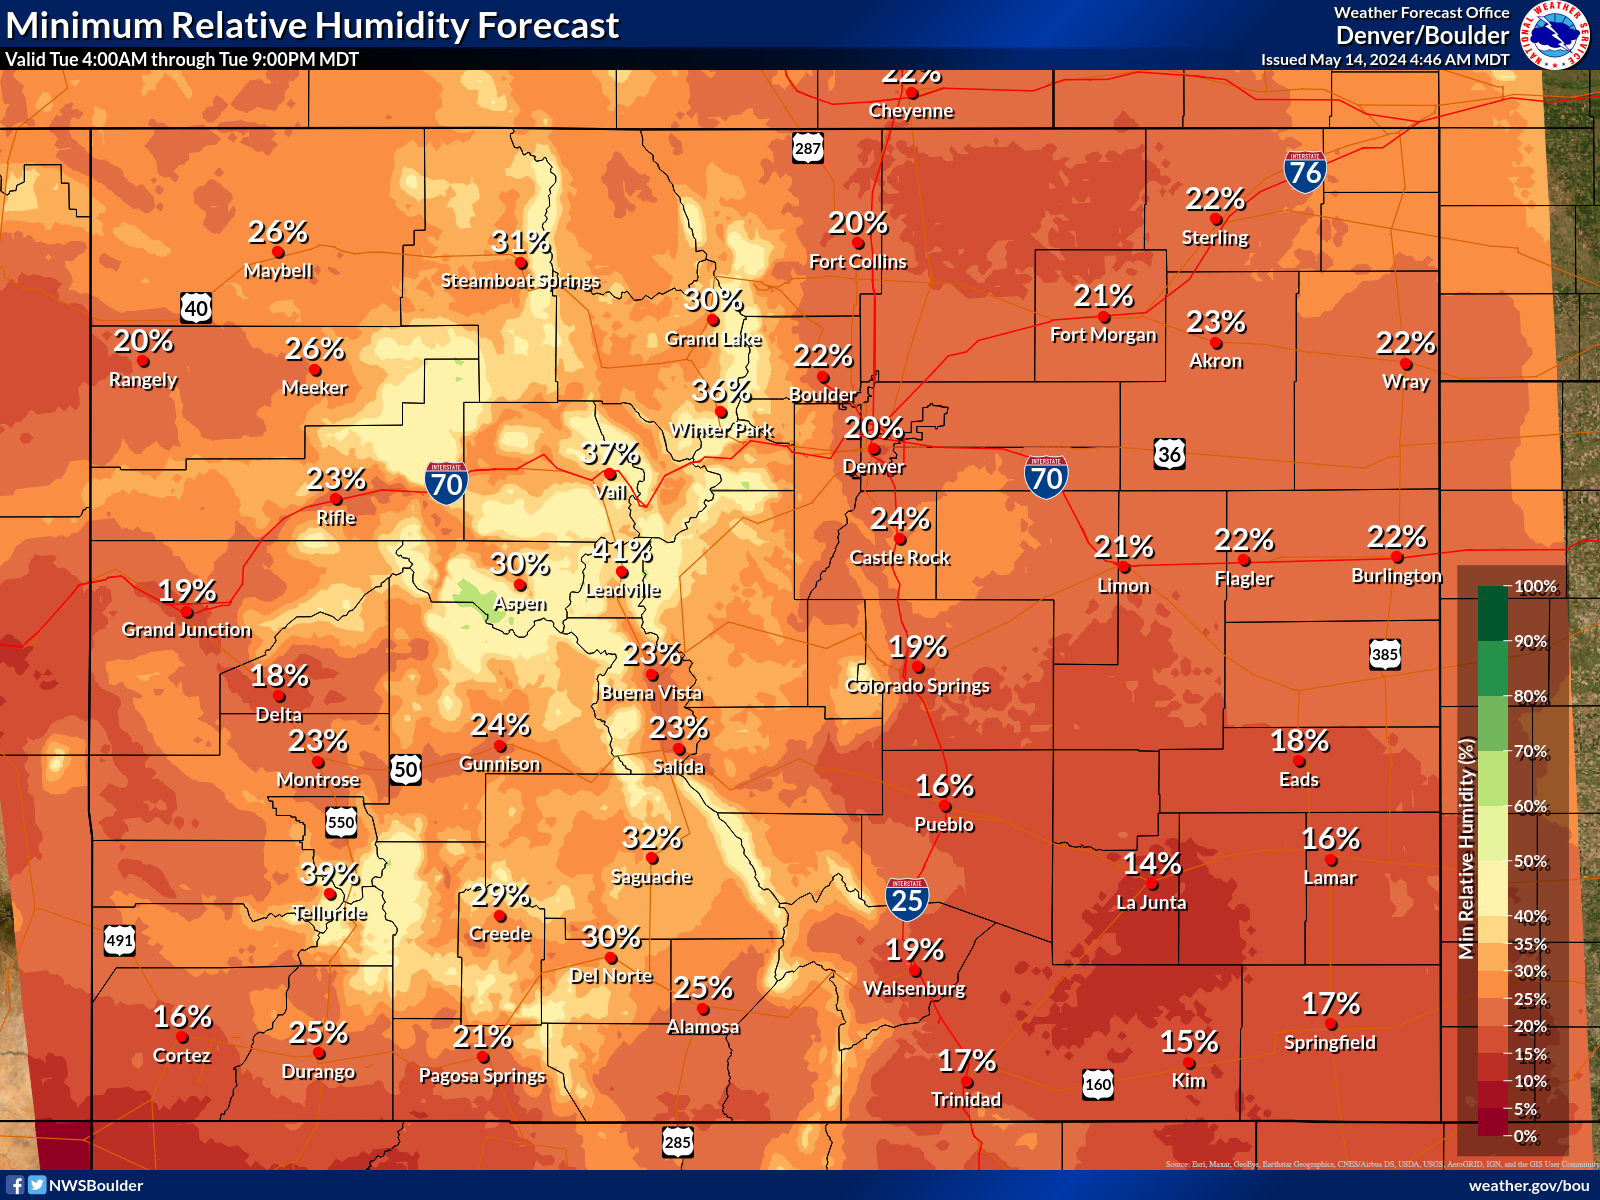
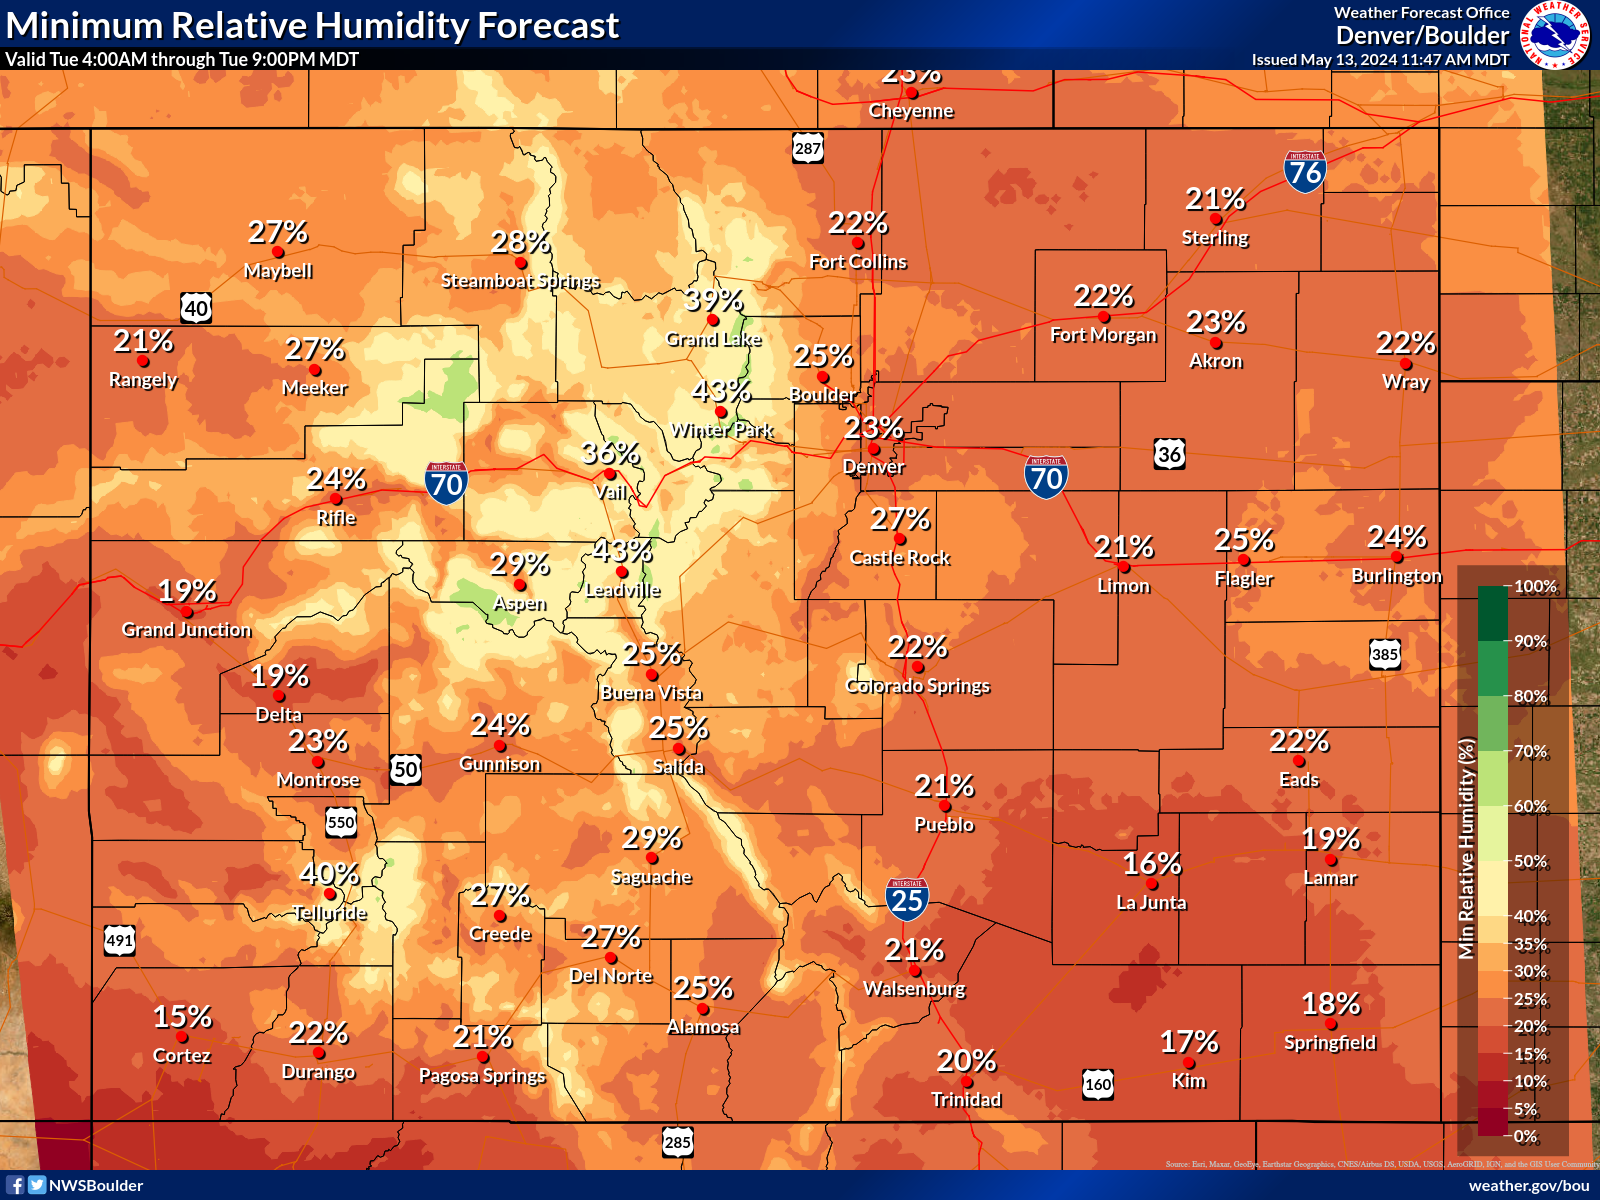
Vapor Pressure Deficit (VPD)
Vapor Pressure Deficit (VPD) is an effective measure to describe the ability of the atmosphere to extract moisture from vegetation. While Relative Humidity (RH) is most frequently referenced in relation to wildland fire, in part given its more intuitive nature, RH can also mask critical information, as it does not directly take the effects of temperature into consideration (a factor that can aggravate moisture loss from vegetation). For more information on VPD, see this article by Seager et al.
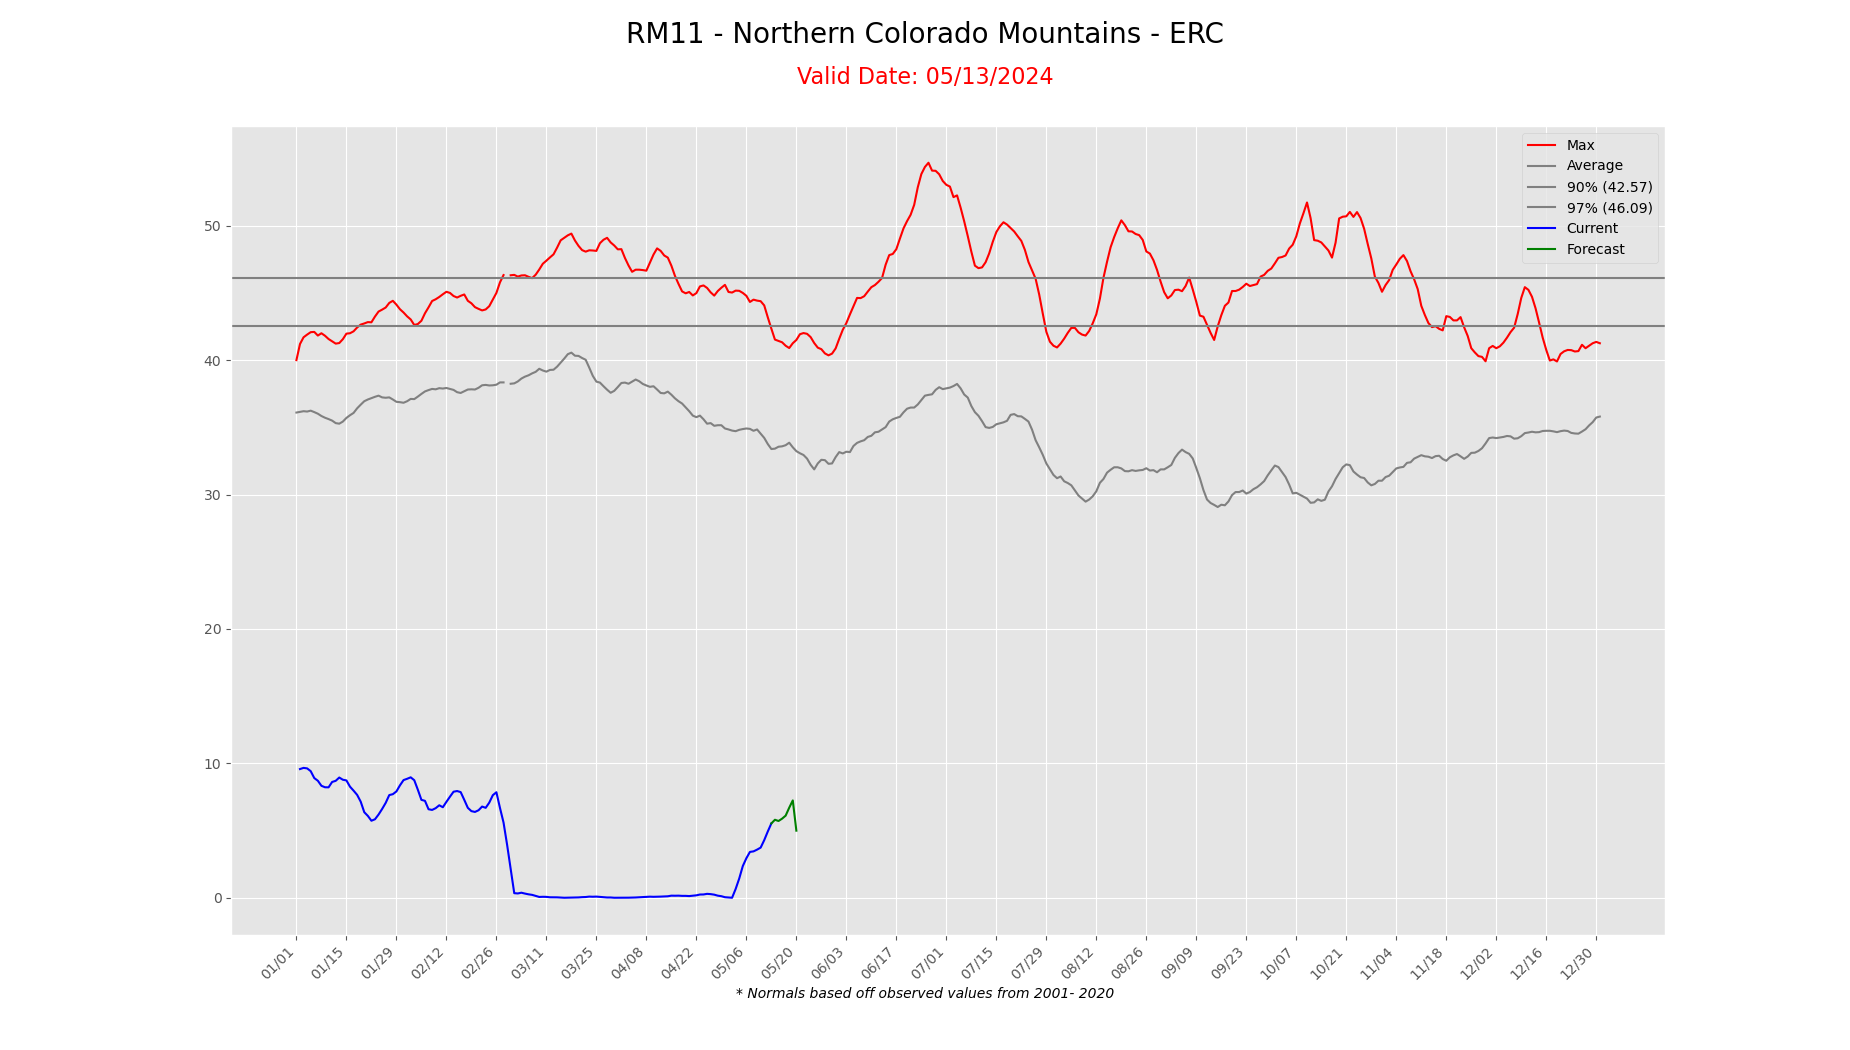
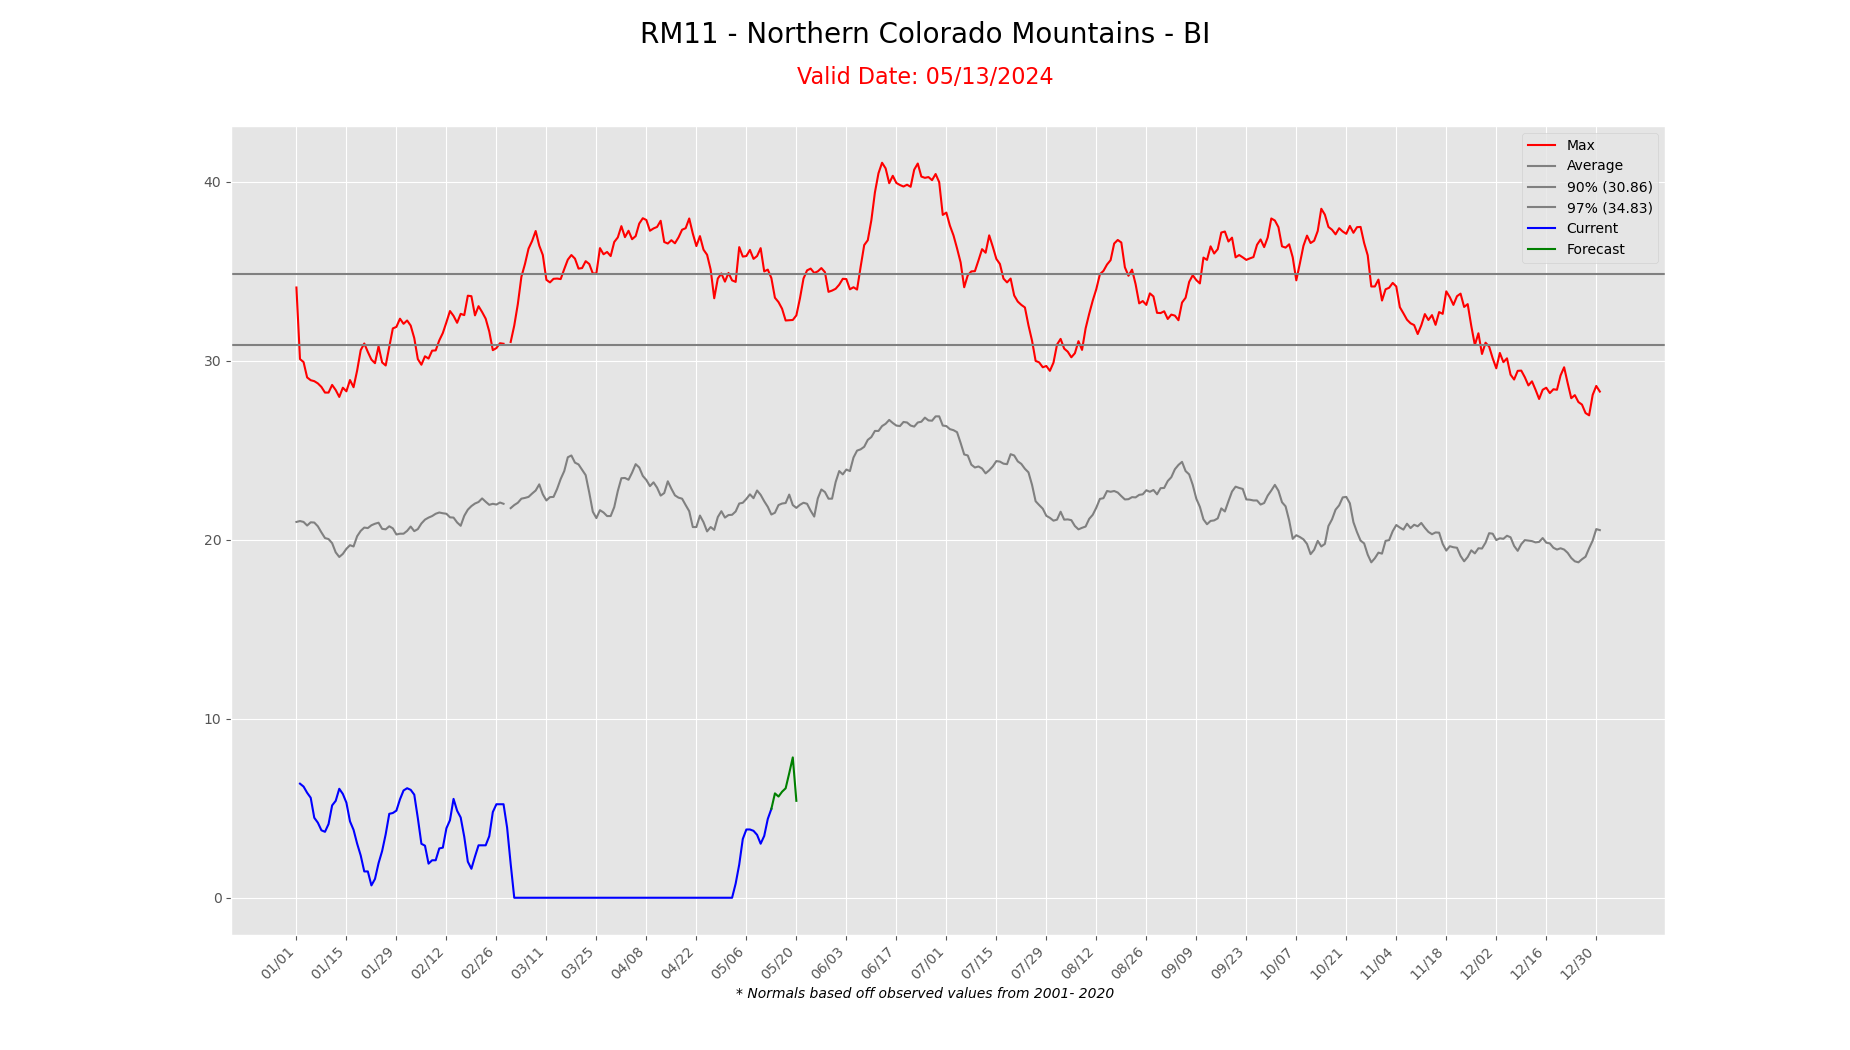
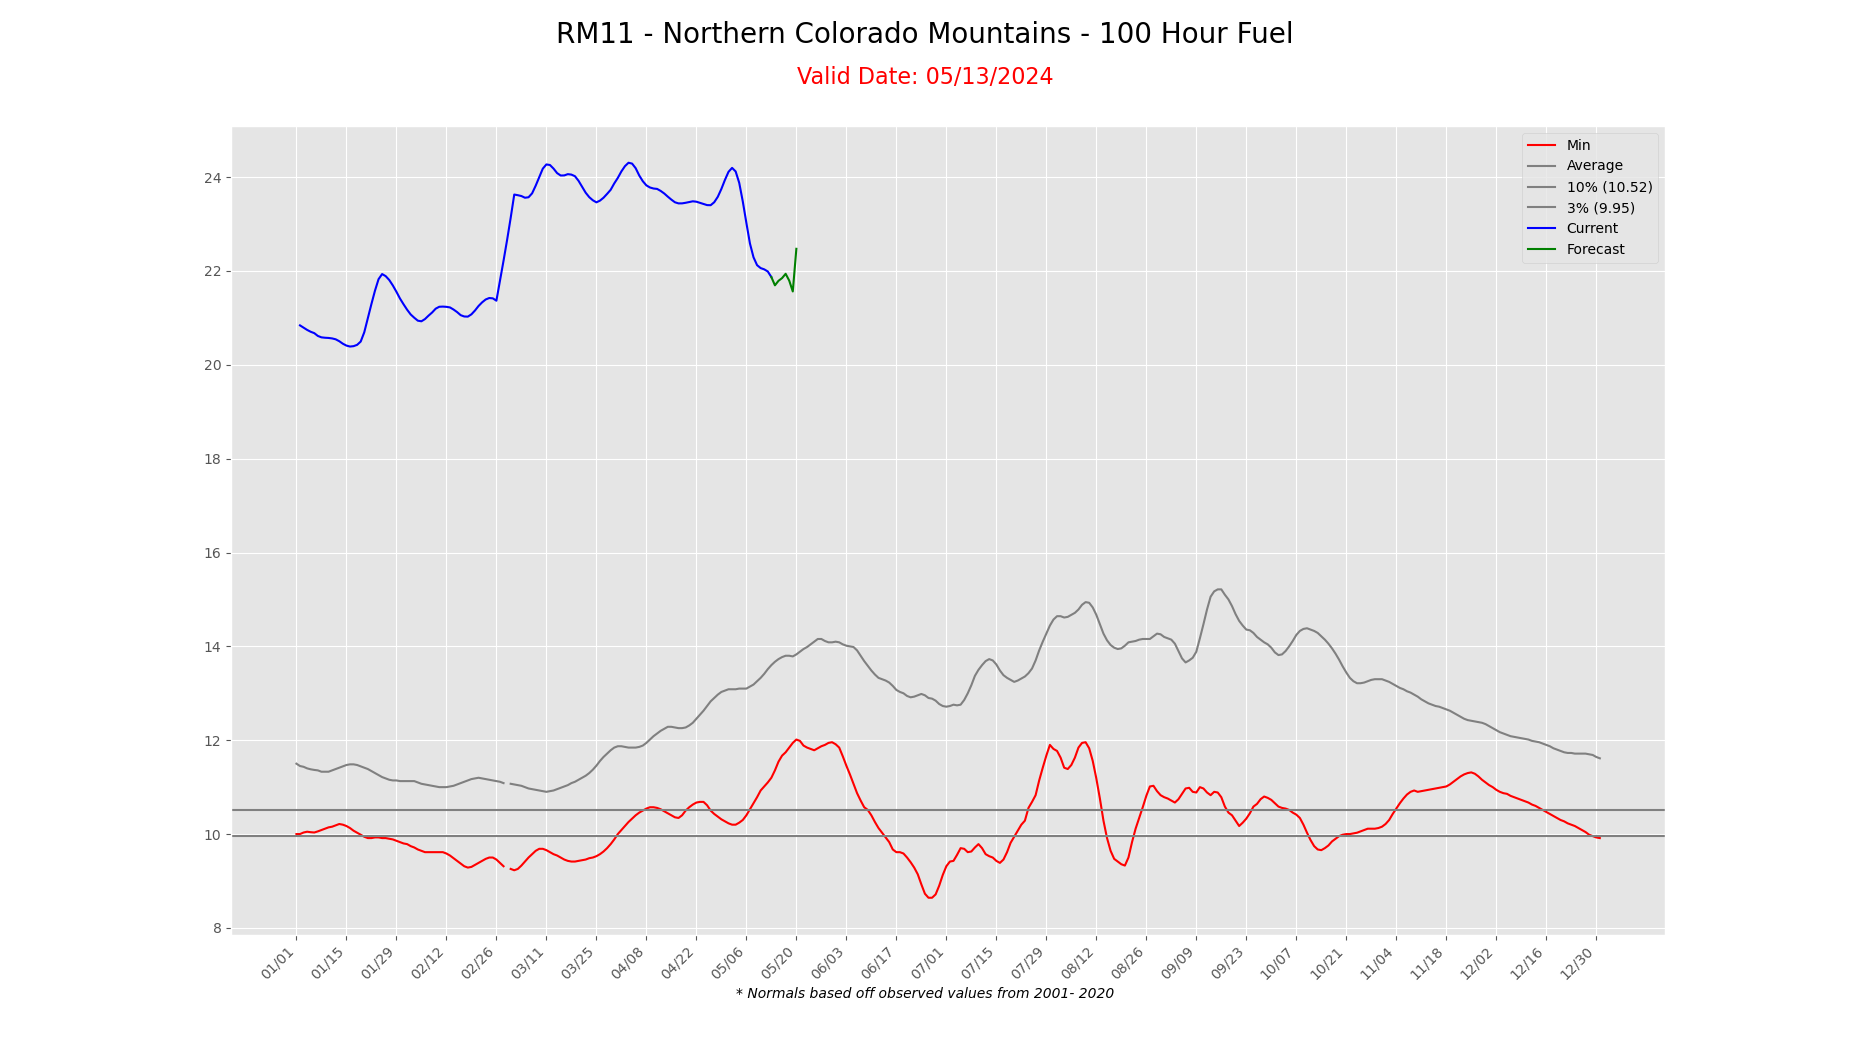
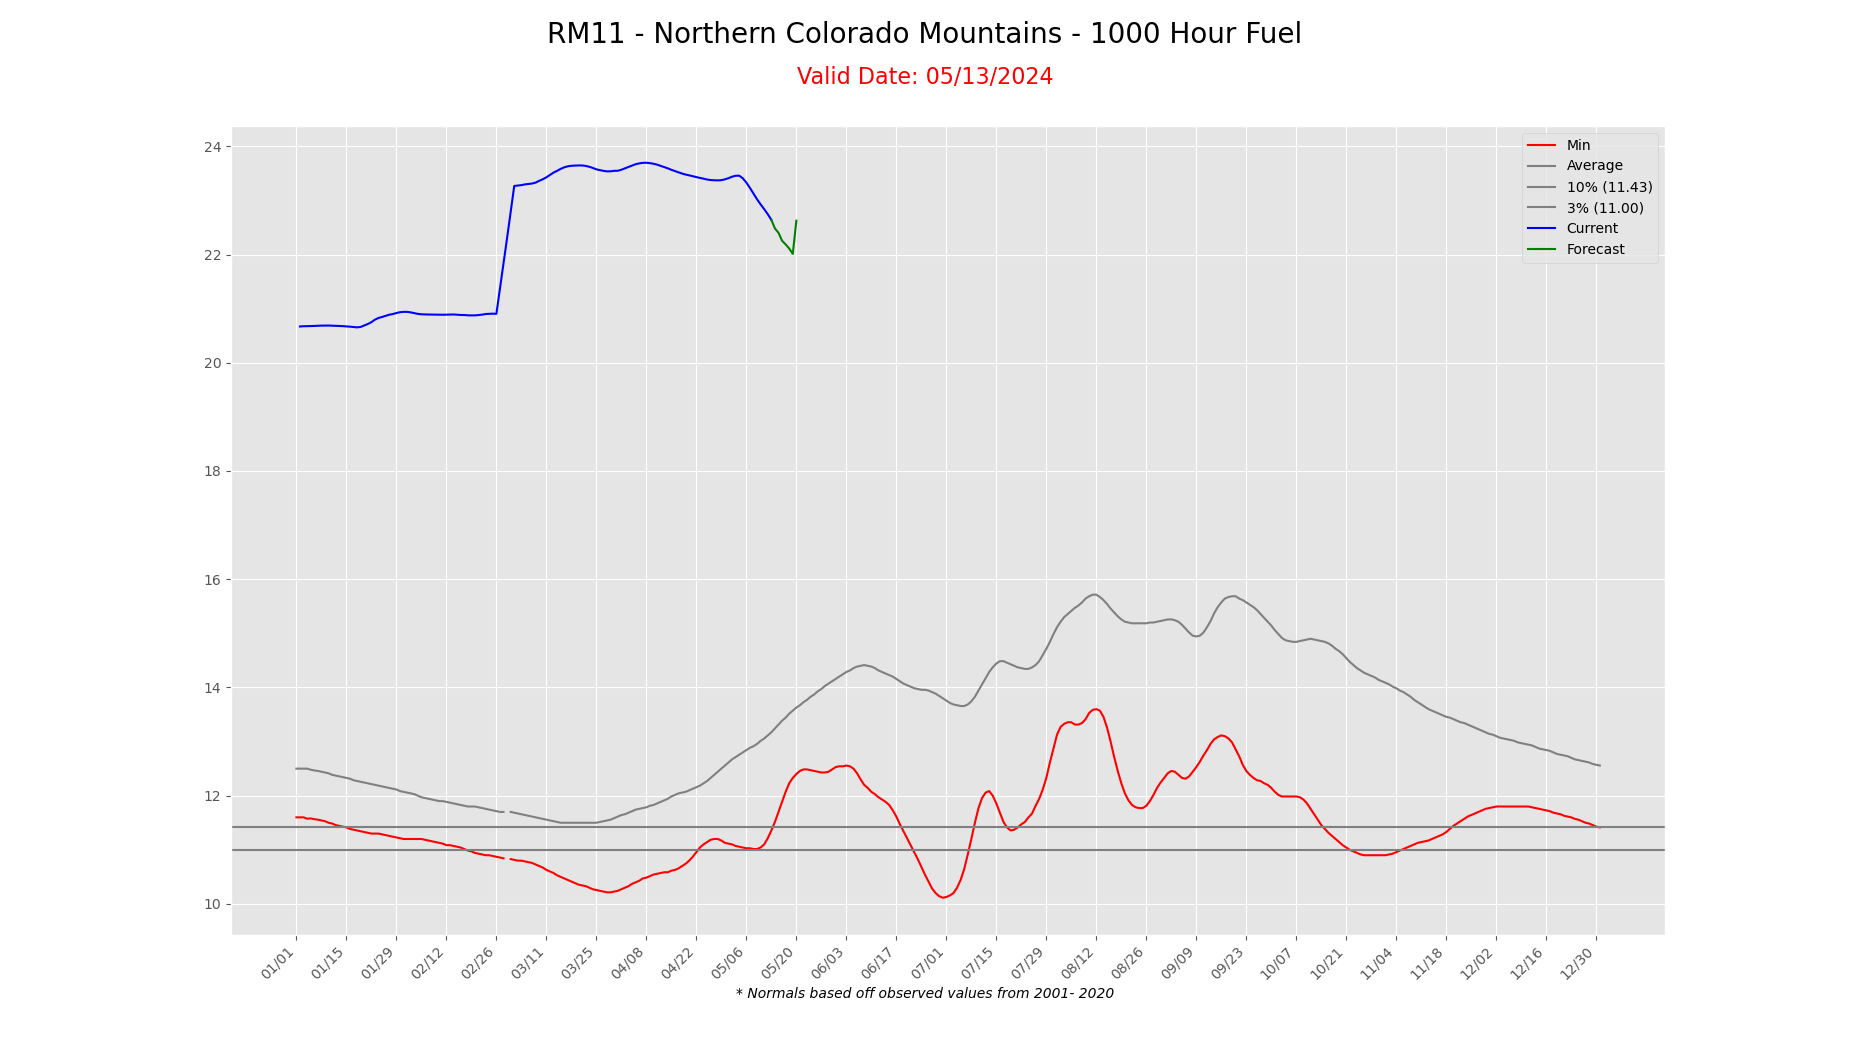
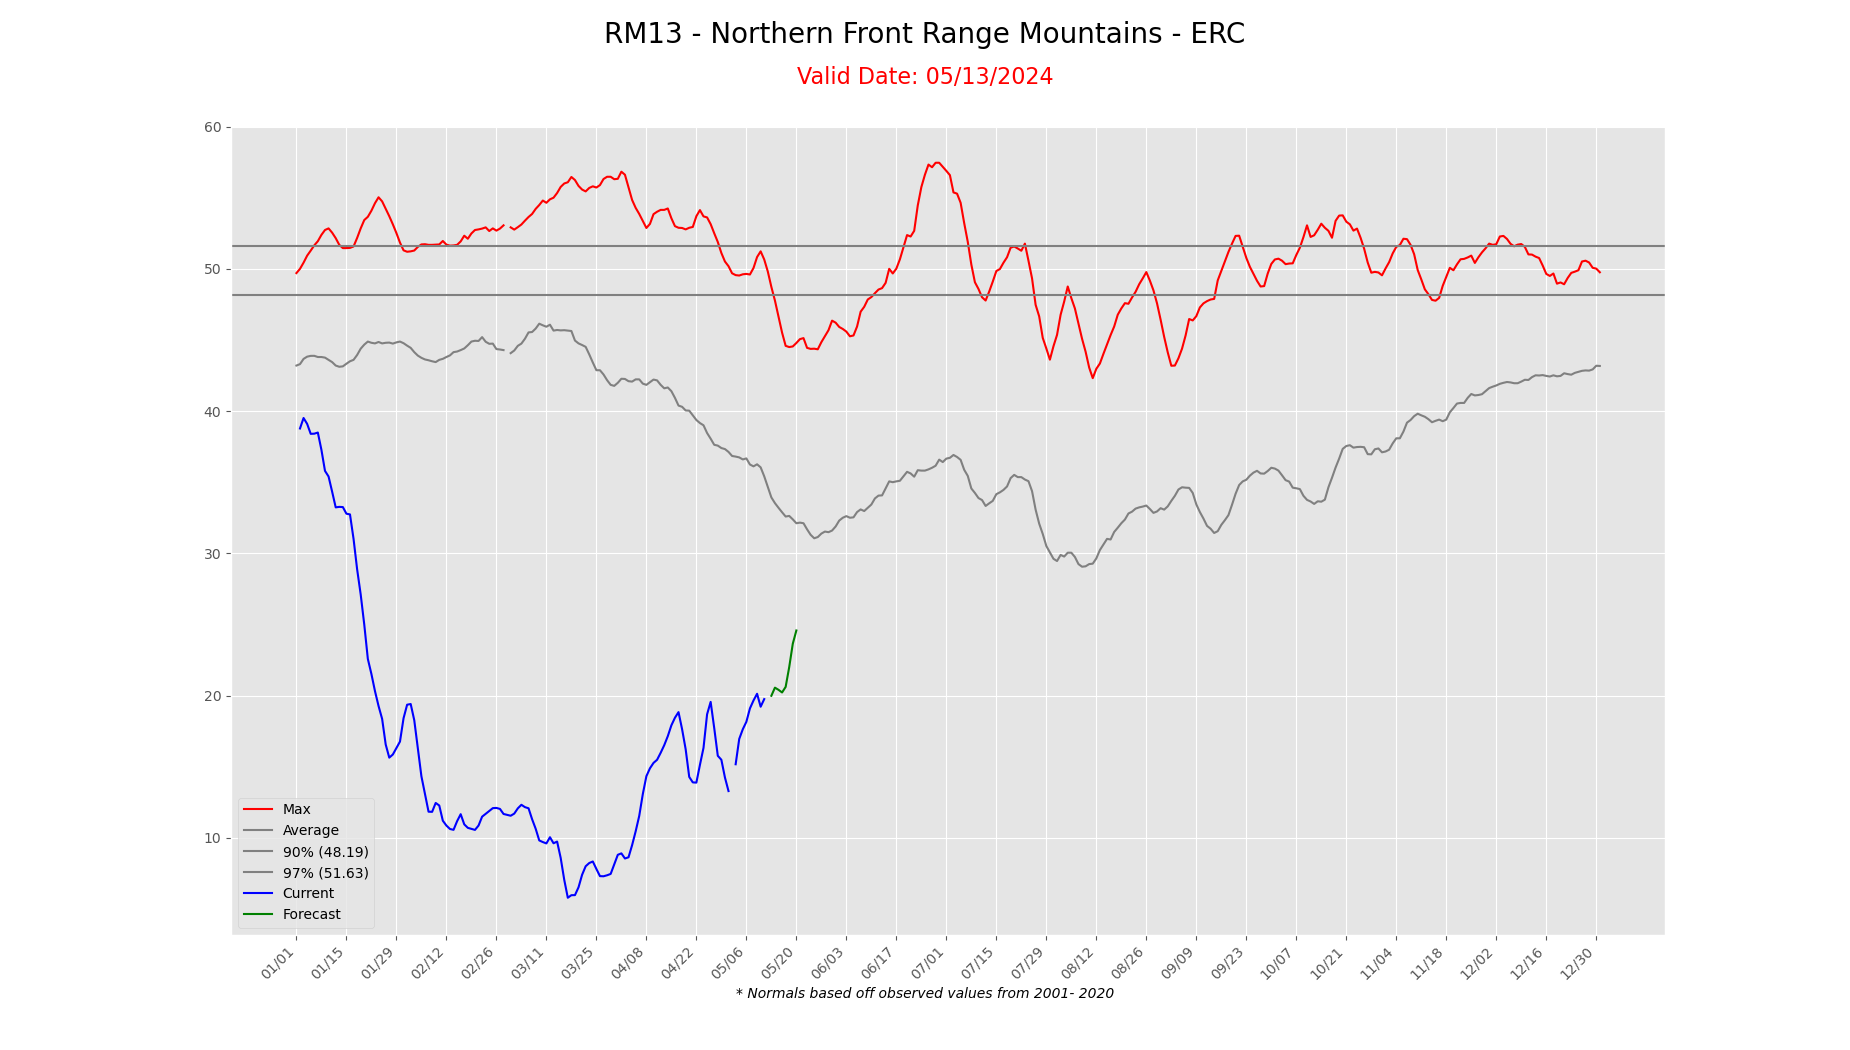
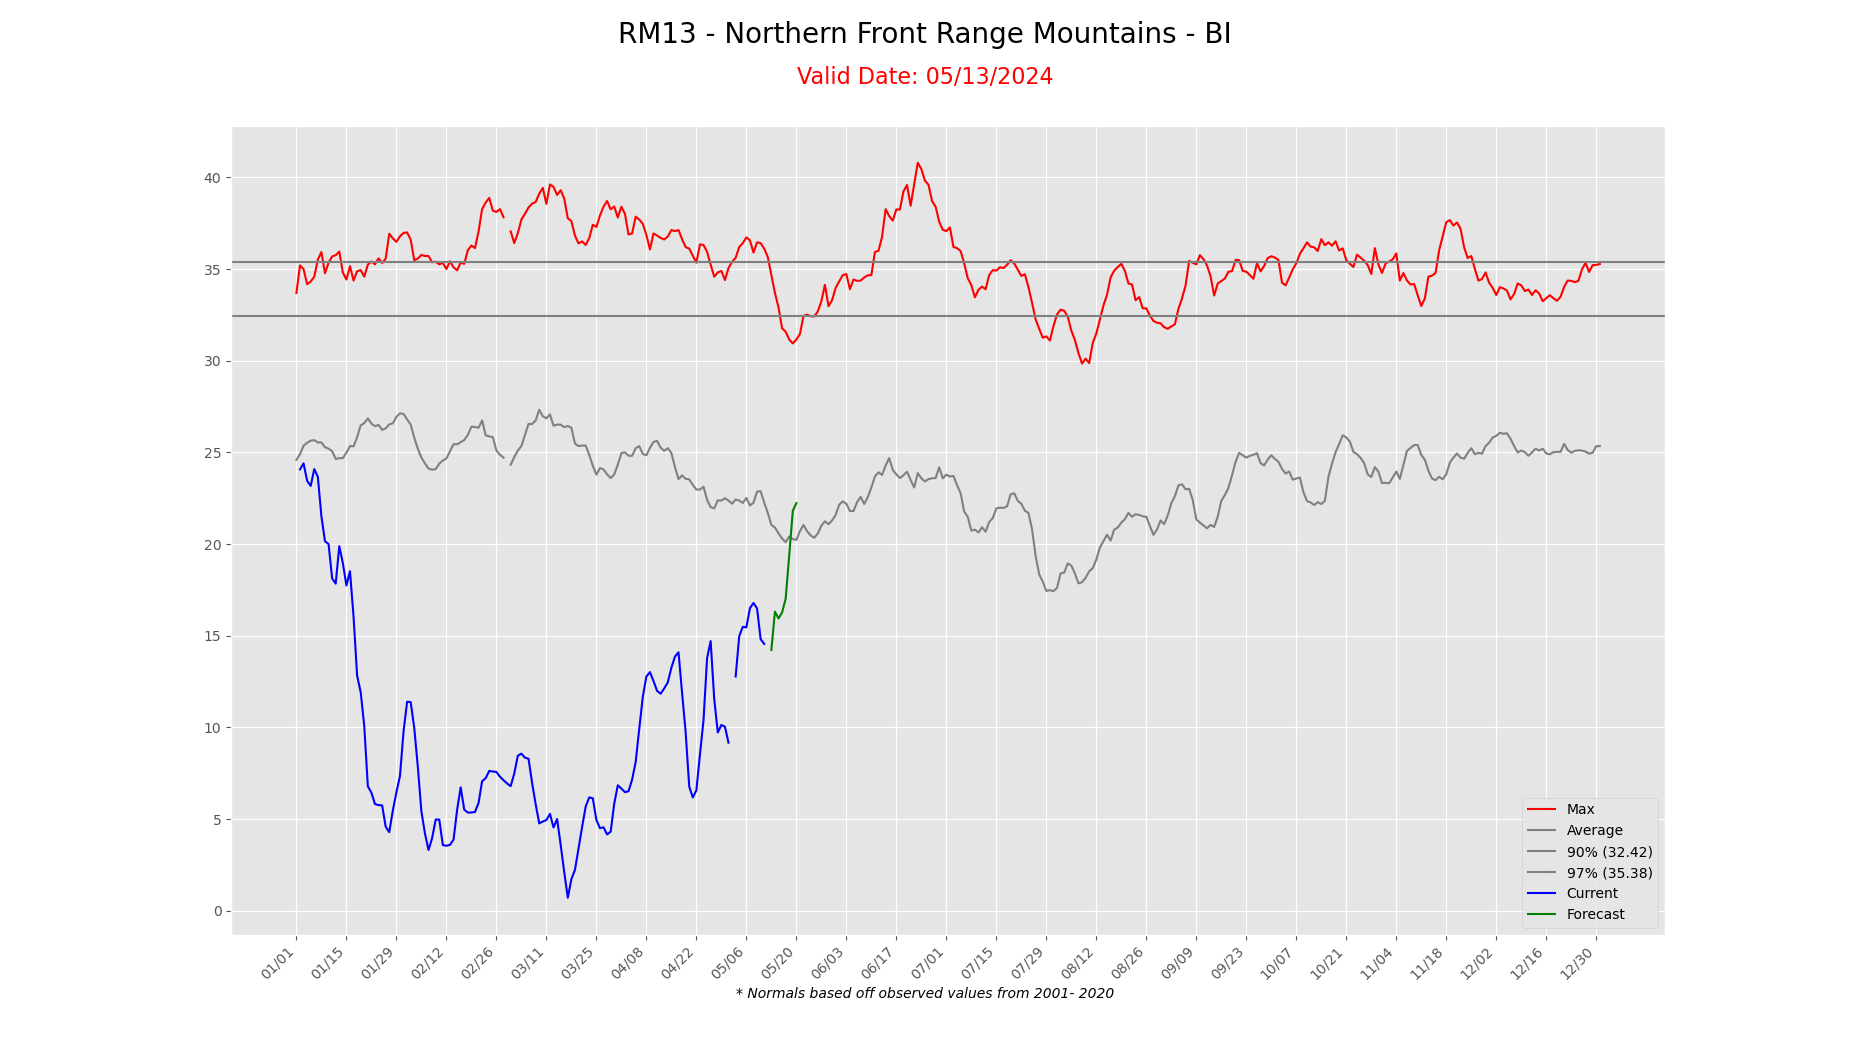
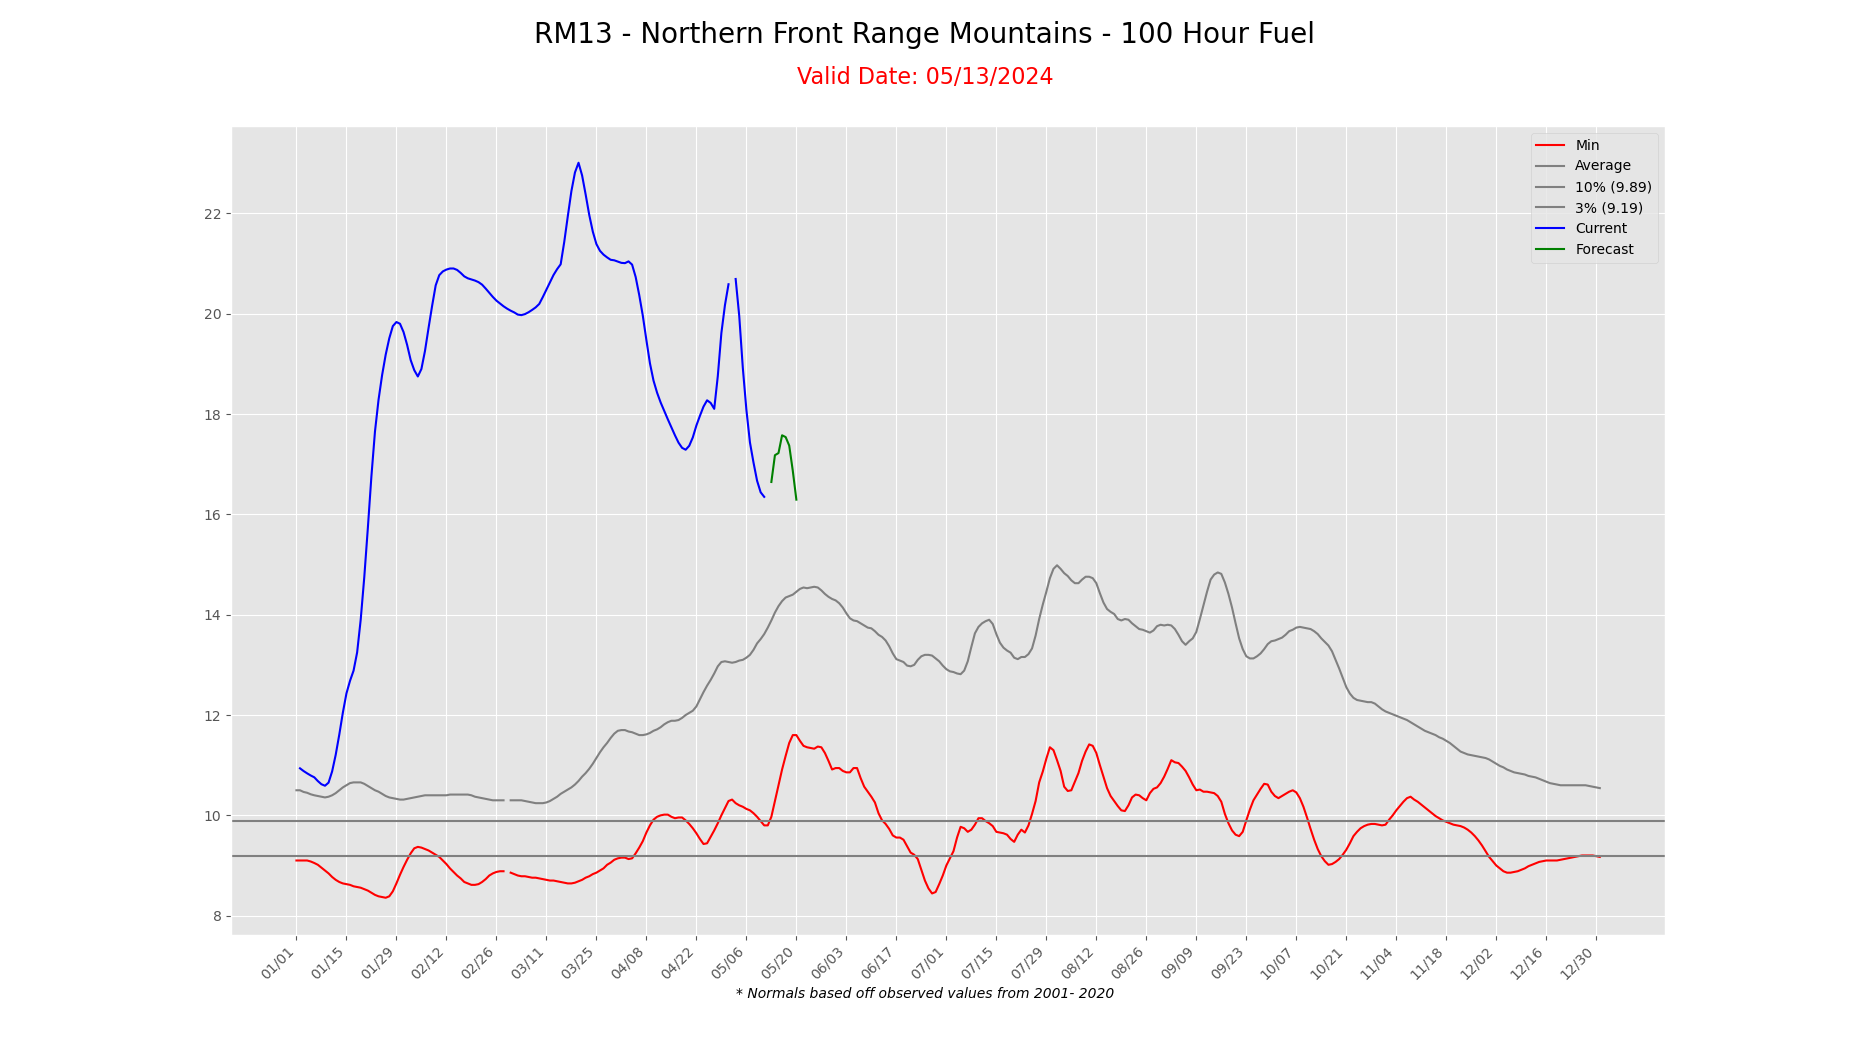
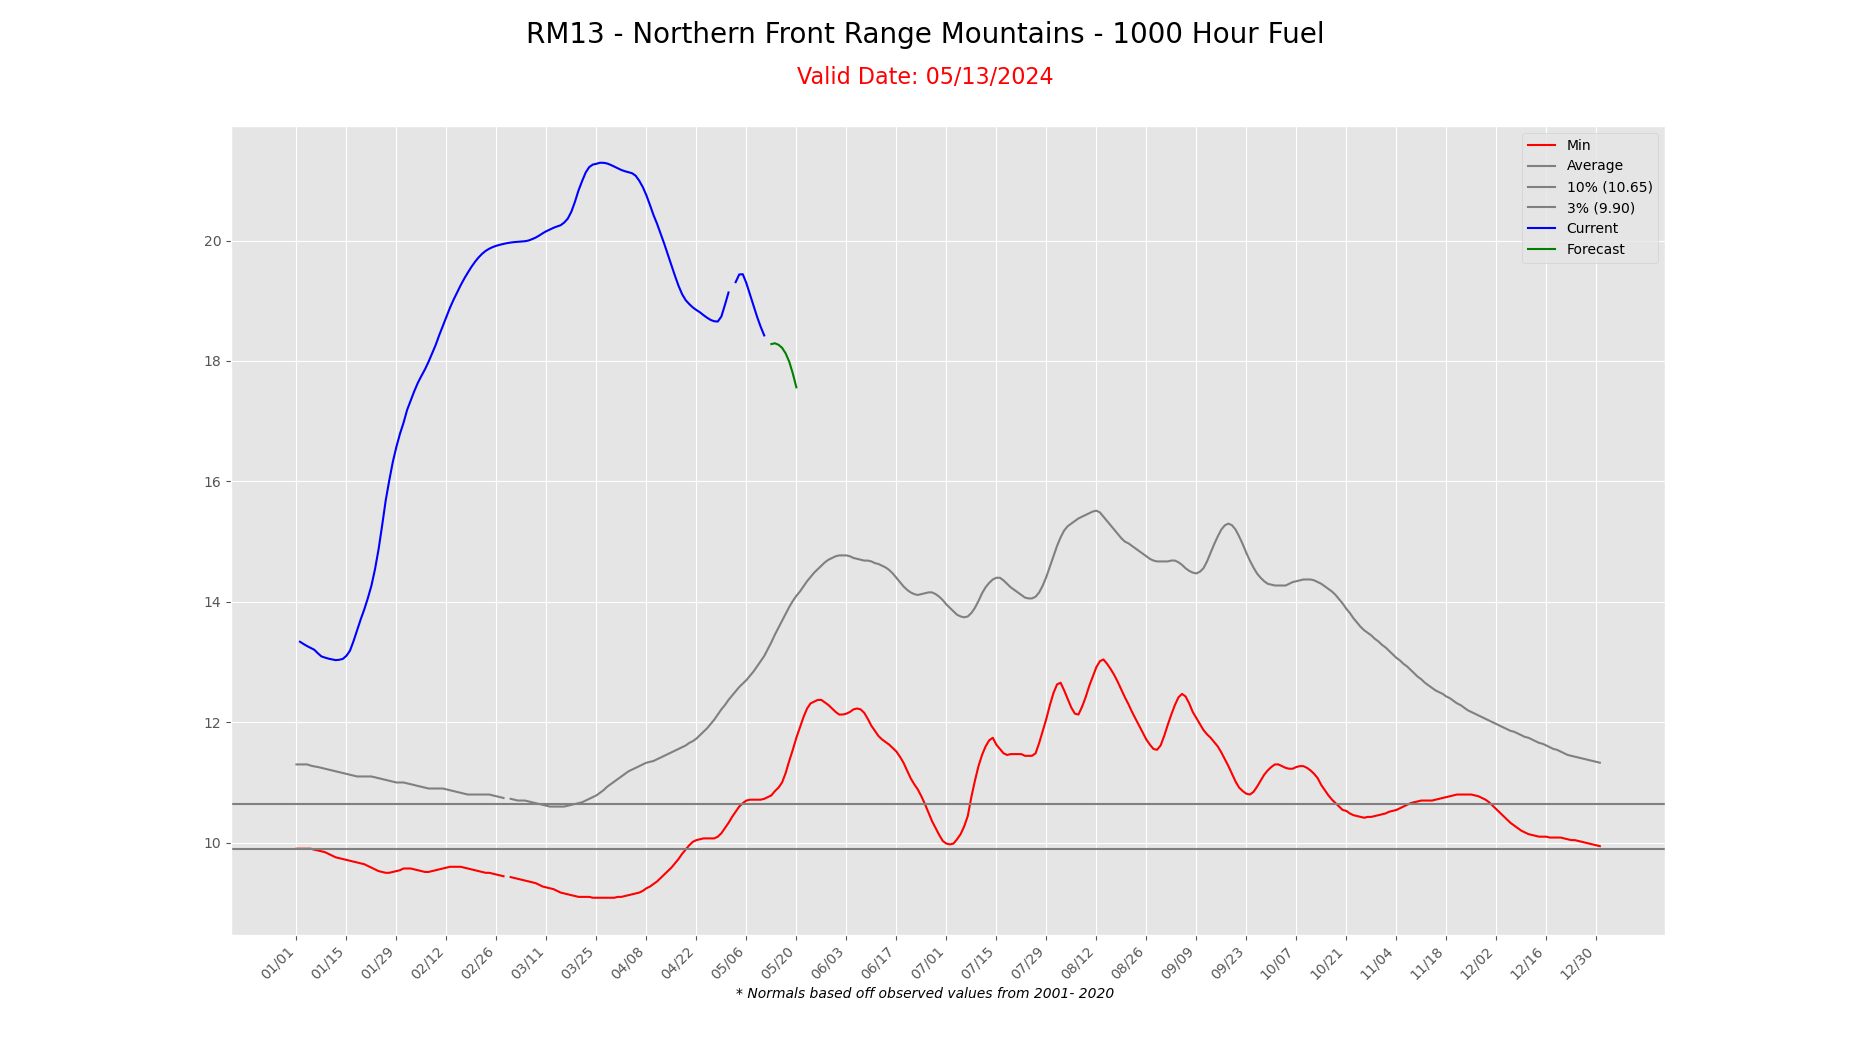
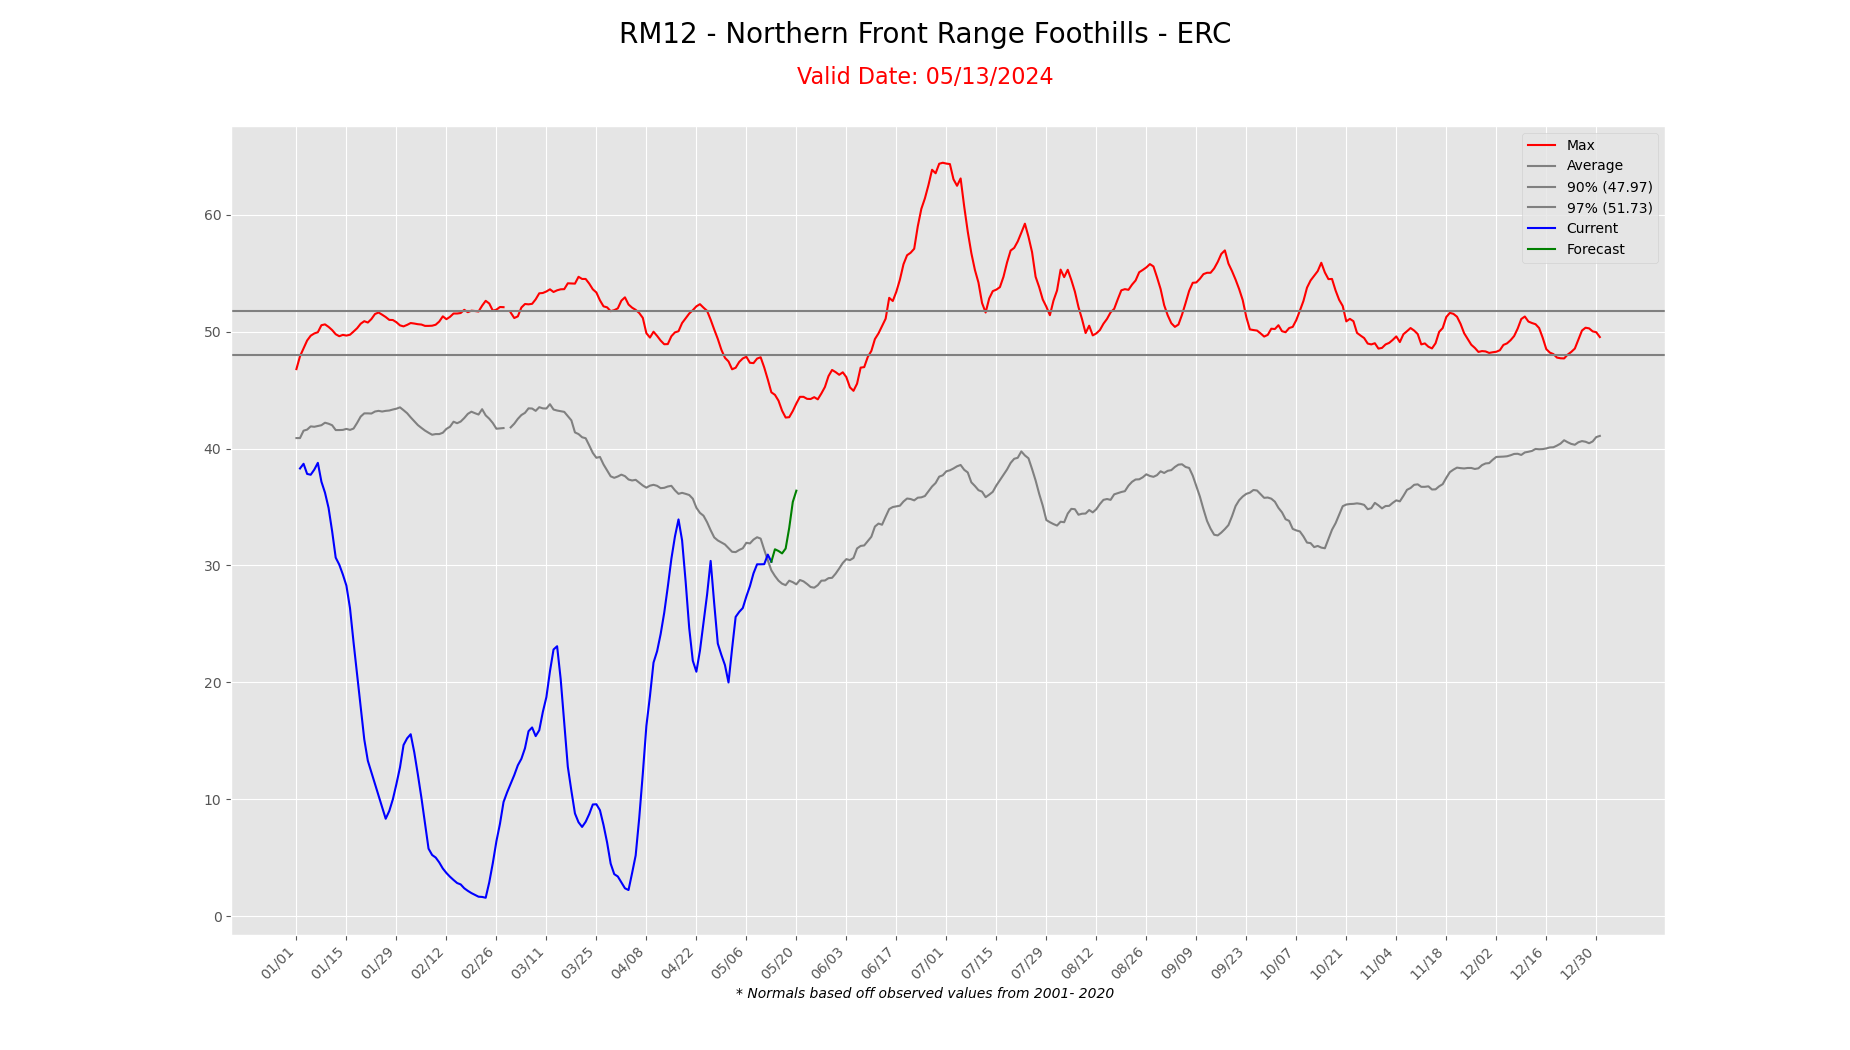
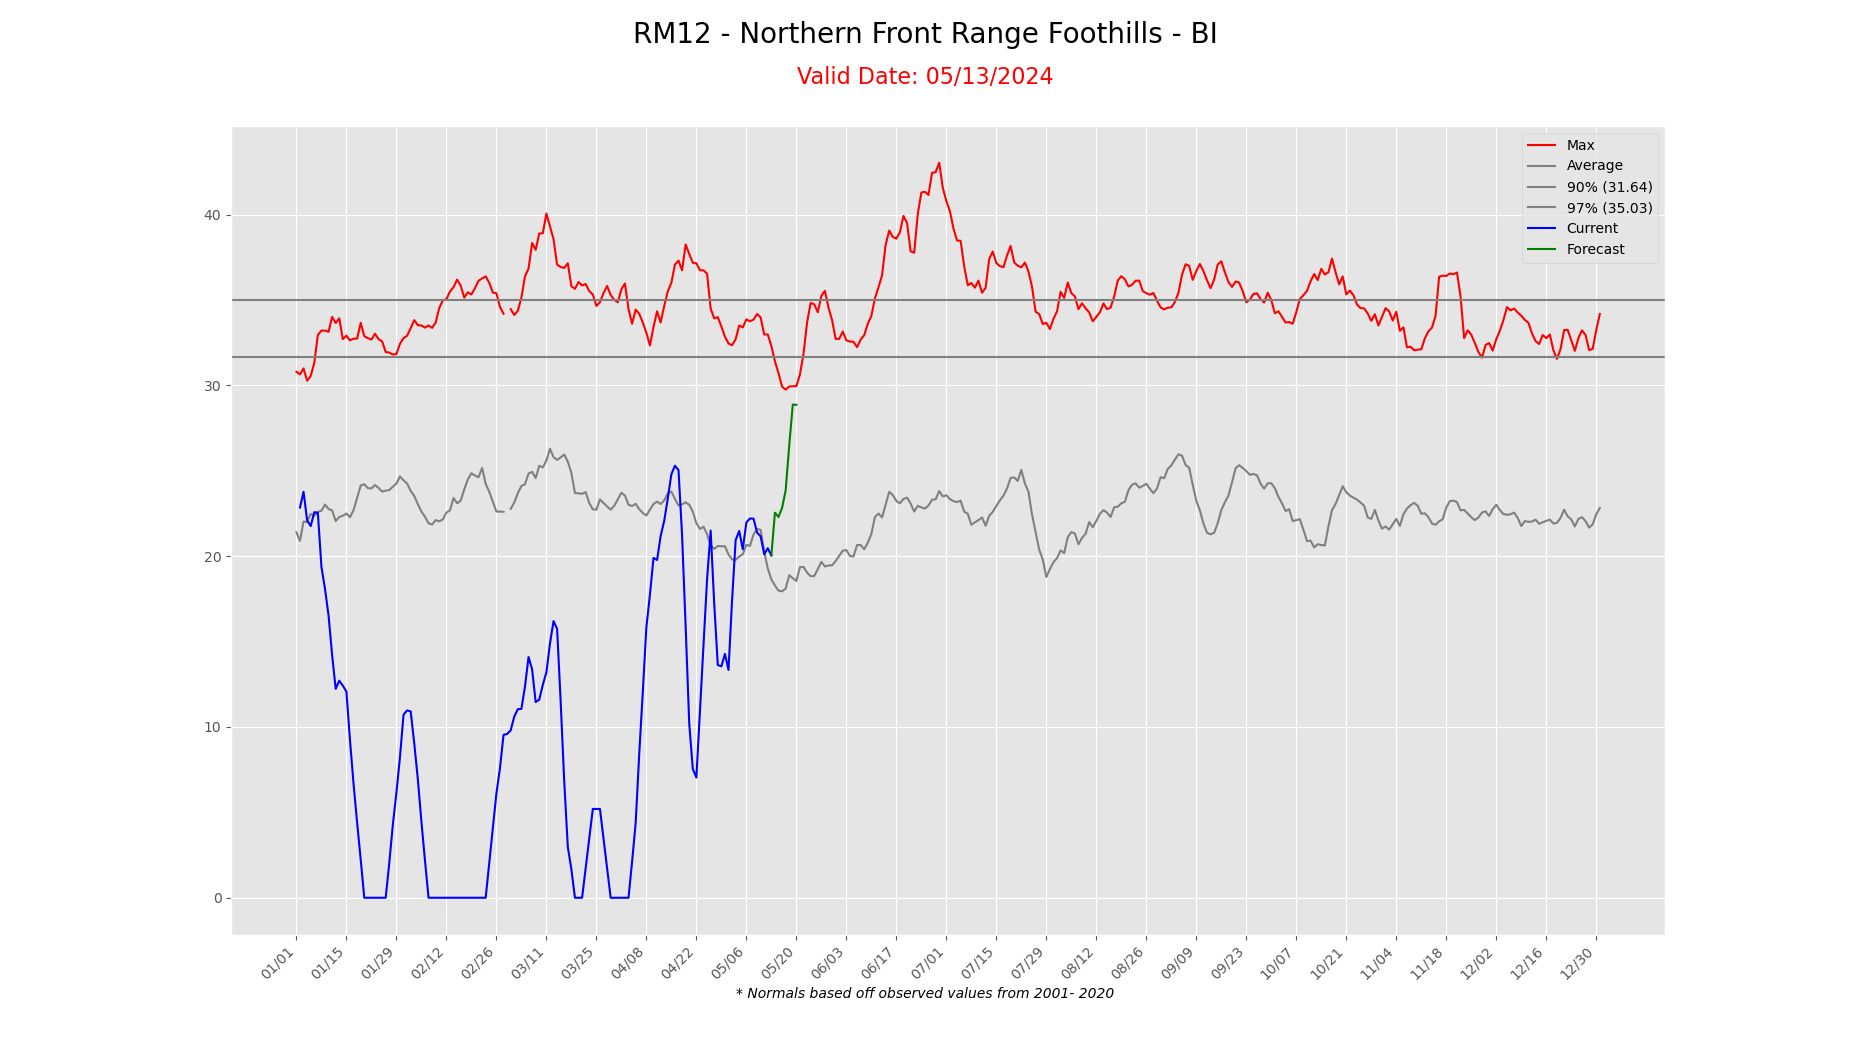
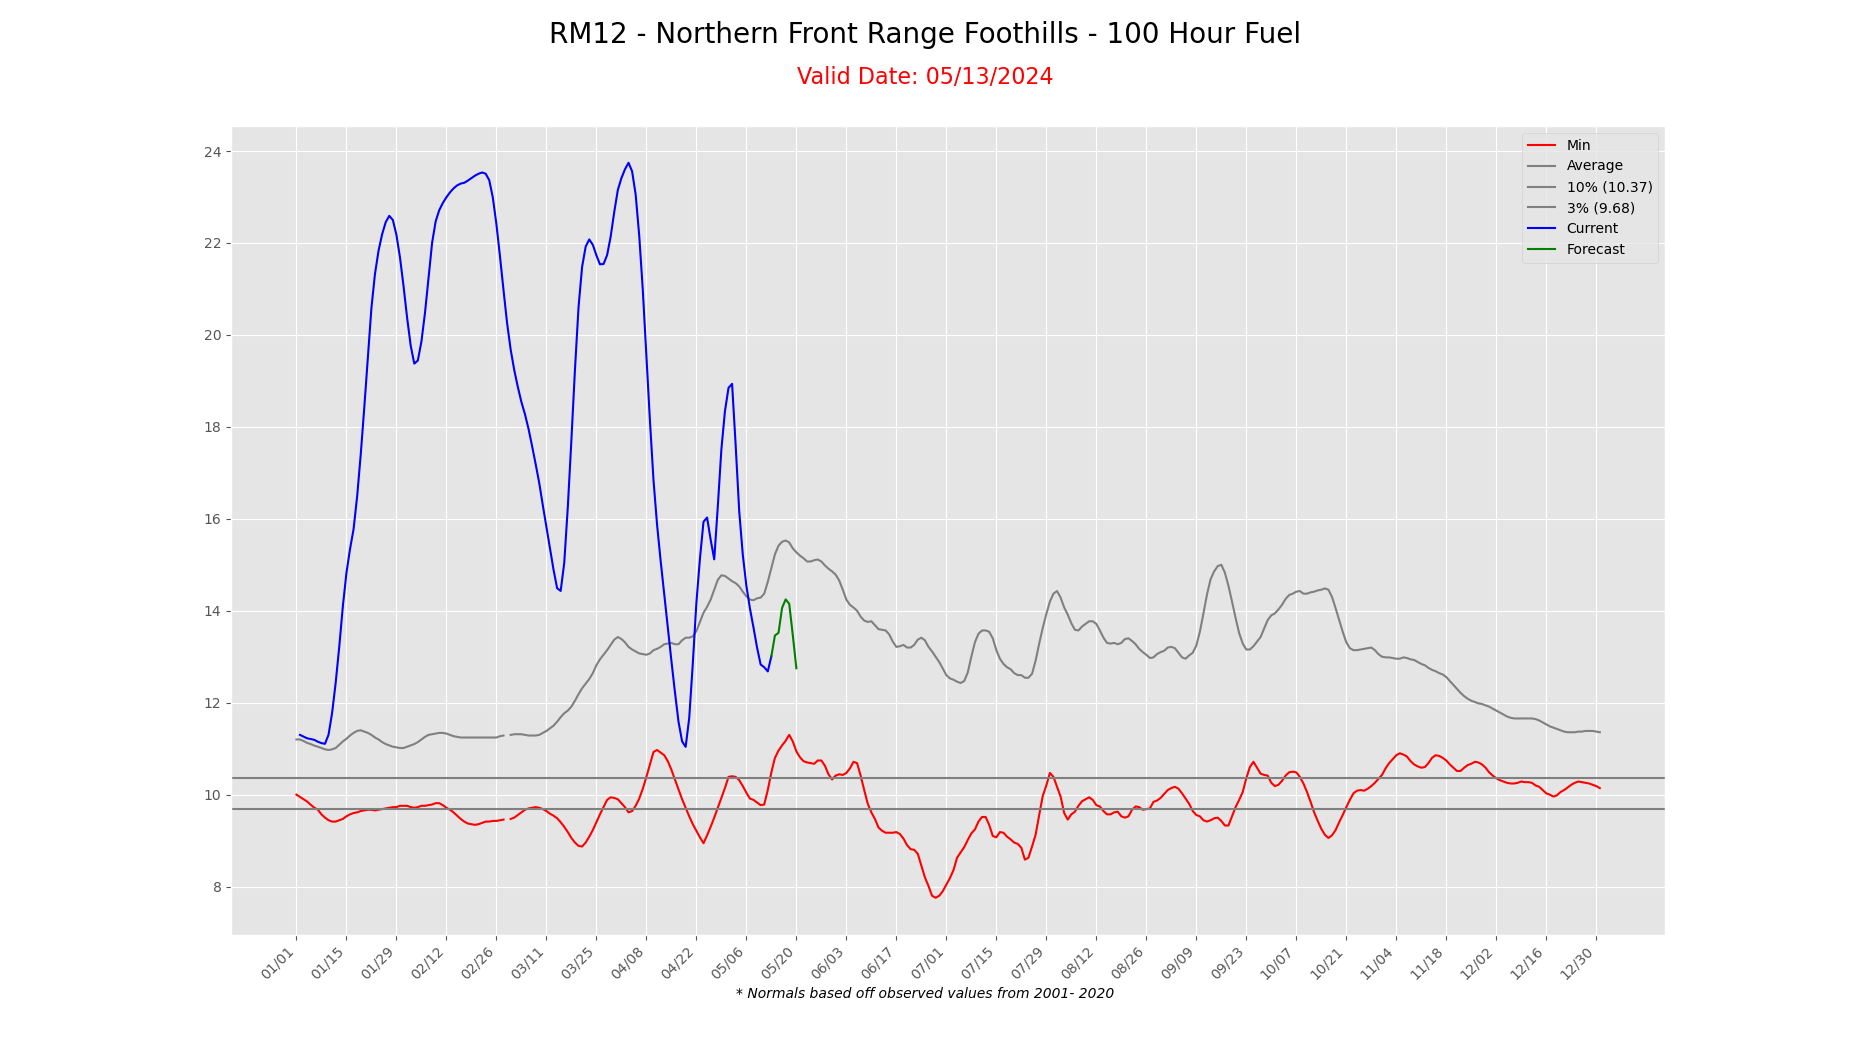
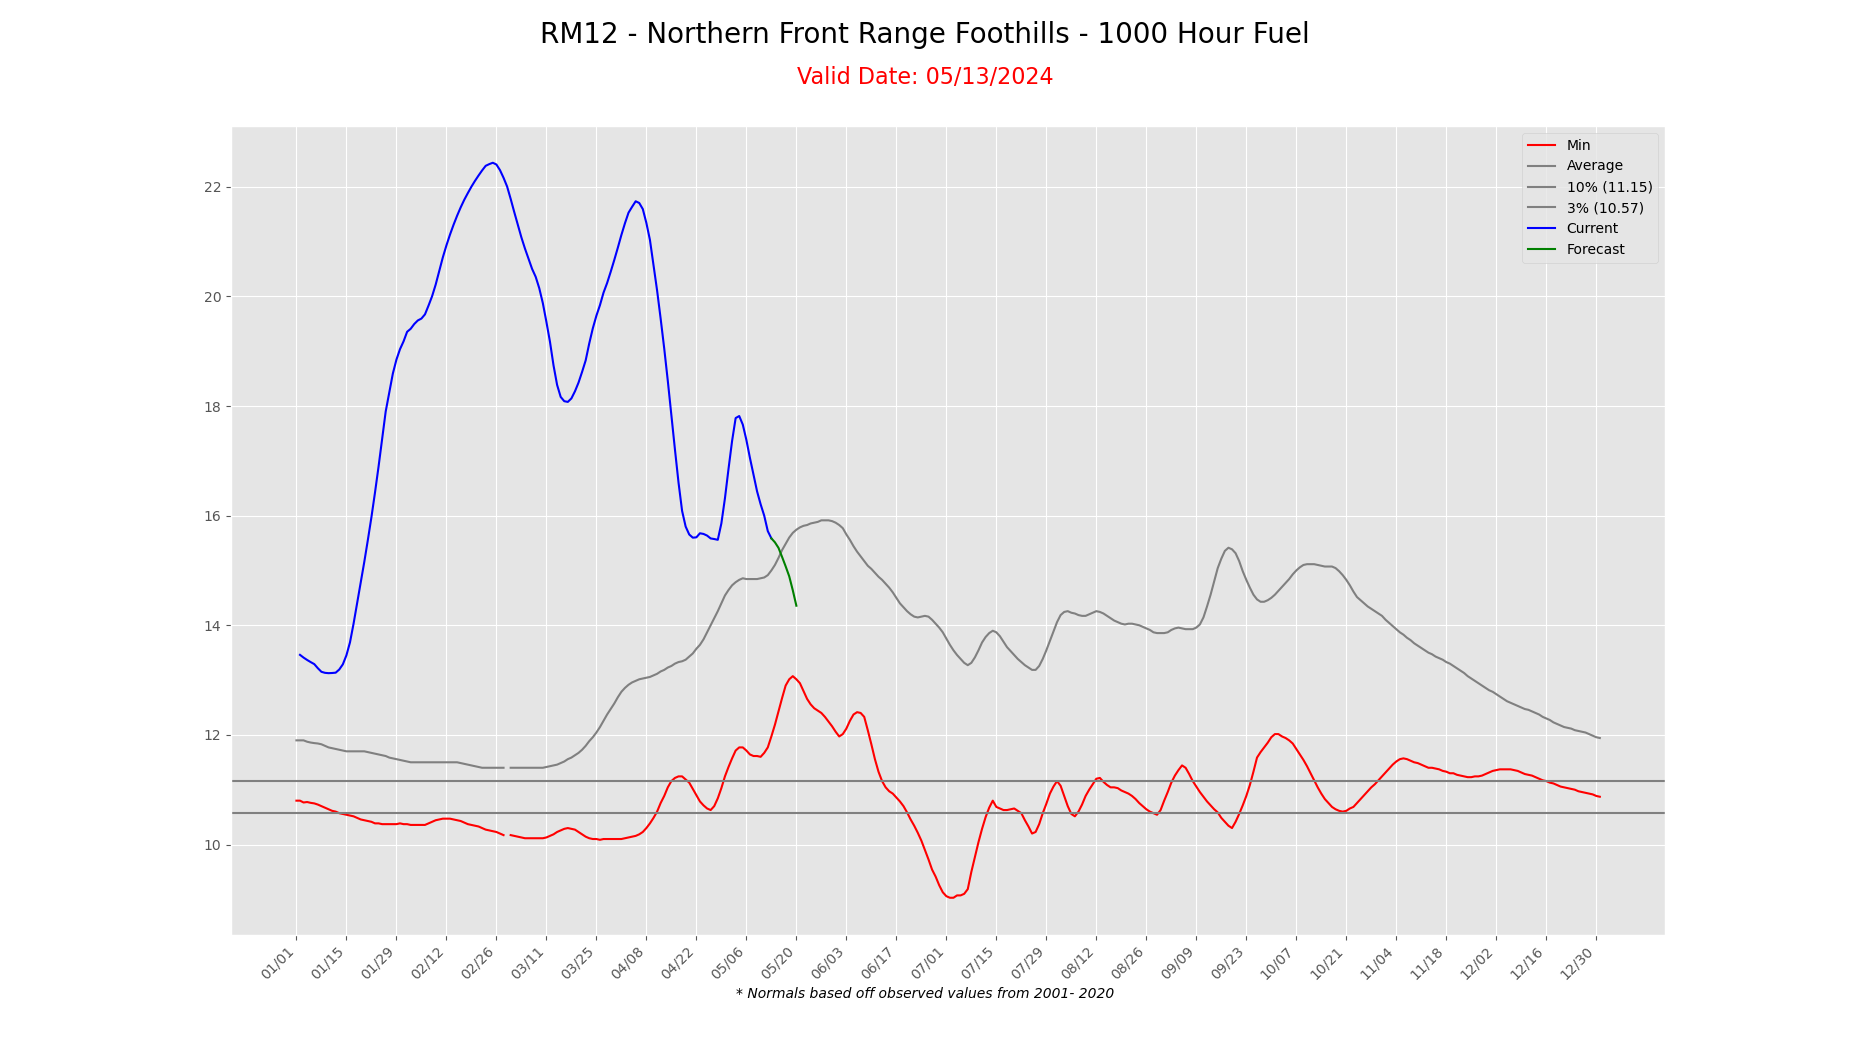
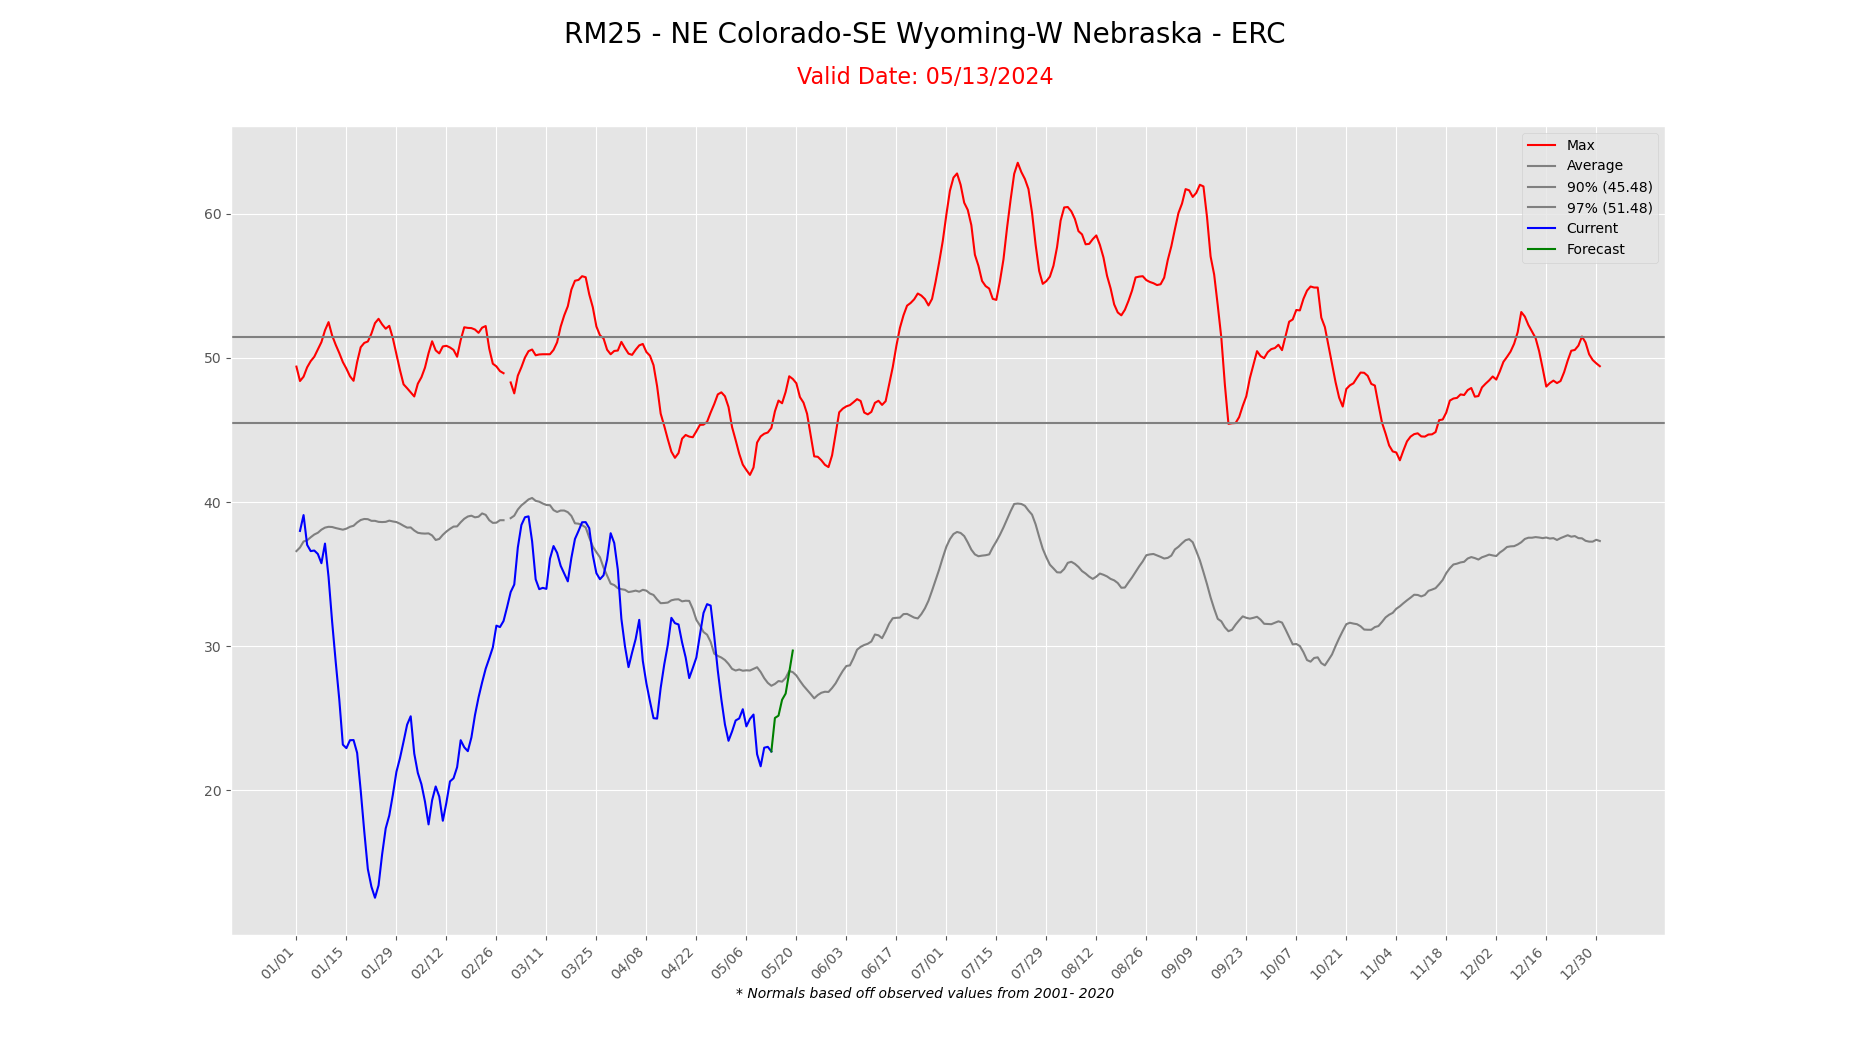
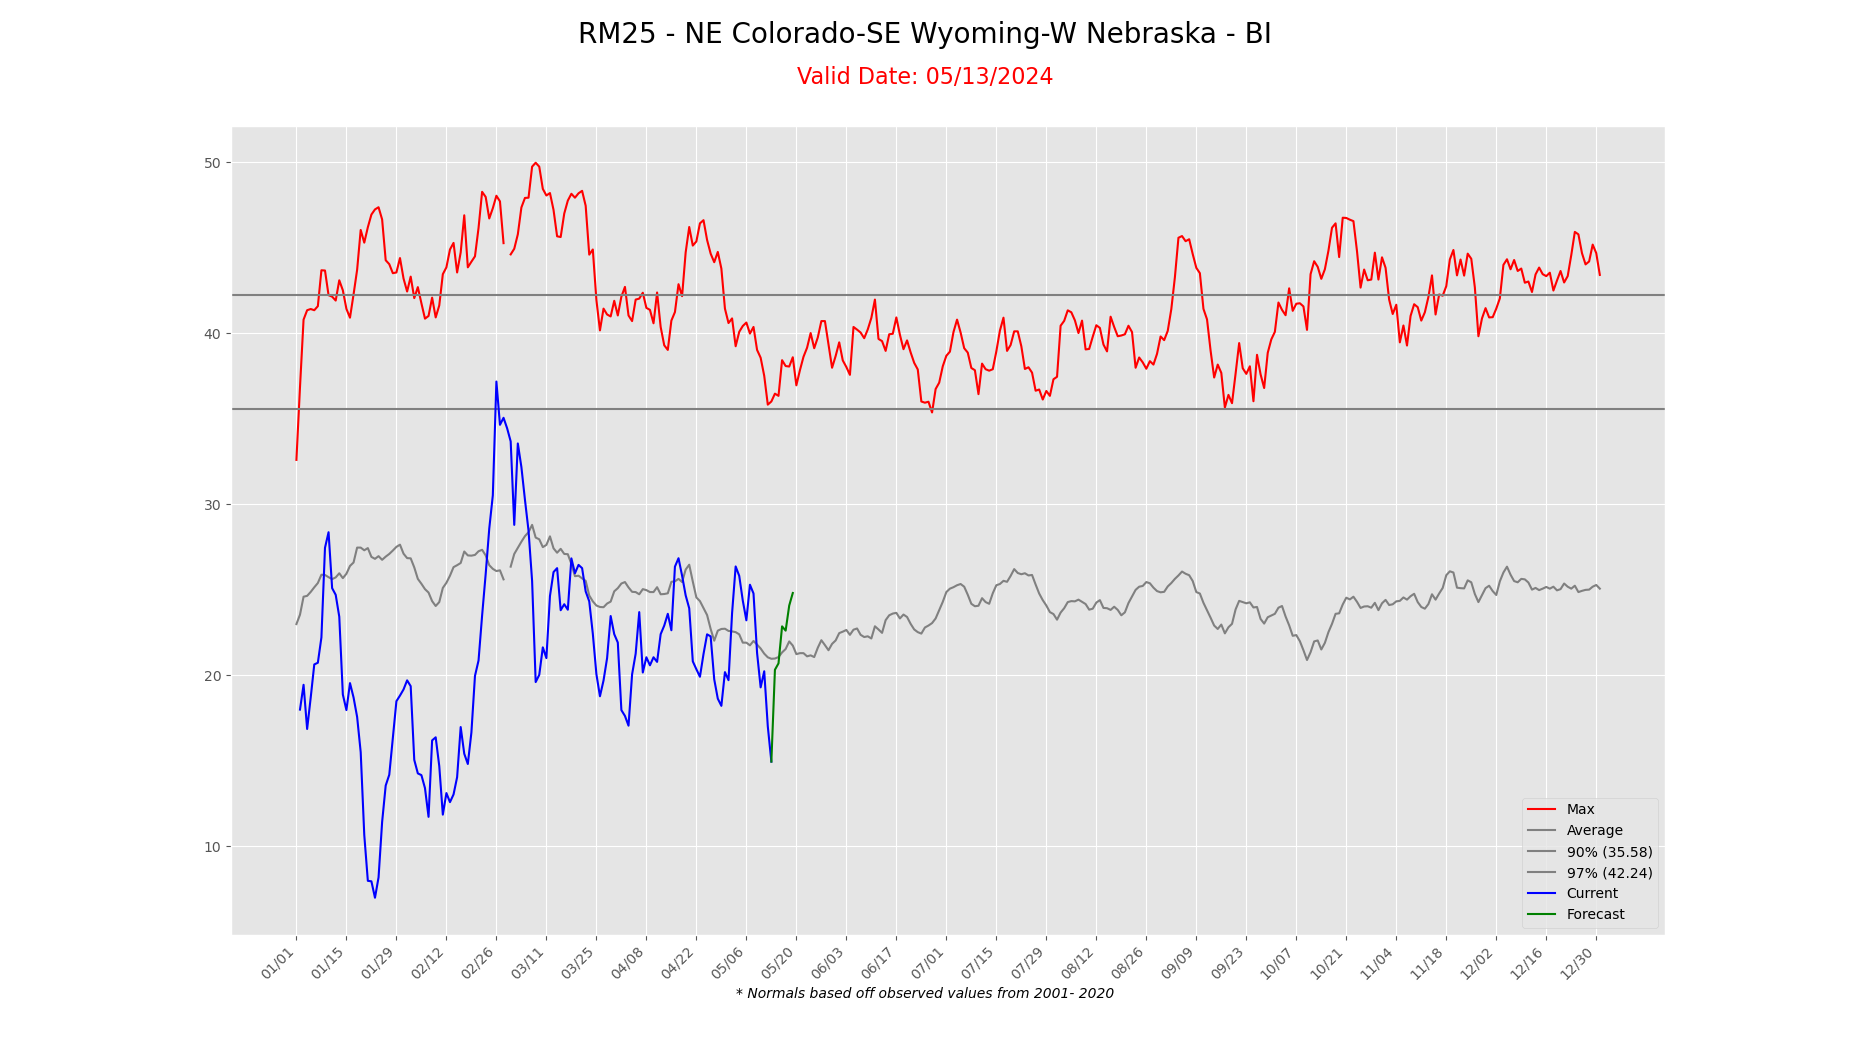
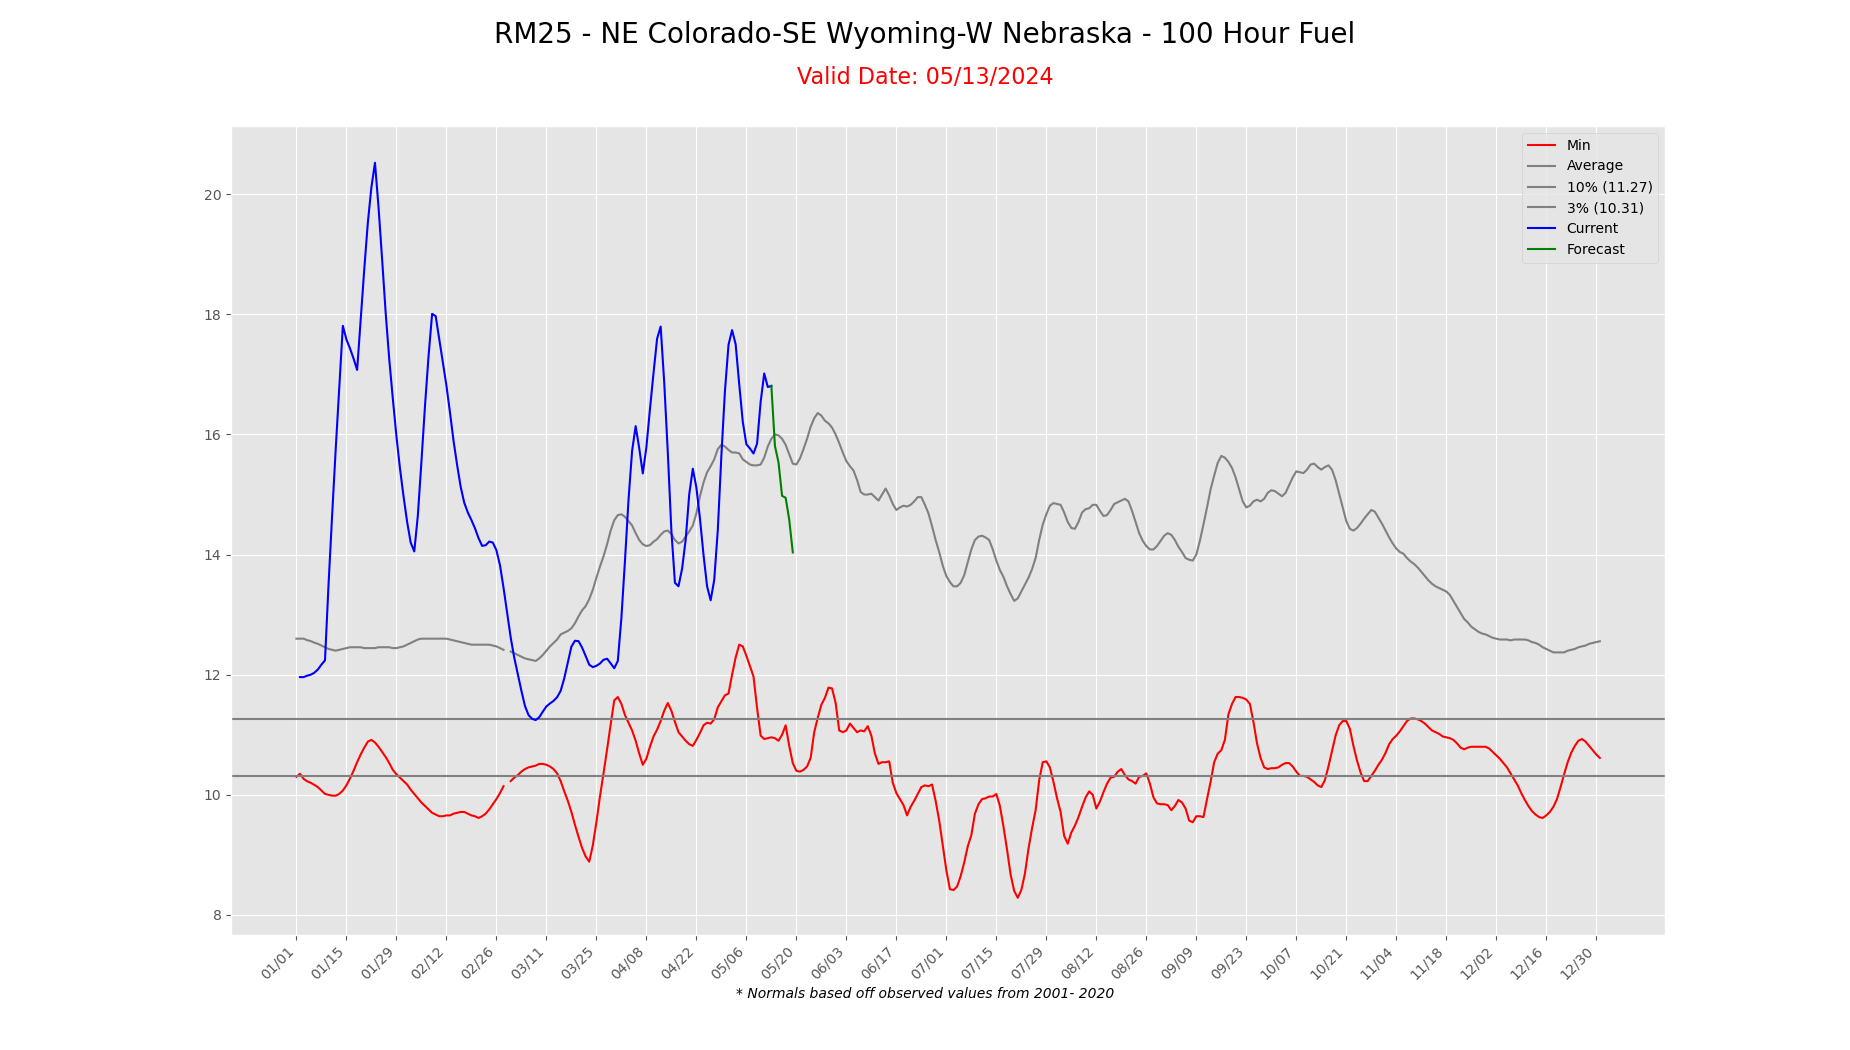
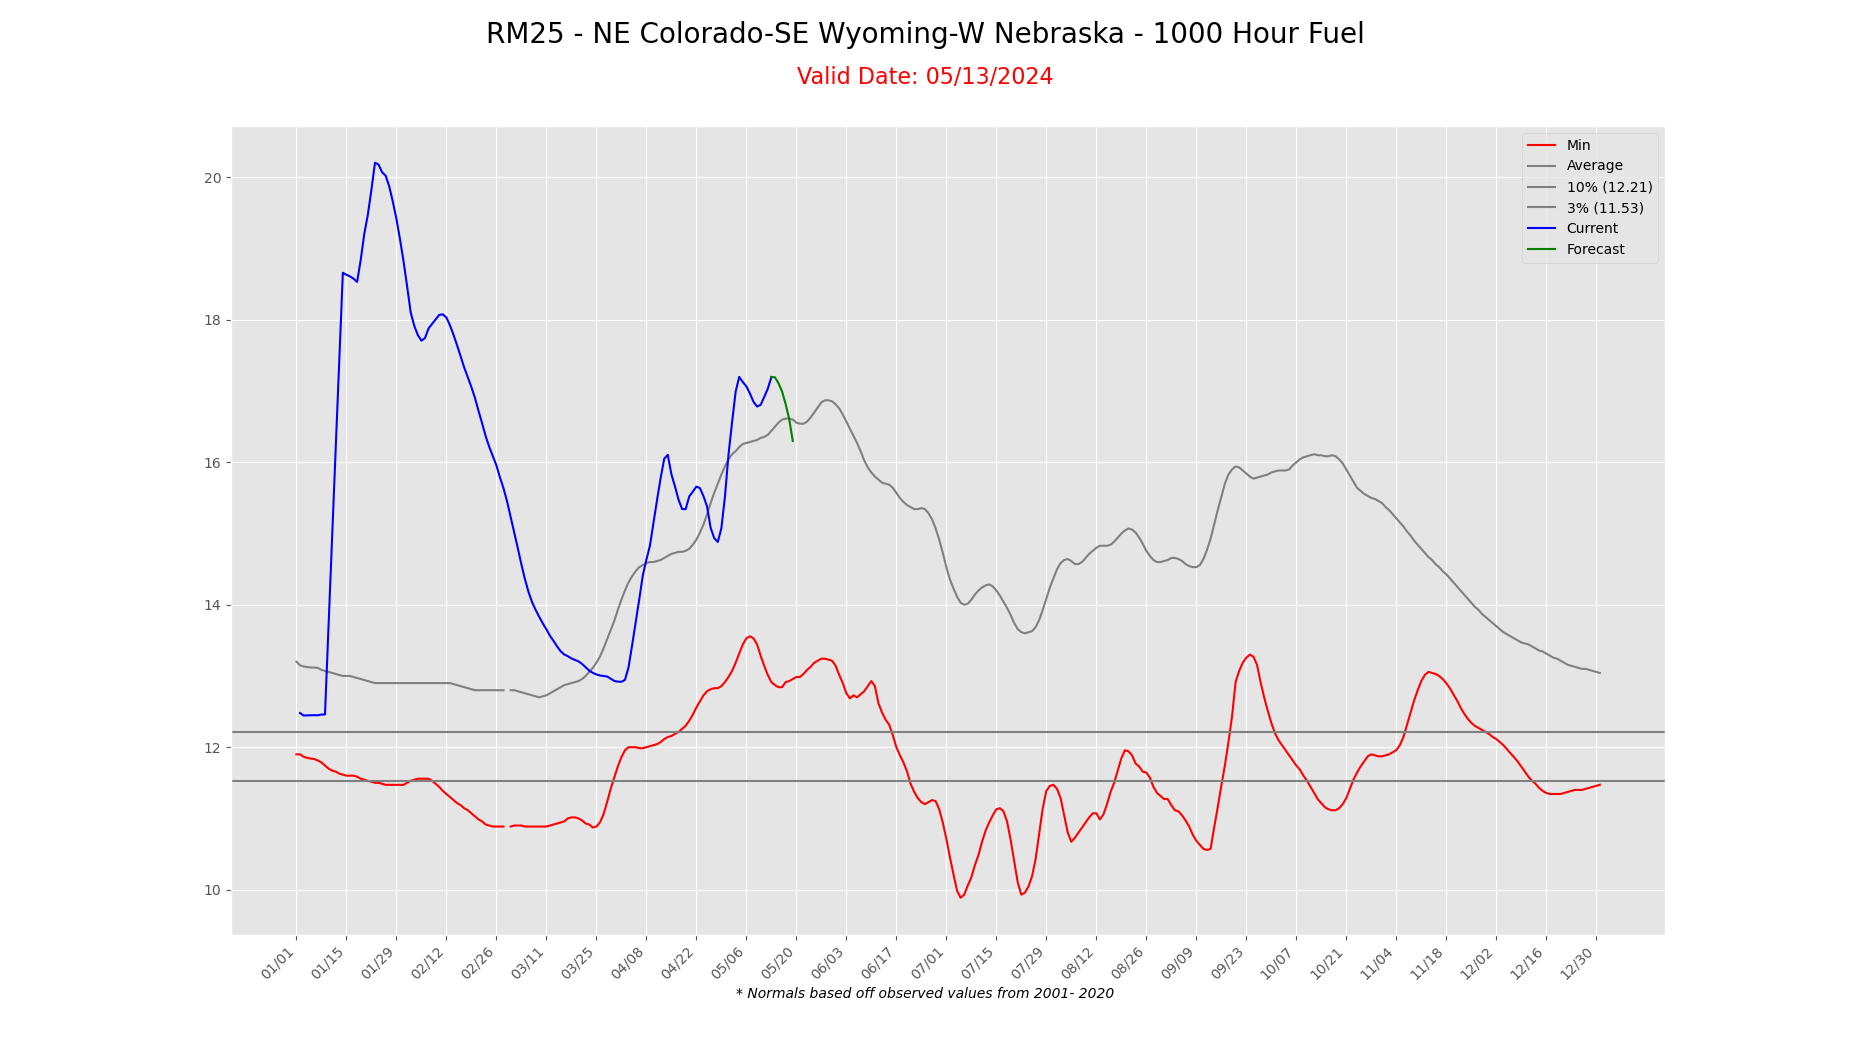
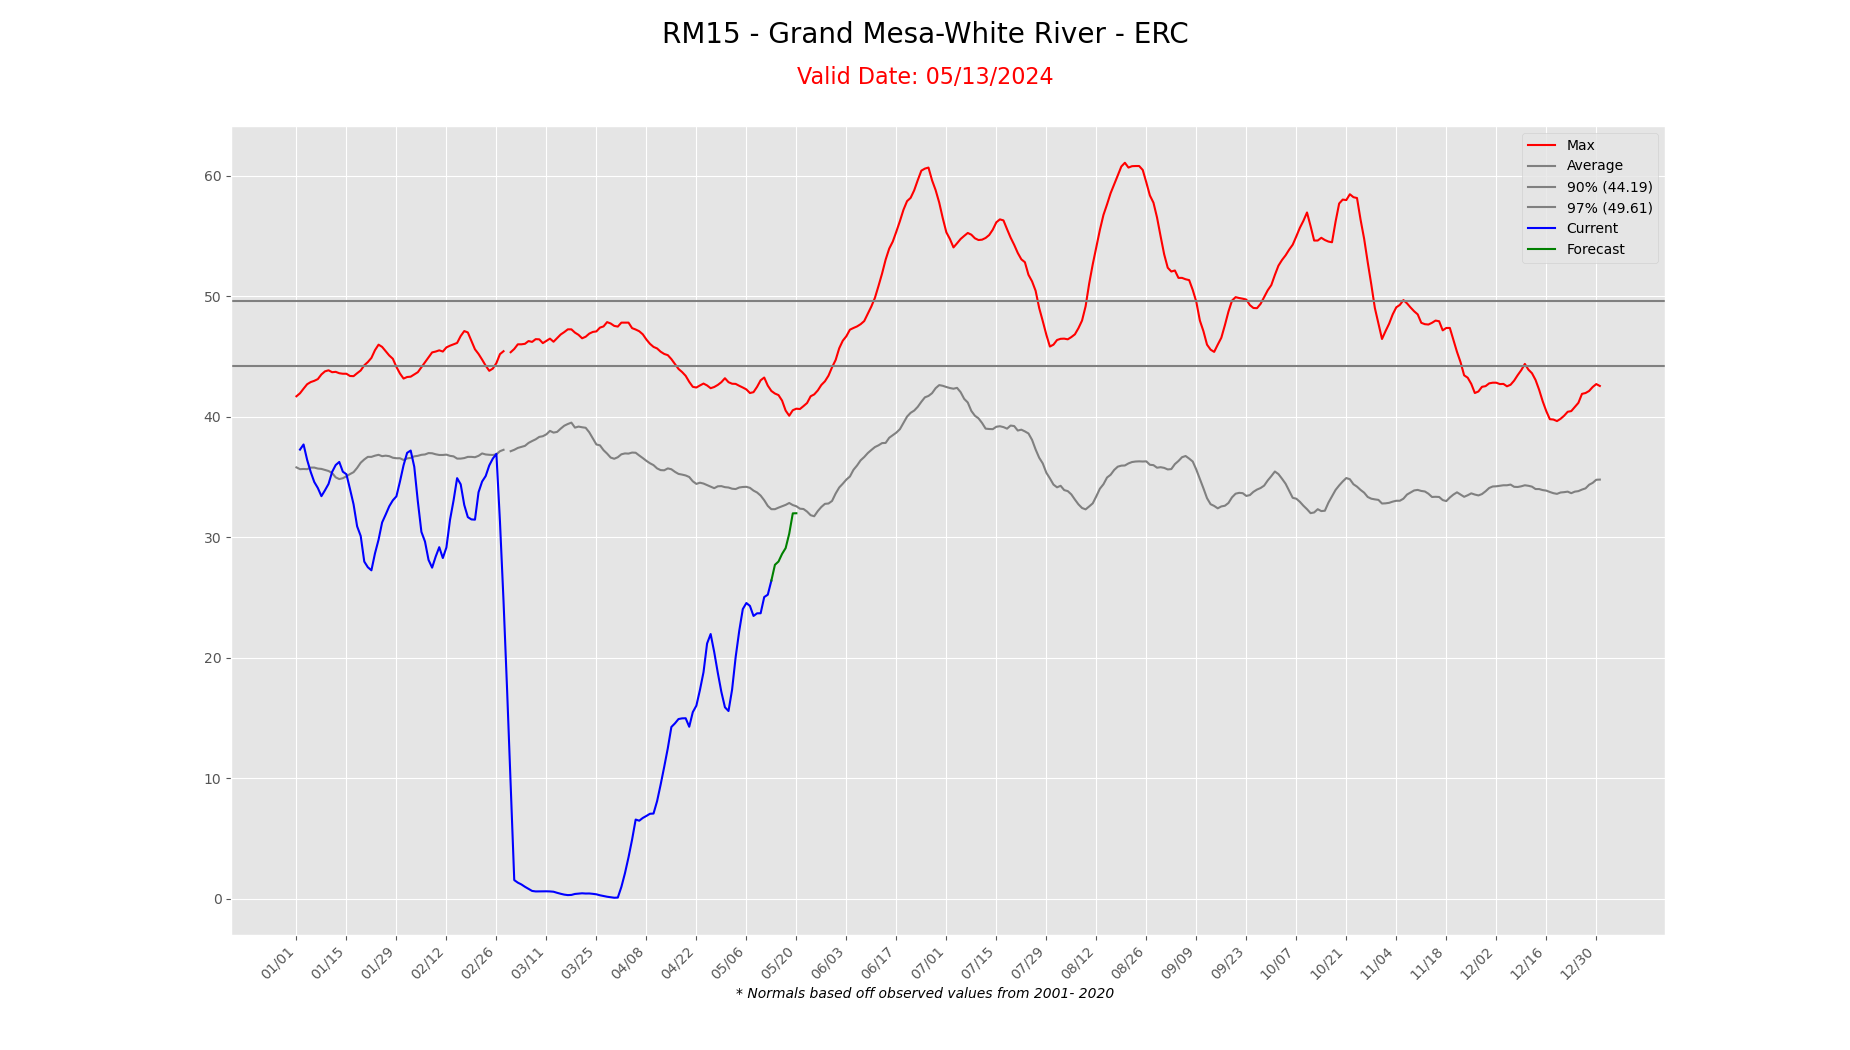
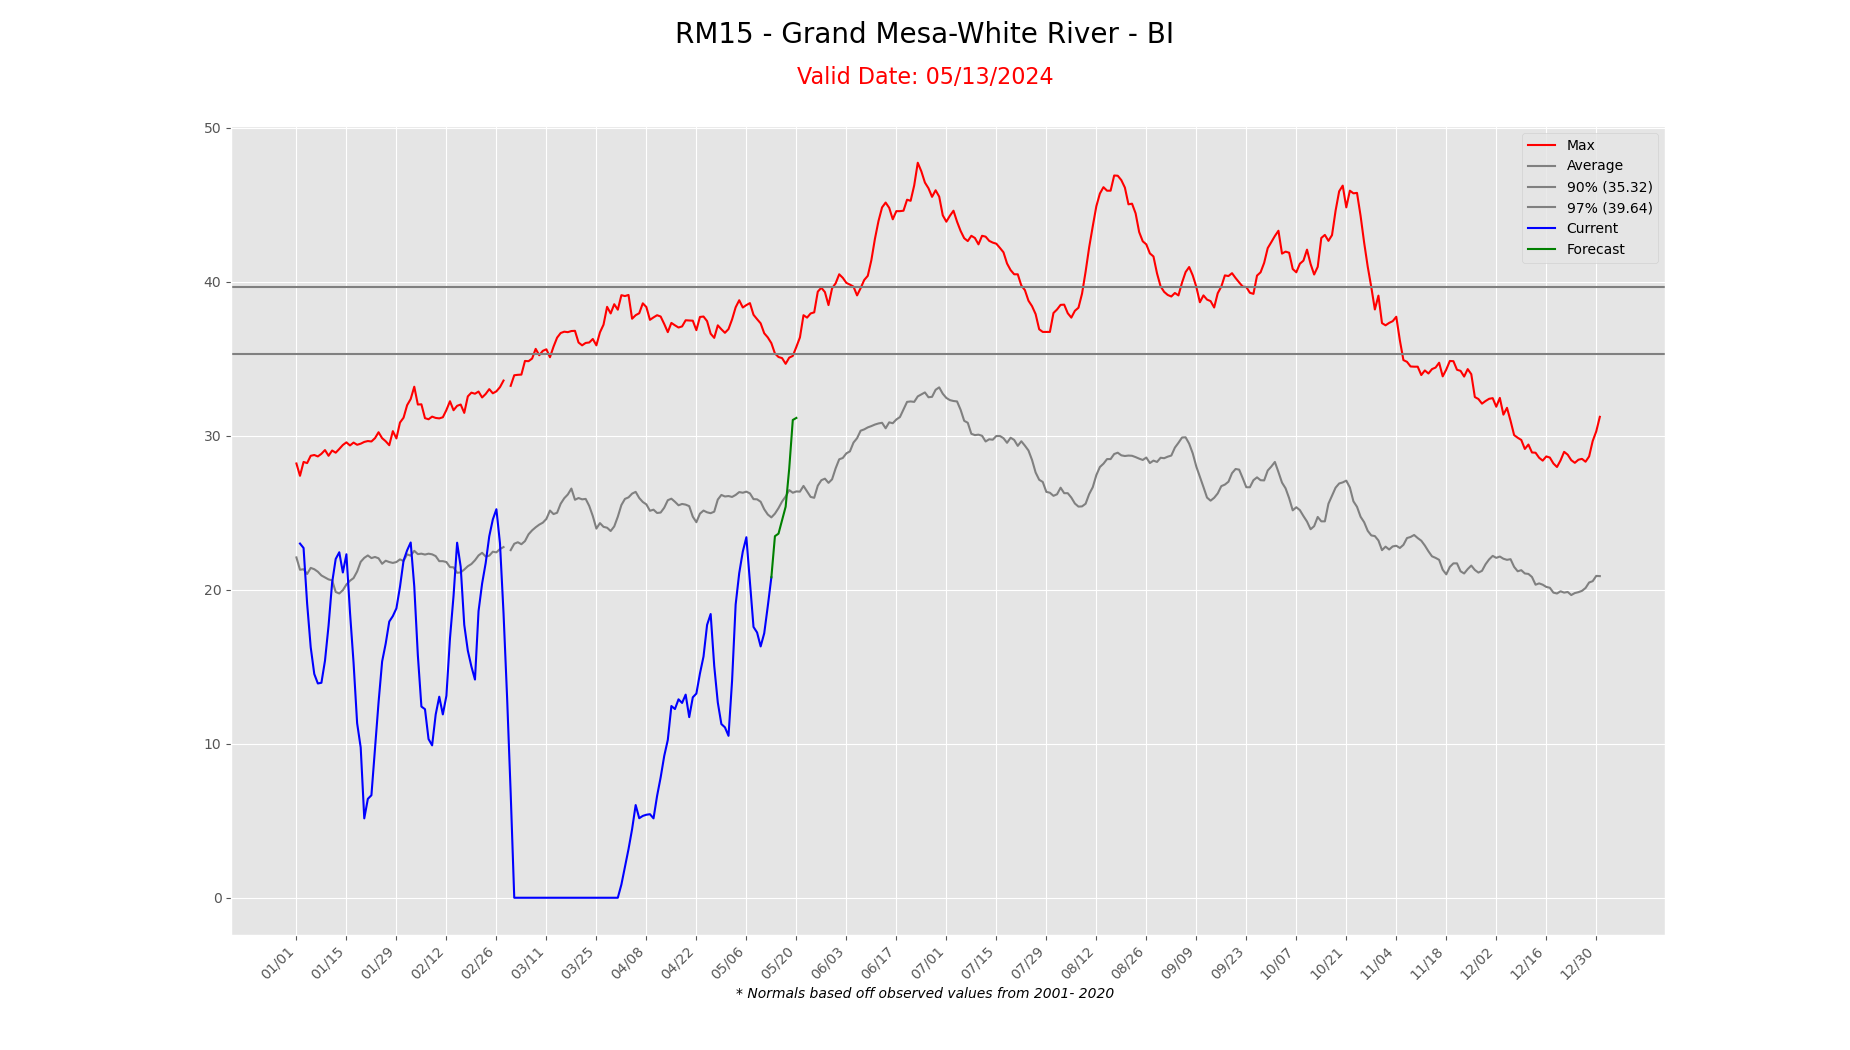
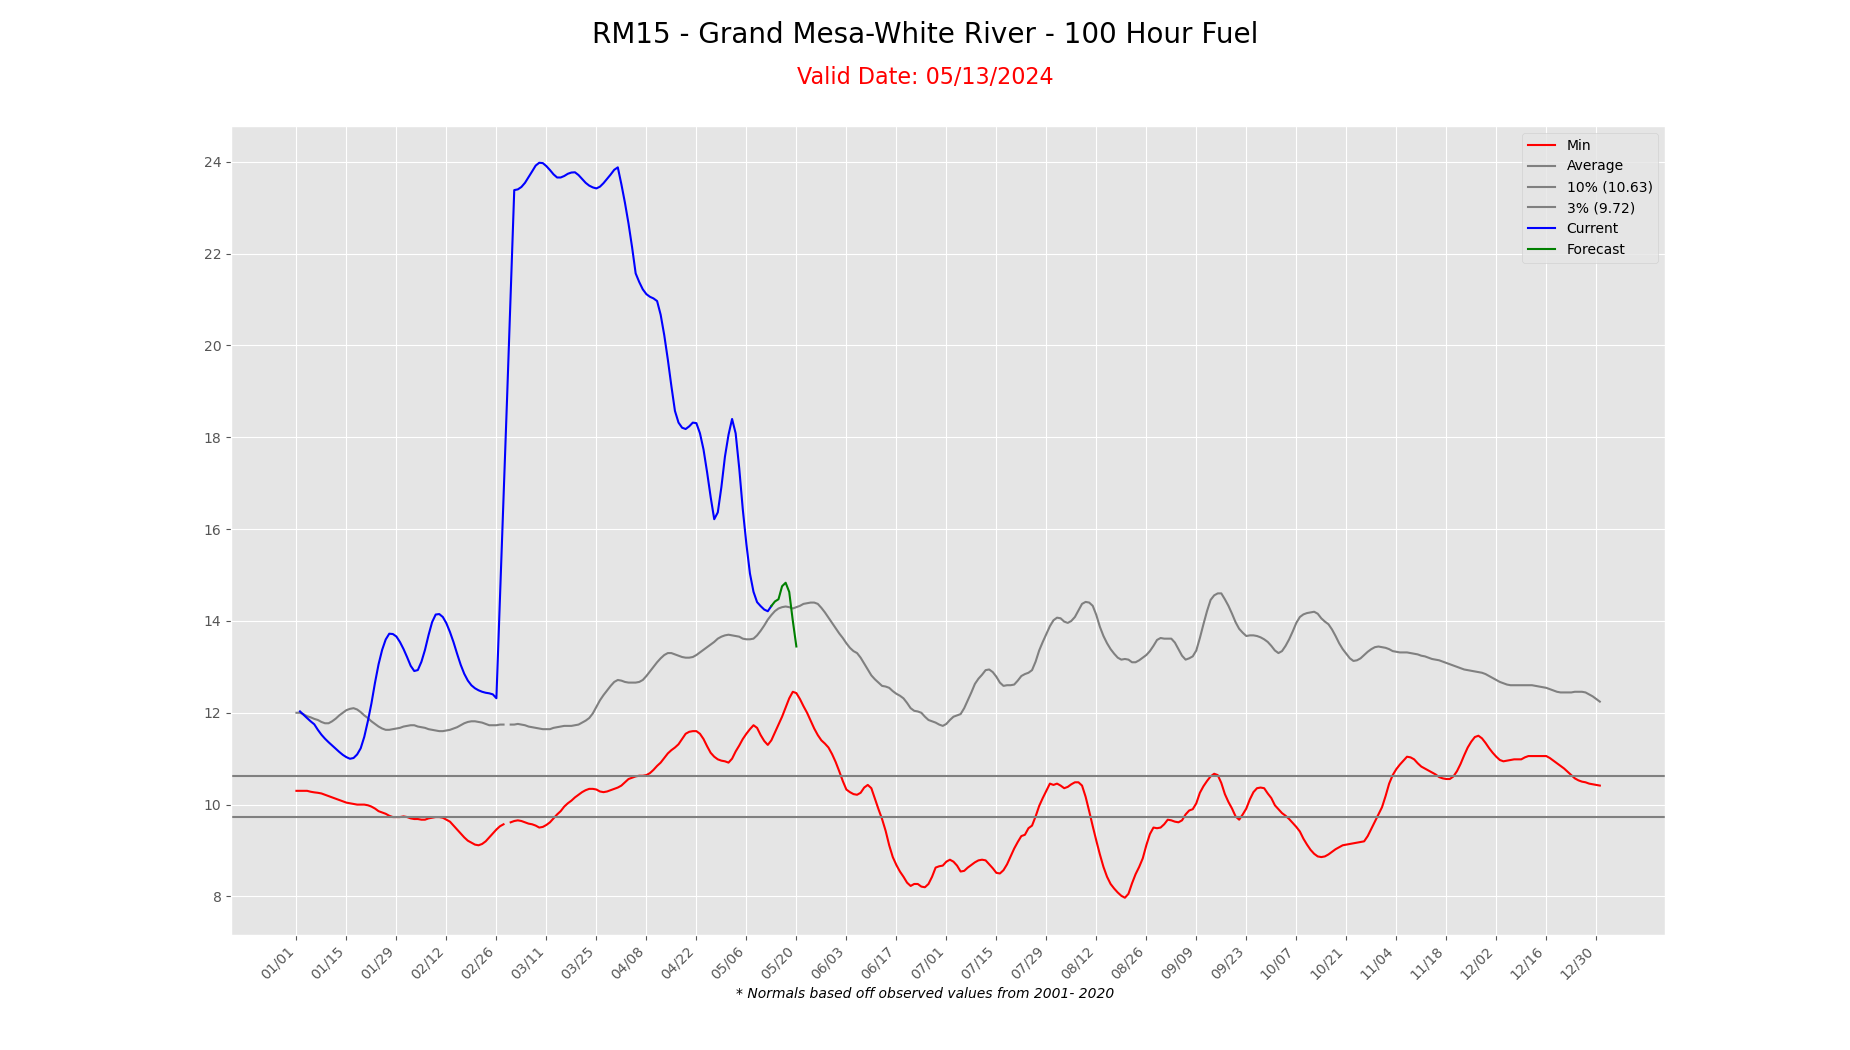
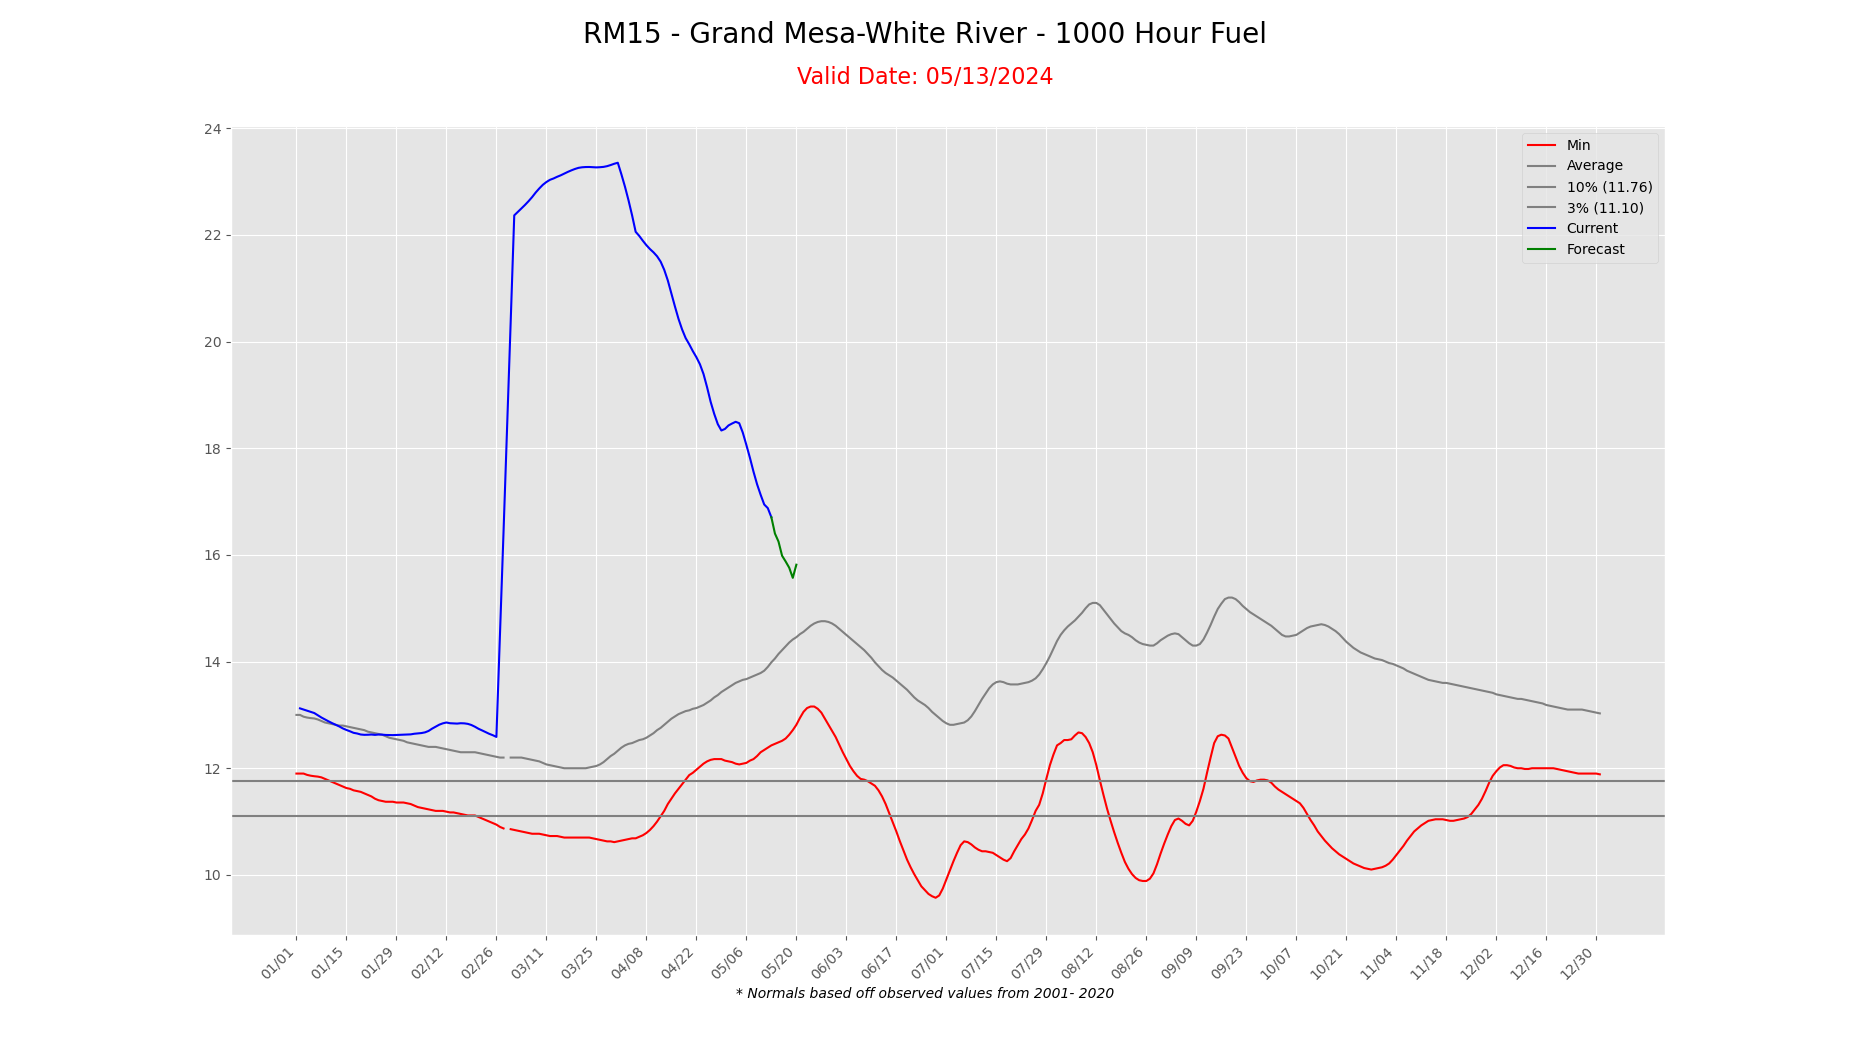
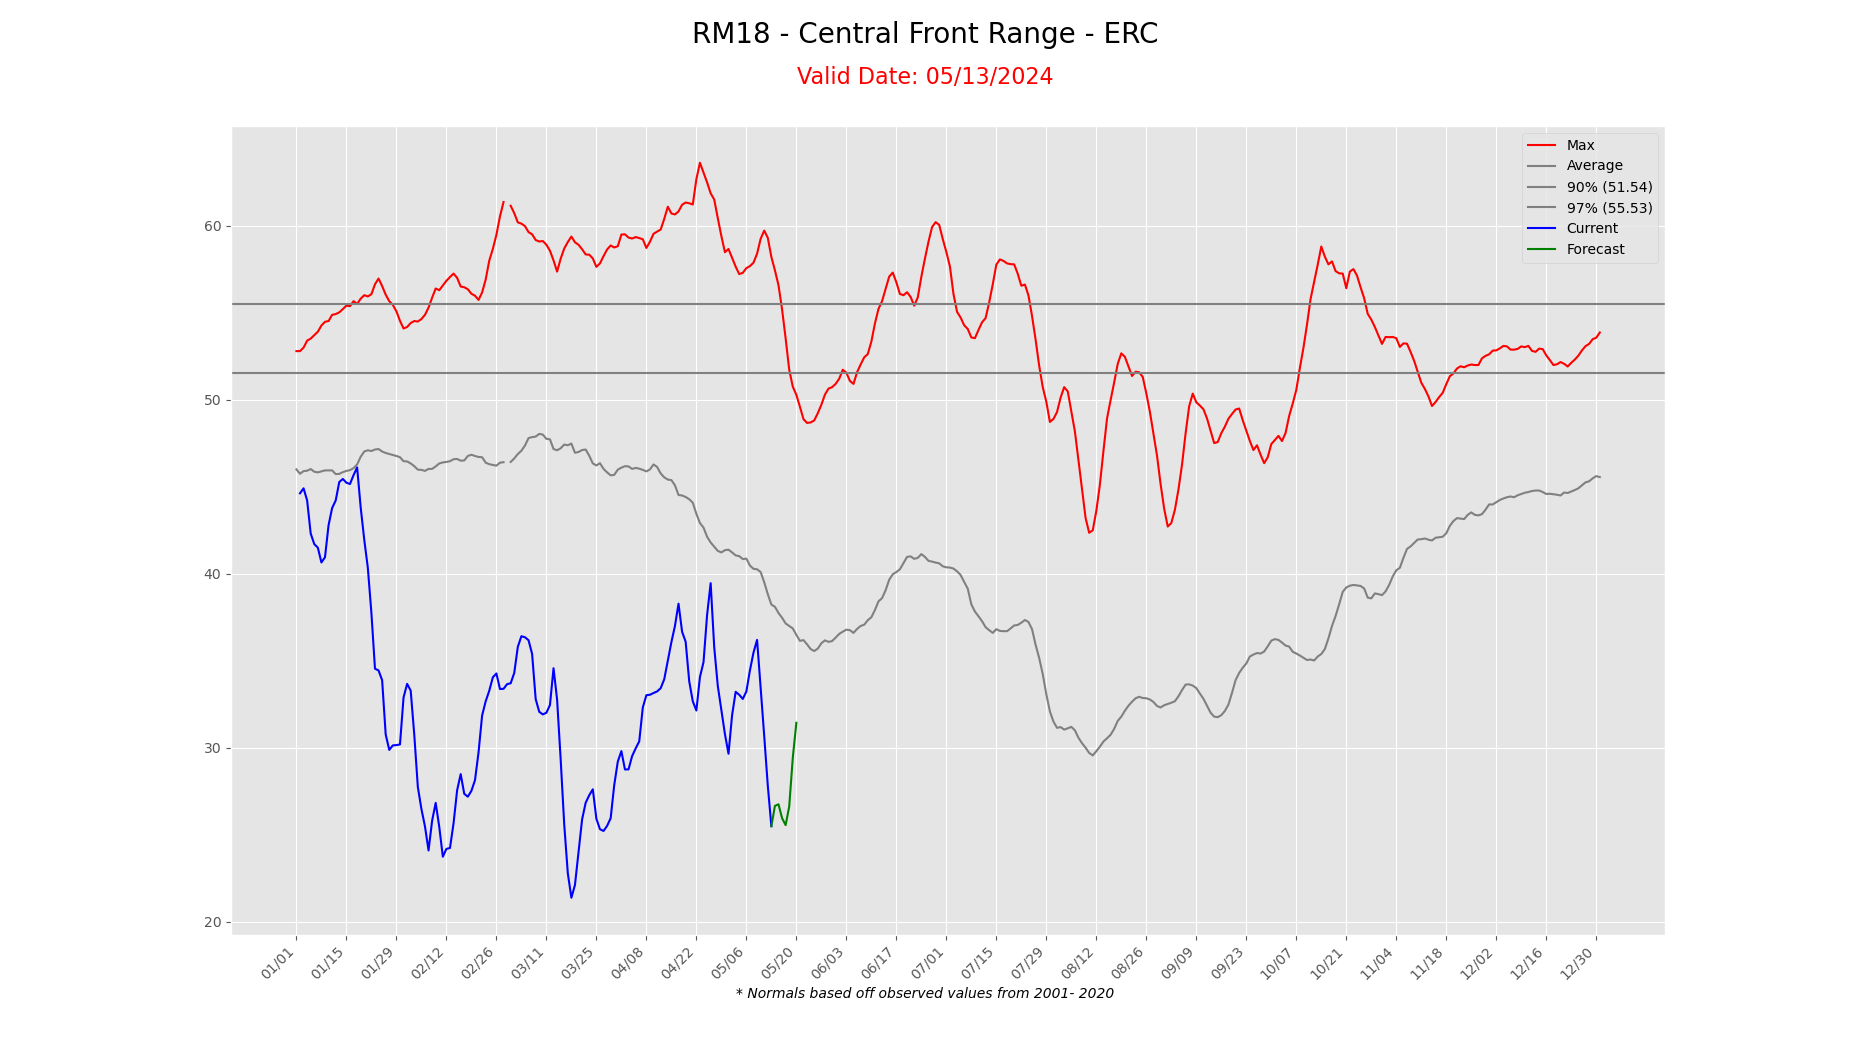
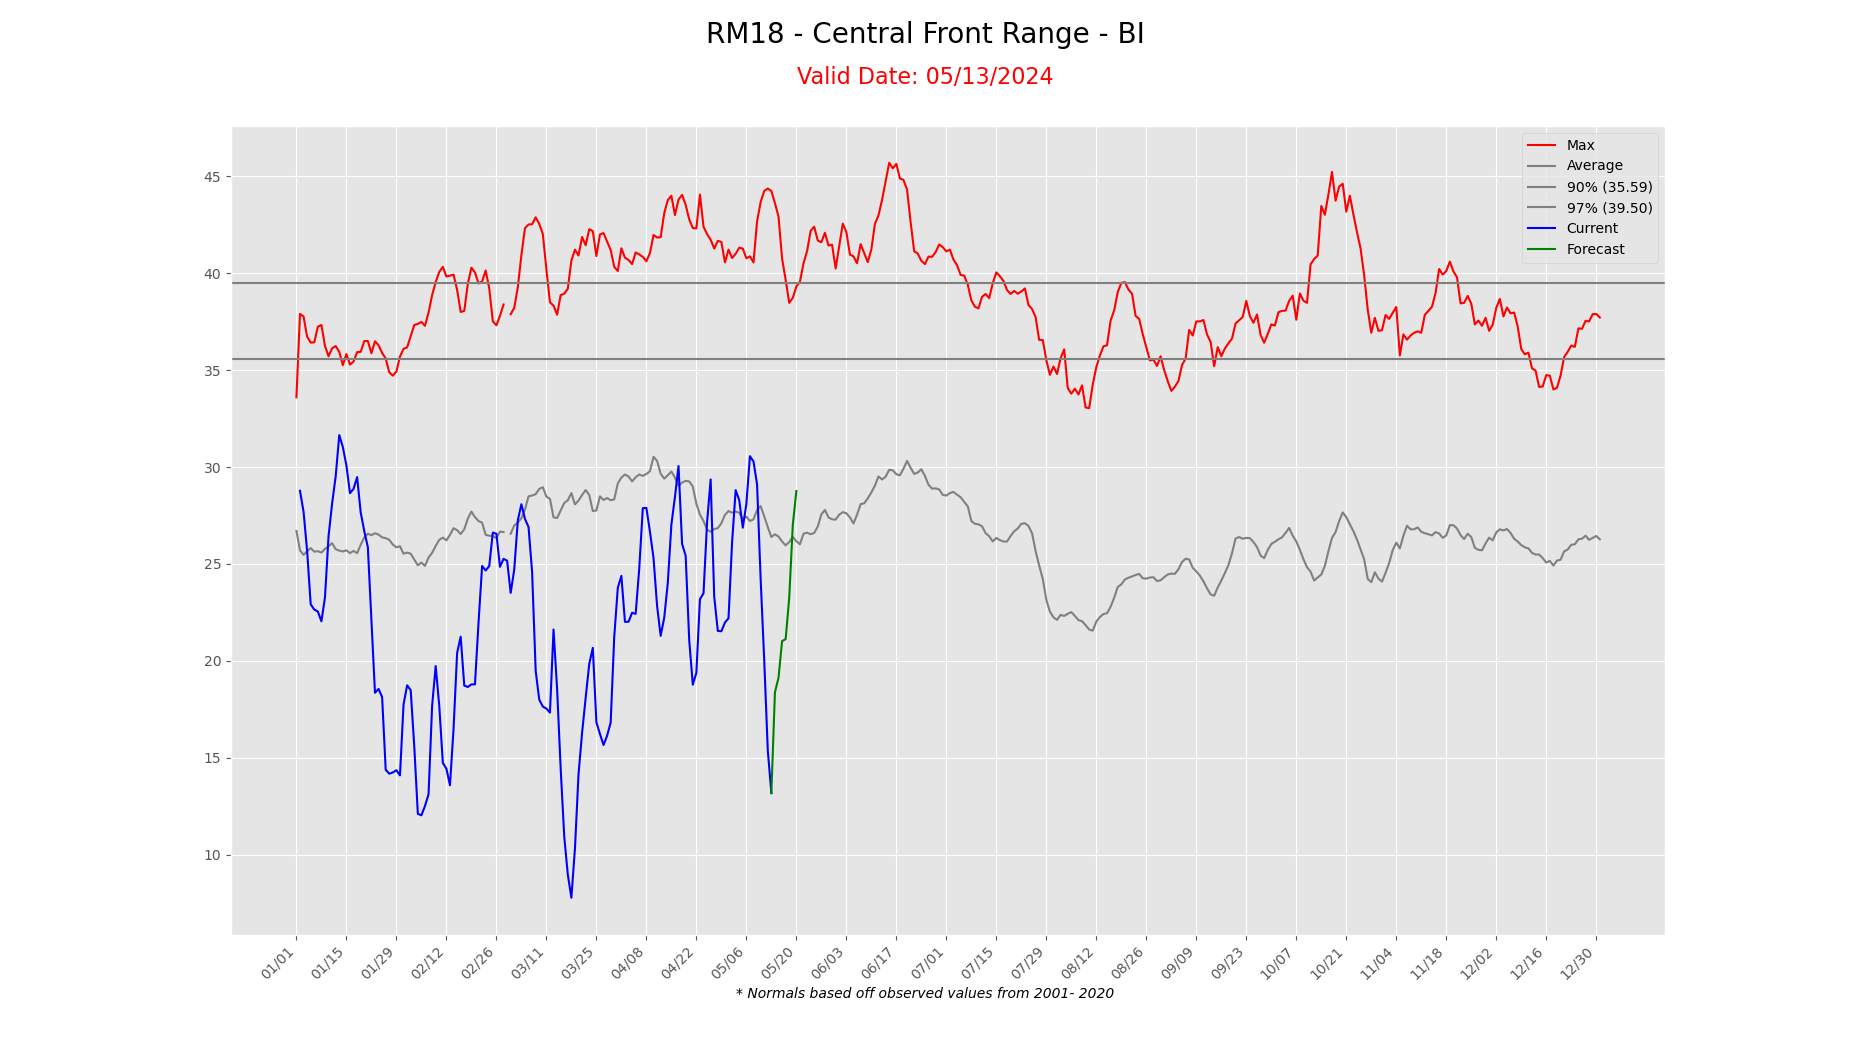
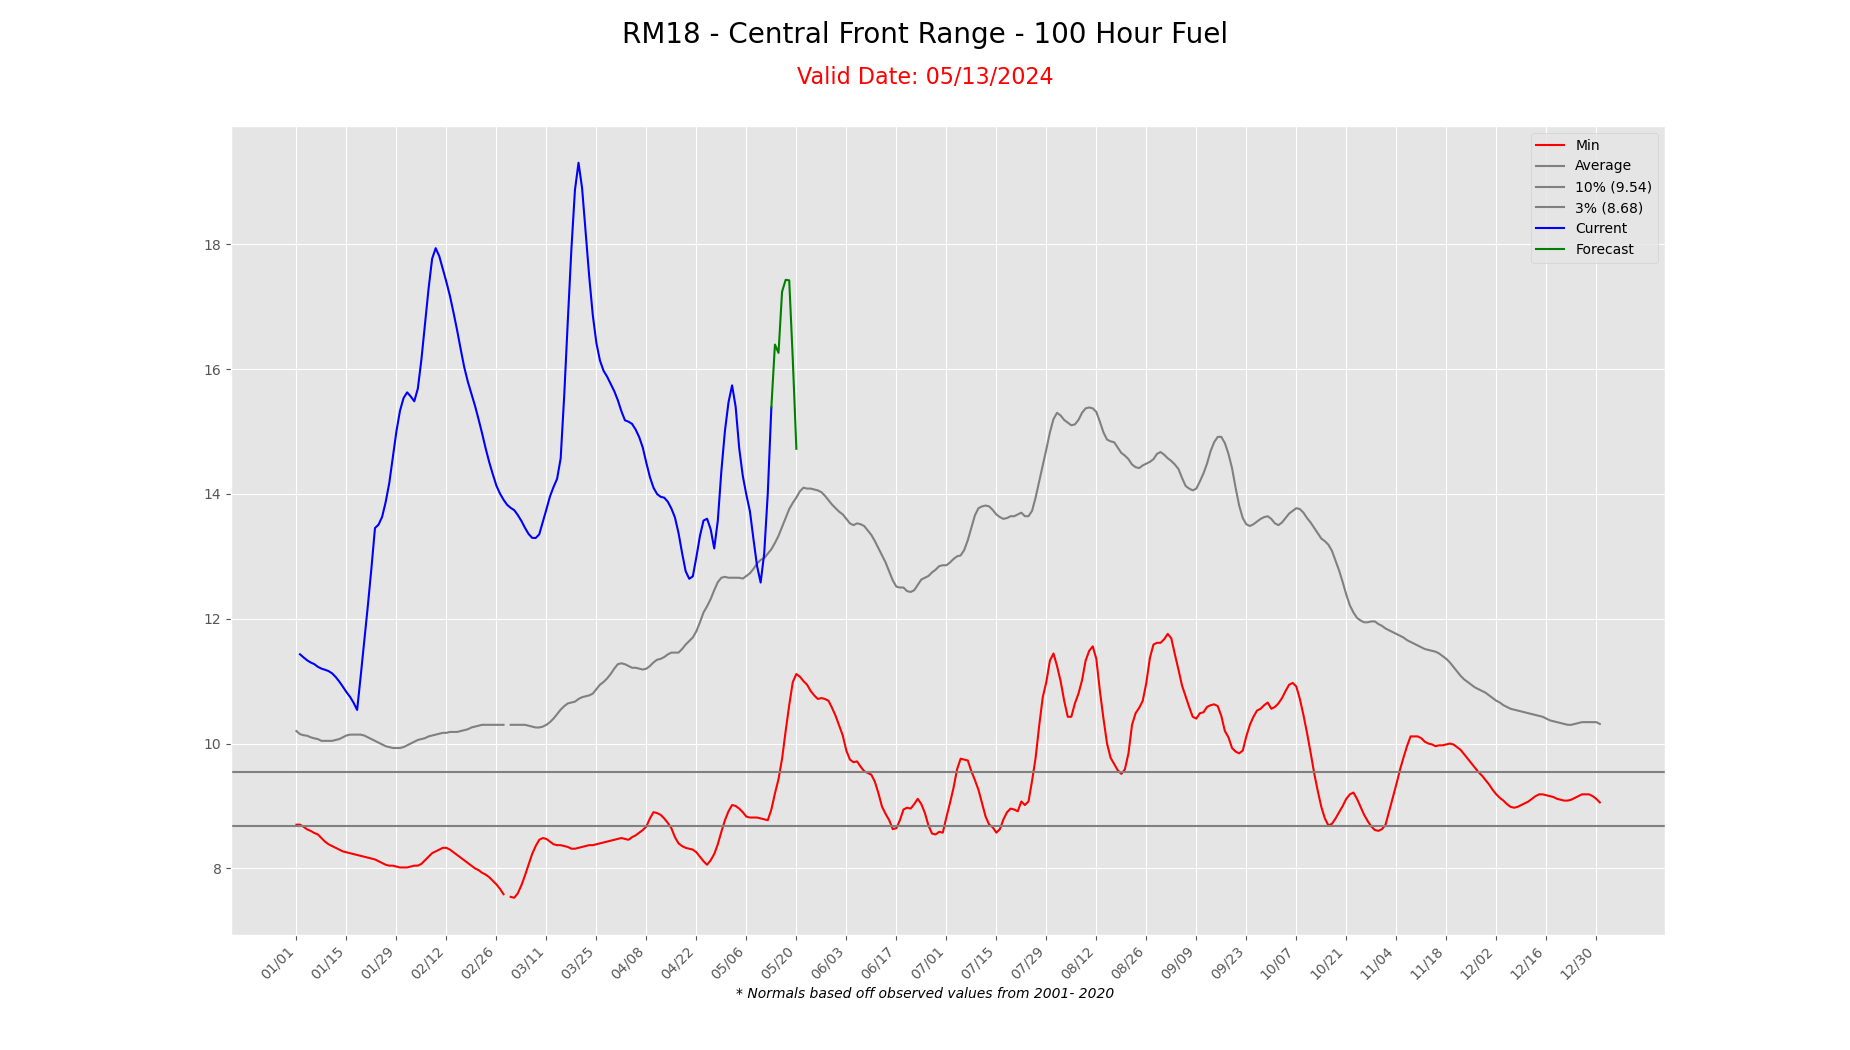
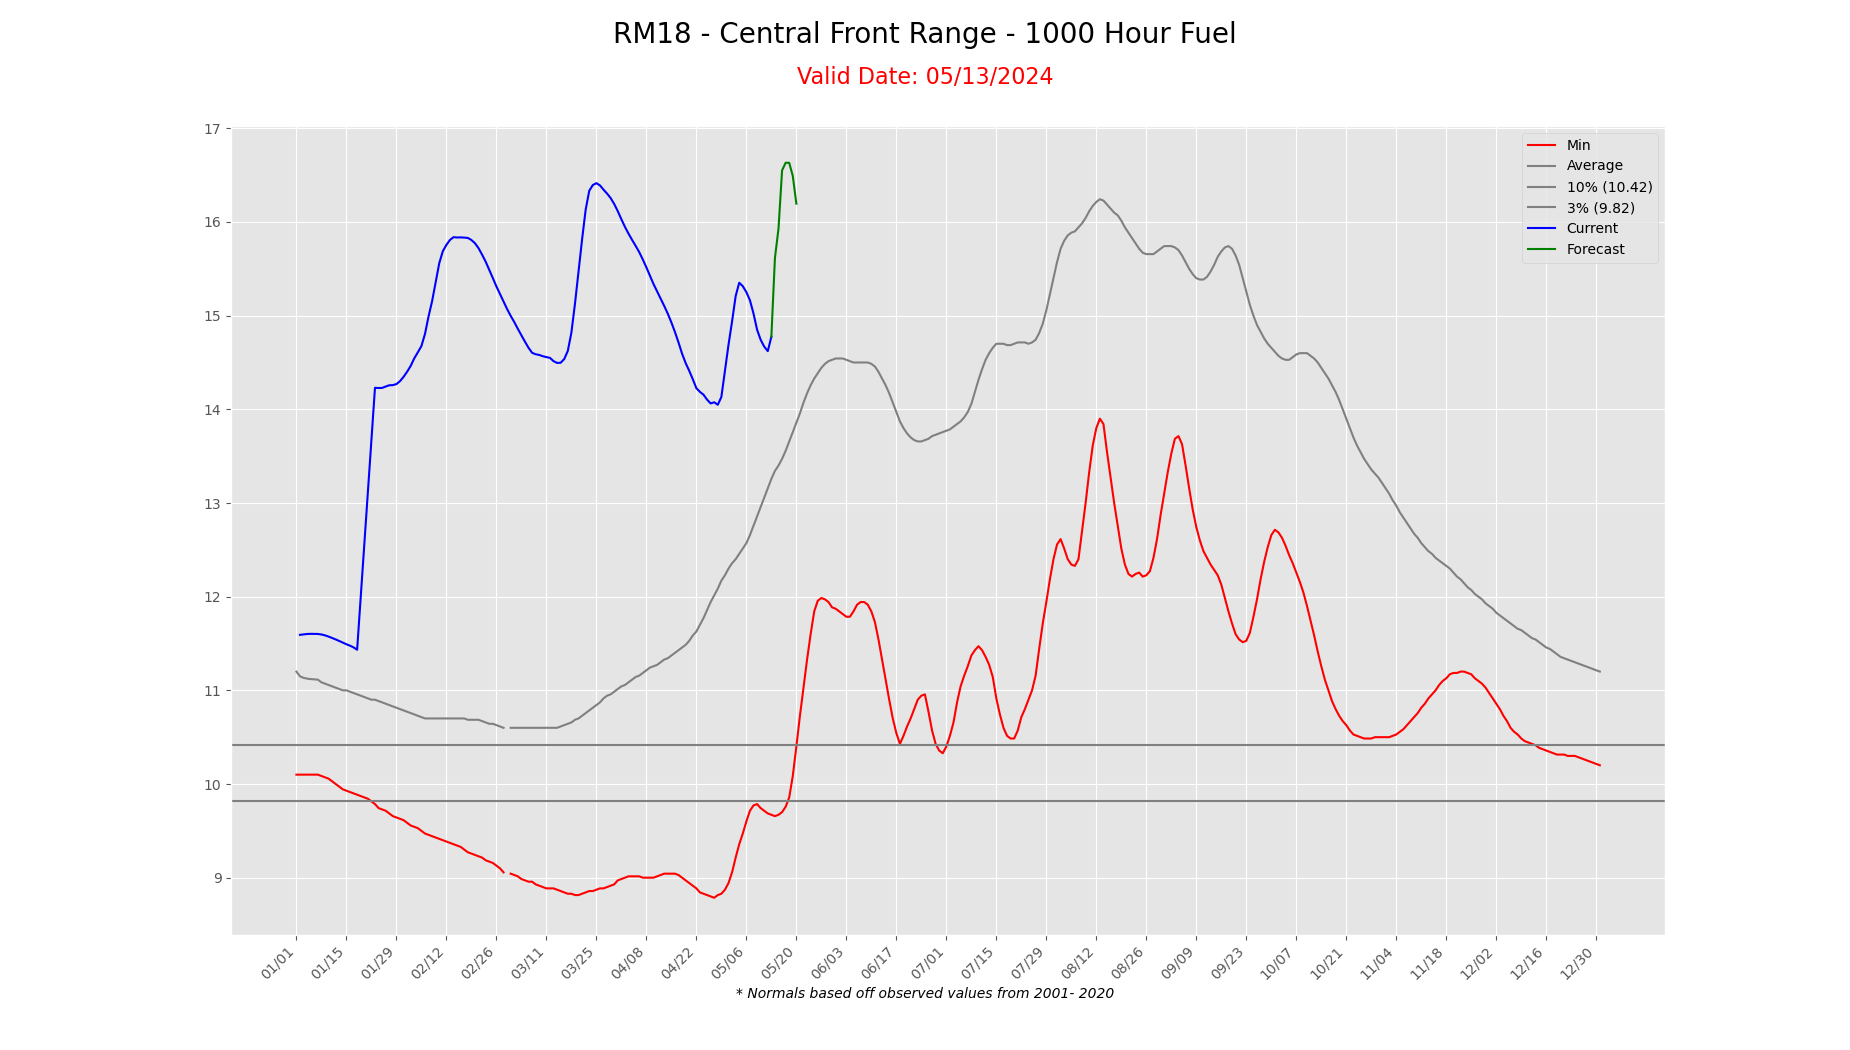
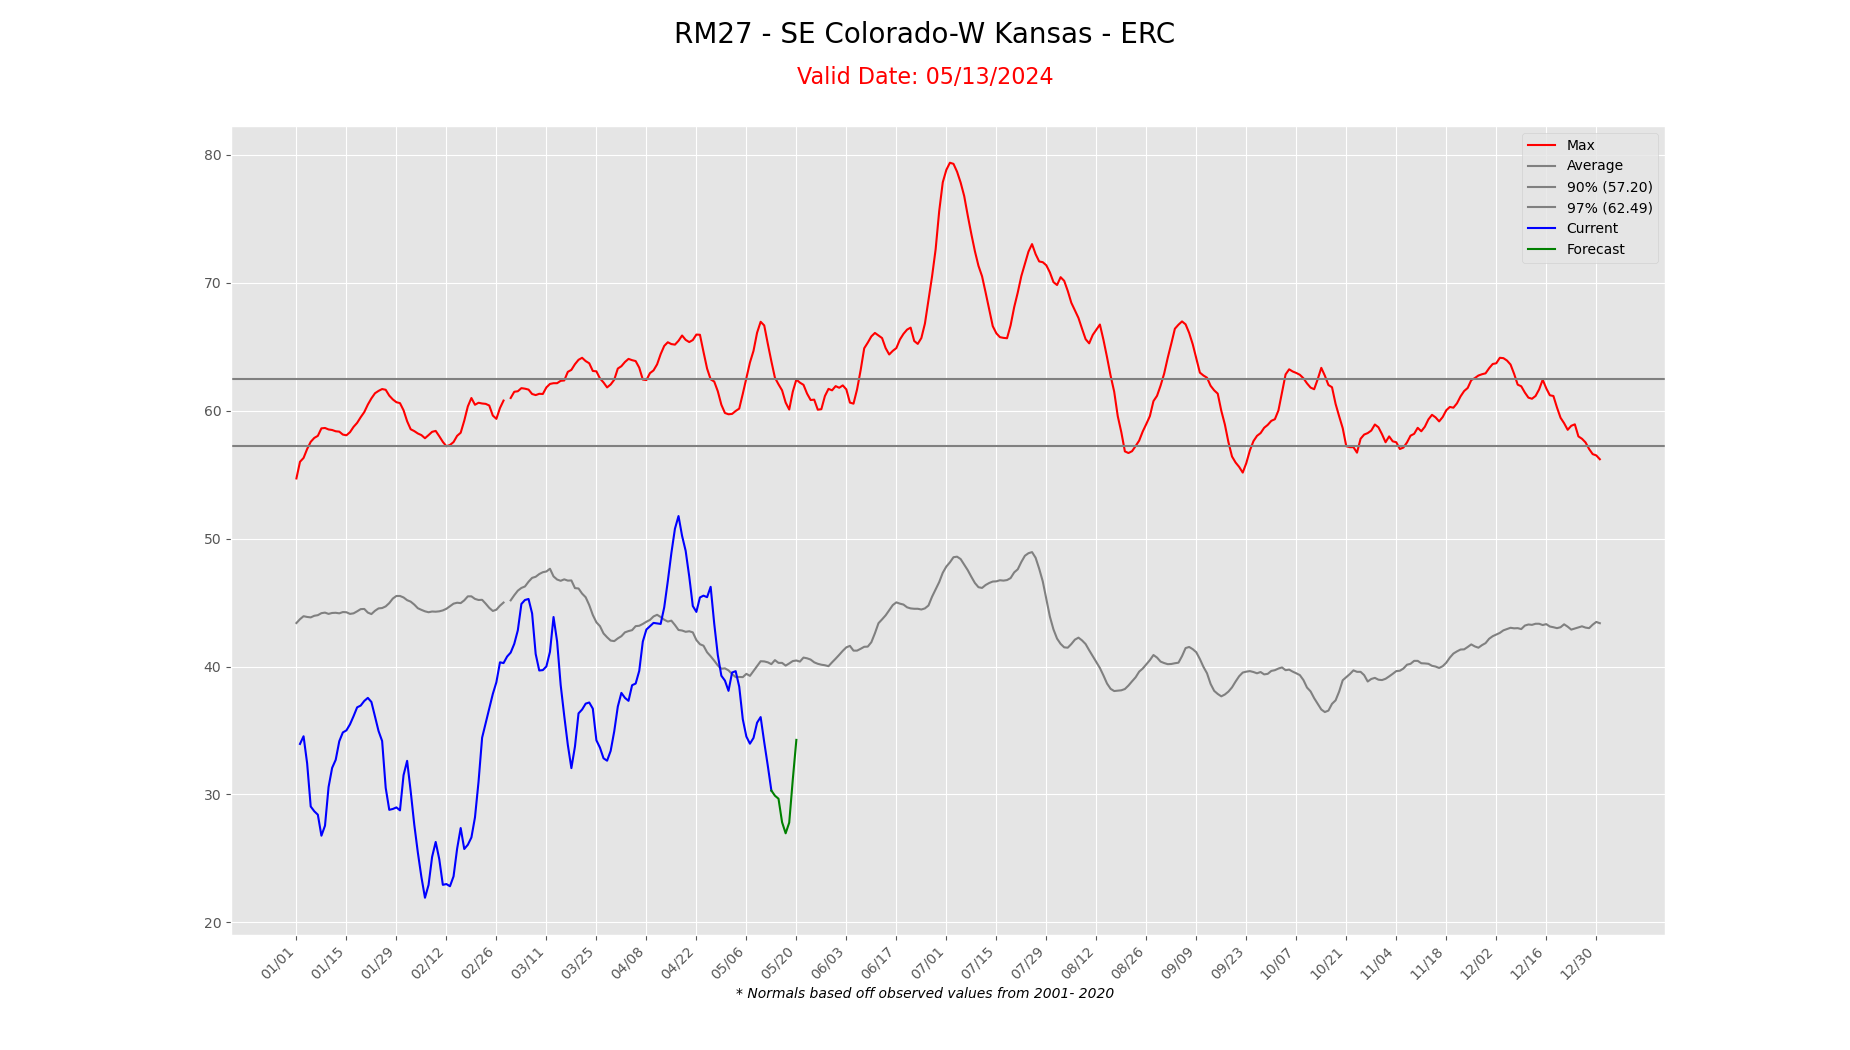
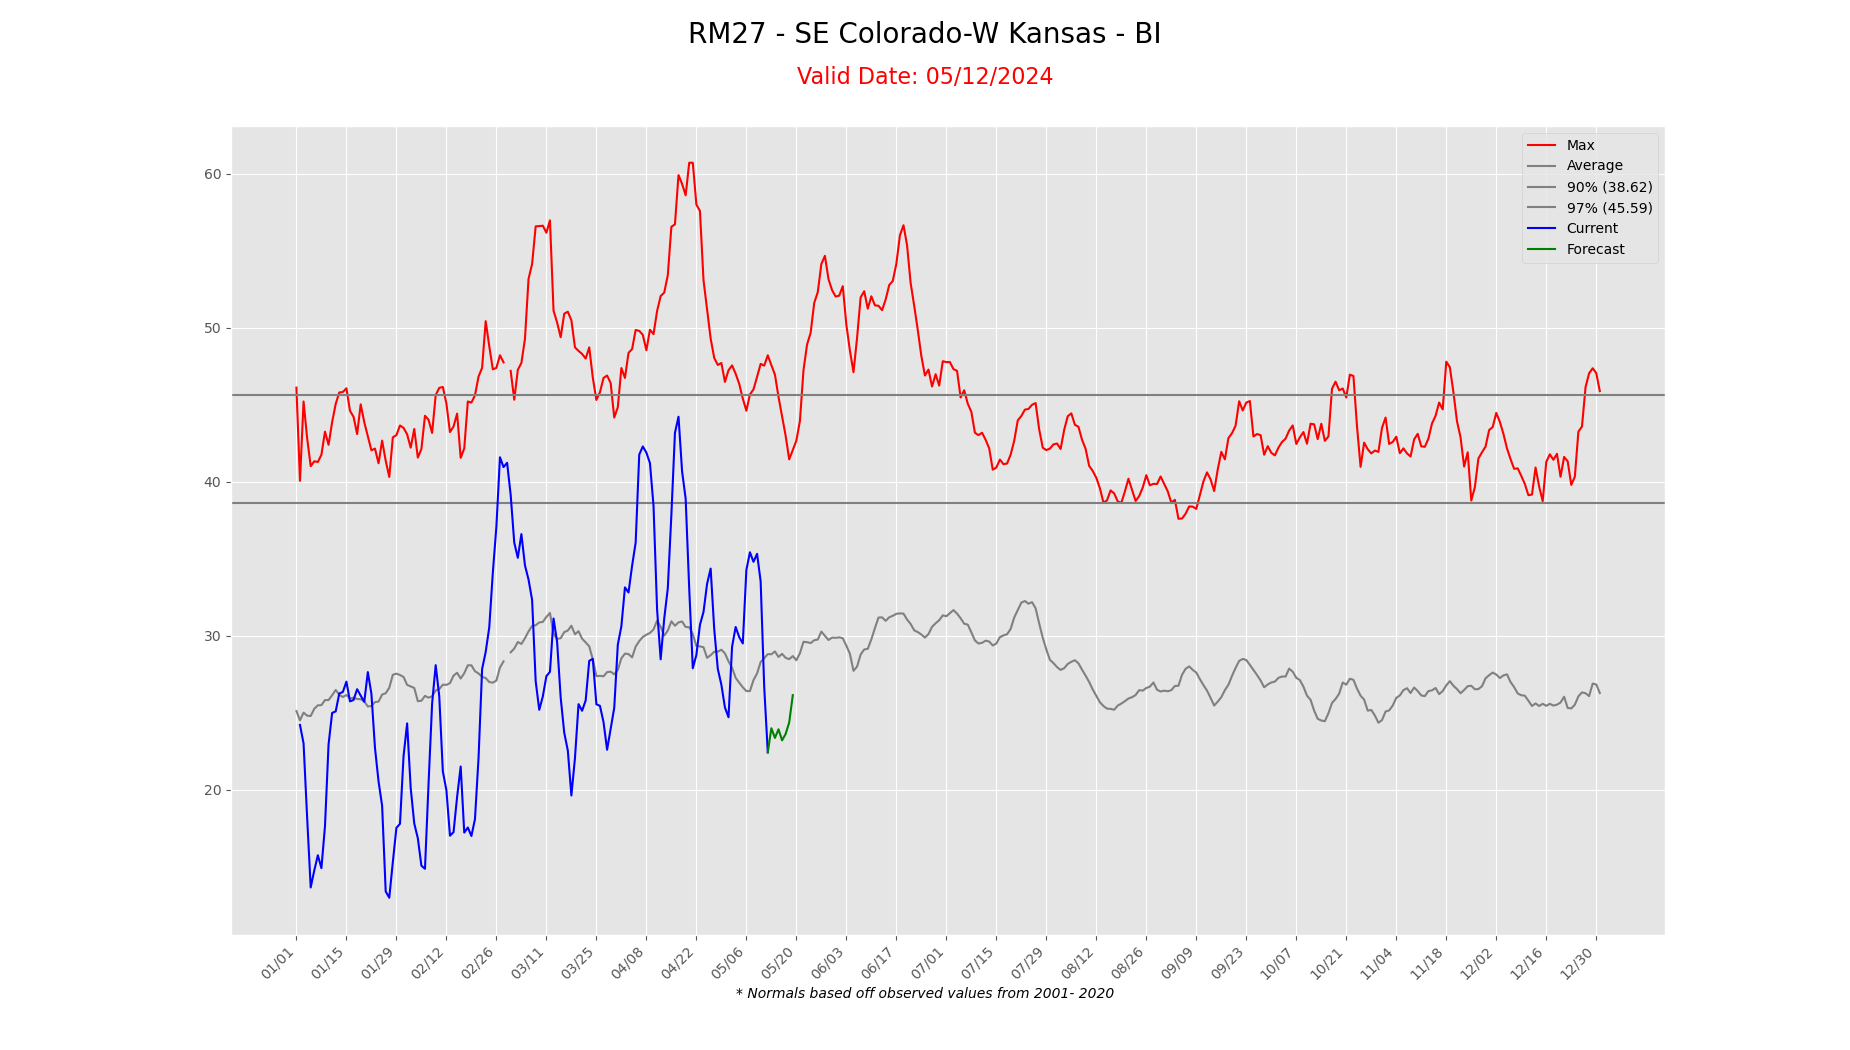
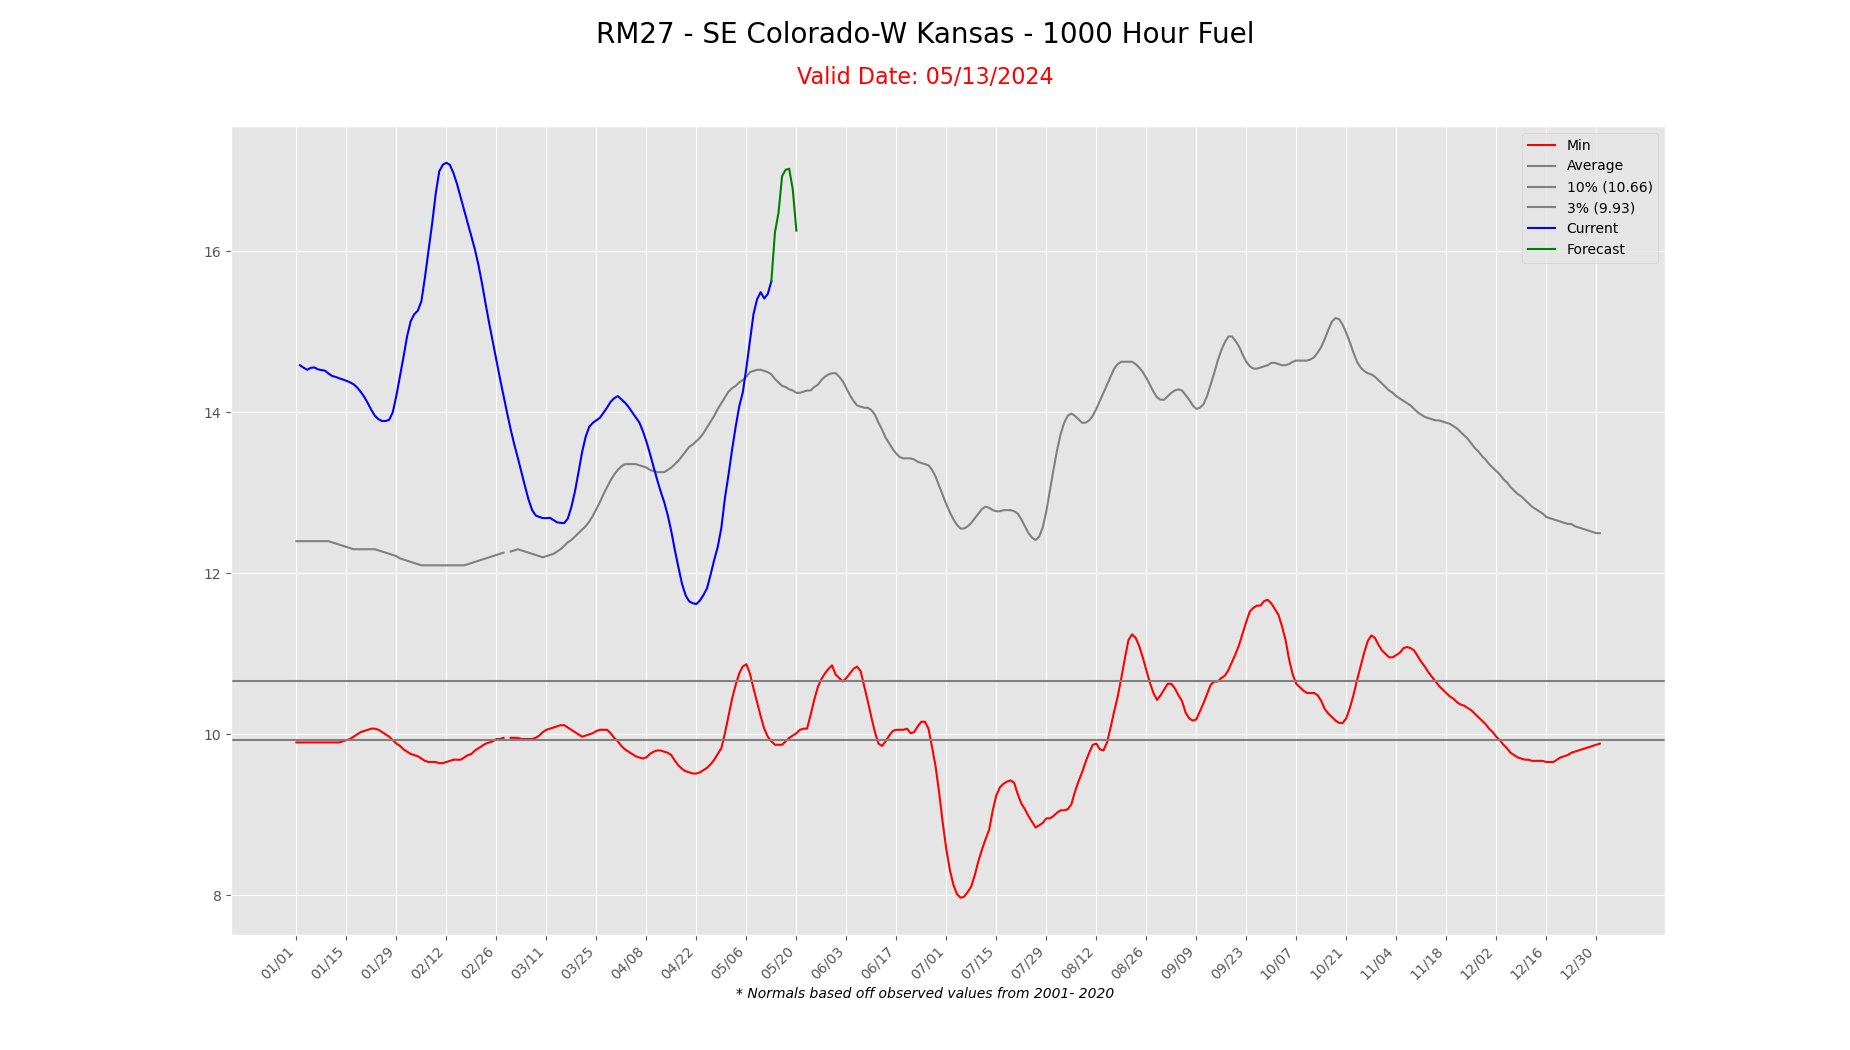
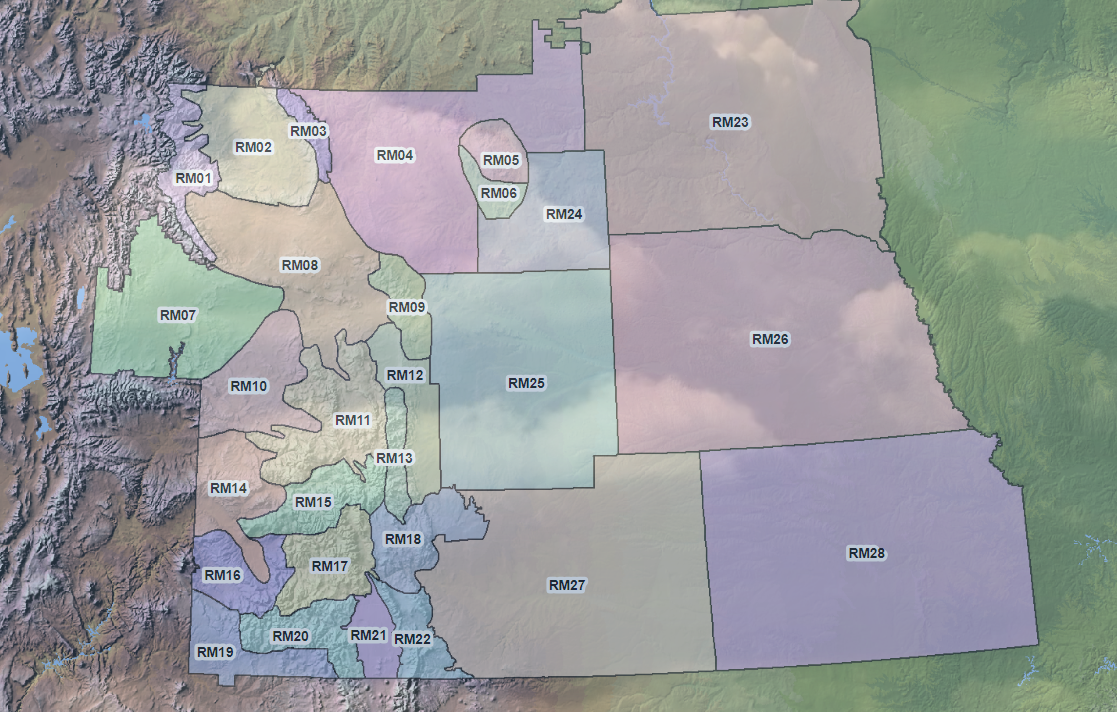
To view a clickable map of all PSAs for the Rocky Mountain Region (not just NE Colorado), and corresponding ERC/BI/100-hr/1,000-hr graphs, click here.
Predictive Service Area
(PSA)
Energy Release Component (ERC)
Burning Index
(BI)
100-hr
1,000-hr
RM11
North Park
Park Range
Medicine Bow Range
Routt NF
RM13
Northern Front Range Mountains
Front Range Foothills (high elevations)
RM12
Front Range Foothills (low to mid elevations)
I-25 Corridor
Denver Metro
RM25
Northeast Colorado Plains
RM15
I-70 Mountain Corridor
Summit County
Vasquez Peak Wilderness
RM18
Park County (South Park)
Pike NF
Palmer Divide
RM27
Southeast Colorado Plains
Includes Lincoln County
Map of RMACC Predictive Service Areas (PSAs):
Palmer Drought Index
The Palmer Drought Index depicts prolonged (months, years) abnormal dryness or wetness. It responds slowly, changing little from week to week, and reflects long-term moisture runoff, recharge, and deep percolation as well as evapotranspiration. It is applicable in measuring disruptive effects of prolonged dryness or wetness on water-sensitive economies, designing disaster areas of drought or wetness, and reflecting the general long-term status of water supplies in aquifers, reservoirs and streams. It is not generally indicative of short-term (few weeks) status of drought or wetness such as frequently impacts crops and field operations.
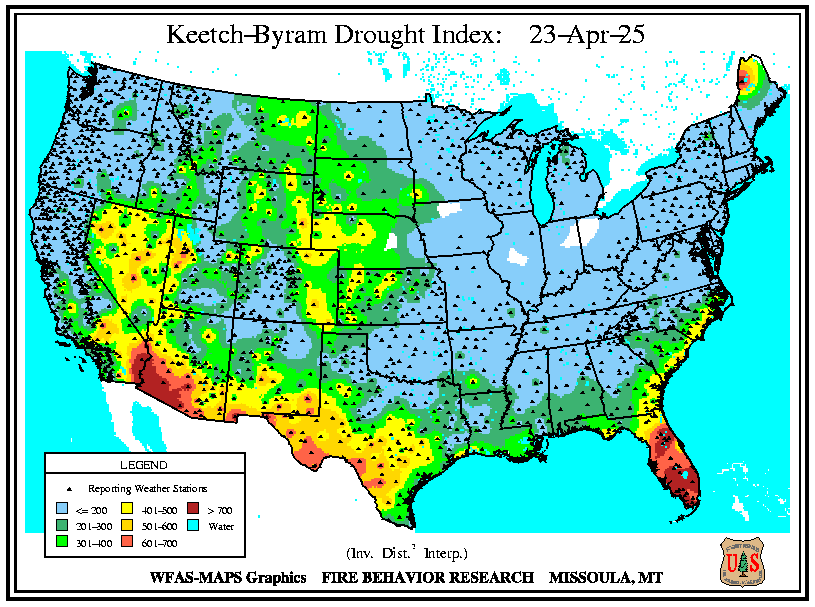
Keetch-Byram Drought Index
The KBDI attempts to measure the amount of precipitation necessary to return the soil to full field capacity. It is a closed system ranging from 0 to 800 units and represents a moisture regime from 0 to 8 inches of water through the soil layer. At 8 inches of water, the KBDI assumes saturation. Zero is the point of no moisture deficiency and 800 is the maximum drought that is possible. At any point along the scale, the index number indicates the amount of net rainfall that is required to reduce the index to zero, or saturation.
The inputs for KBDI are weather station latitude, mean annual precipitation, maximum dry bulb temperature, and the last 24 hours of rainfall. Reduction in drought occurs only when rainfall exceeds 0.20 inch (called net rainfall). The computational steps involve reducing the drought index by the net rain amount and increasing the drought index by a drought factor.
KBDI = 0 - 200: Soil moisture and large class fuel moistures are high and do not contribute much to fire intensity. Typical of spring dormant season following winter precipitation.
KBDI = 200 - 400: Typical of late spring, early growing season. Lower litter and duff layers are drying and beginning to contribute to fire intensity.
KBDI = 400 - 600: Typical of late summer, early fall. Lower litter and duff layers actively contribute to fire intensity and will burn actively.
KBDI = 600 - 800: Often associated with more severe drought with increased wildfire occurrence. Intense, deep burning fires with significant downwind spotting can be expected. Live fuels can also be expected to burn actively at these levels.
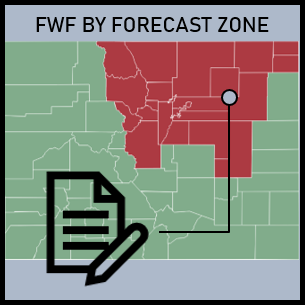
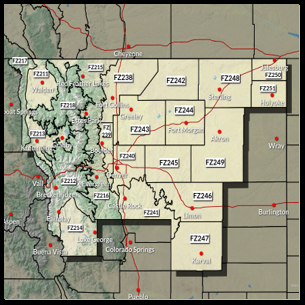
Graphics are hyperlinks to their sources. For a map of Forecast Zones, click here. For questions on interpreting these plots, navigating the IEM webpage, or obtaining historical data from prior years, contact bruno.rodriguez@noaa.gov.
Number of RFWs by Forecast Zone (Year-to-Date)
Number of RFWs by NWS Office (Year-to-Date)
Monthly/Annual RFW Event Count for NWS Boulder
Calendar/Daily Plot of RFW Events for NWS Boulder
Monthly/Annual RFW Event Count by Zone:
Calendar/Daily Plot of RFW Events by Zone:
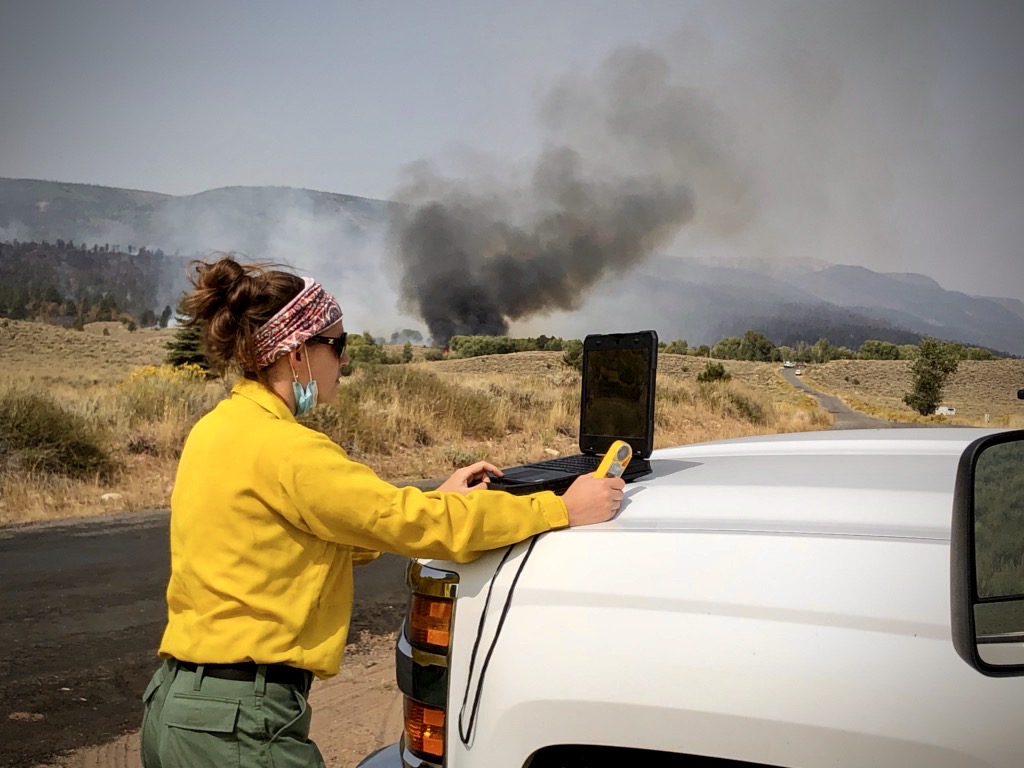
Incident Meteorologist (IMET)
The National Weather Service has over 100 IMETs (certified and trainees) nationwide ready to provide on-site support for major wildfires and prescribed burn projects, including one IMET stationed locally at NWS Denver/Boulder.
IMETs integrate with Incident Management Teams (IMTs) for up to 14 days, providing critical forecast information to help inform tactical and strategic decisions. The safety of firefighters is also of utmost importance, and IMETs stand ready to provide timely alerts for any potentially dangerous incoming weather conditions.
Additionally, an agreement between the USFS and NOAA and was recently extended to prescribed burns, whereby IMETs may be ordered for complex projects requiring extensive meteorological forecasting and observational capabilities.
Click here to learn more about the role of Incident Meteorologists.
S-290 & S-390 Training
S-290 and S-390 are the second and third courses respectively in a series that collectively serves to develop fire behavior prediction knowledge and skills for fire practitioners. Weather units are a critical component of both of these courses. The NWS Boulder Fire Weather Program Lead may be available to instruct the units for either of the courses, virtually or in person, at the request of land management agencies and contingent upon staffing. Please contact bruno.rodriguez@noaa.gov for inquiries on instruction for these courses.
Fire Weather Partner Email
We provide once or twice weekly fire weather outlook emails to core partners, from land management agencies to emergency management, which includes forecast graphics for relevant variables and a discussion highlighting the timing and location of fire weather concerns in the coming days. To sign up to receive this correspondence, fill out the Google Form below. Please note that this product is only available to individuals affiliated with official agencies, and an agency email will be required to sign up.


.jpg)
 Follow us on YouTube