 |
 |
|
Full Weather Briefing (pdf) Latest Briefing Created: Thu Apr 10 09:45:02 EDT 2025 |
|
Daily Situation Report (pdf) Thu Mar 27 16:00:01 EDT 2025 |
Observed Weather Briefing
 |
 Northeast Regional Radar Loop |
 NWS Wakefield, VA Radar Loop |
 Dover, AFB |
 Morehead City, NC |
 Raleigh, NC |
 Sterling, VA |
 Blacksburg, VA |
 Fort Dix, NJ |
||
| Click Here for Interactive Radar Display | ||||
 Atlantic Coast Visible Loop |
 Atlantic Coast IR Loop |
 Tropical Atlantic Loop |
| Additional Satellite Imagery |
 US Surface Analysis |
 US Surface Analysis with Radar |
 US Surface Temps | N America | World |
| Hourly Weather Roundups | Regional Temp/Precip Summaries | Miscellaneous Links |
| Virginia | Supplemental Obs | Virginia | COOPs | CoCoRaHS | Rainfall Monitor(real time) |
Weather Hazards Outlook
|
|
|
 |
|
|
|
|
 Hazard next several Days") |
|
|
|
|
 |
|
|
|
|
 |
|
|
|
|
 |
|
|
|
|
|
Days 1-3 Maximum Non-TS Wind Gusts
|
|
|
|
|
Rainfall and Flood Threat Briefing
| How Much Rain Has Fallen? (Interactive) | |
 |
 |
| Precipitation Forecasts | ||||
| DAY 1 Precip Forecast | DAY 2 Precip Forecast | DAY 3 Precip Forecast | DAY 1 - 3 Total Precip Forecast | |
 |
 |
 |
 |
 |
| WORST CASE | |||
| 0-72 HR Worst Case PRECIP Amounts (Model Based) | |||
 |
|||
| Day 1 Excessive Rainfall Outlook | Day 2 Excessive Rainfall Outlook | Day 3 Excessive Rainfall Outlook |
 |
 |
 |
| Day 1 Precipitation | Day 2 Precipitation | Day 3 Precipitation |
 |
 |
 |
| Day 4-5 Precipitation | Day 6-7 Precipitation | 7-Day Total Precipitation |
 |
 |
 |
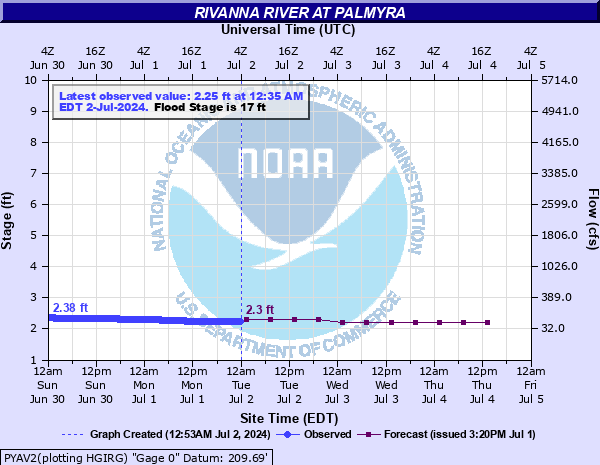
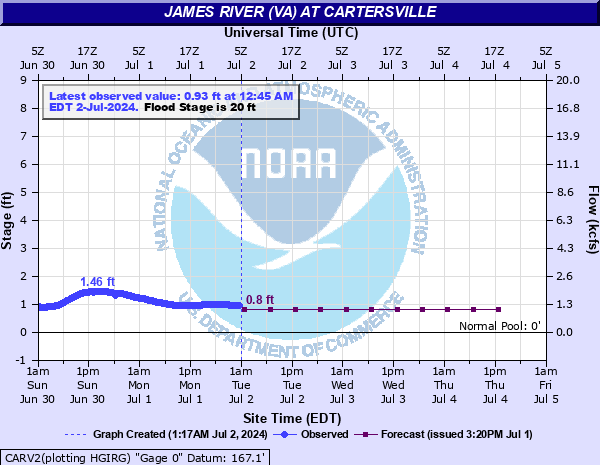
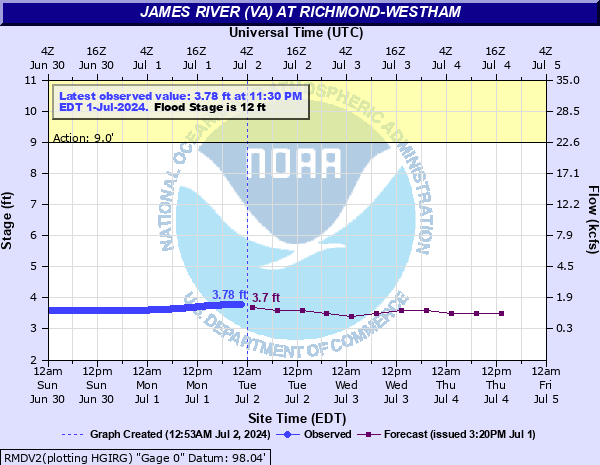
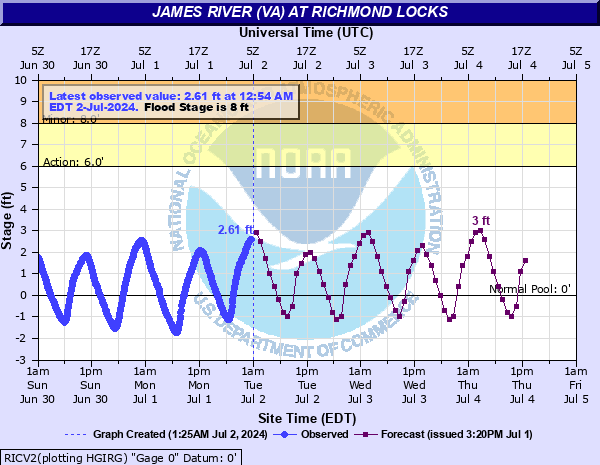
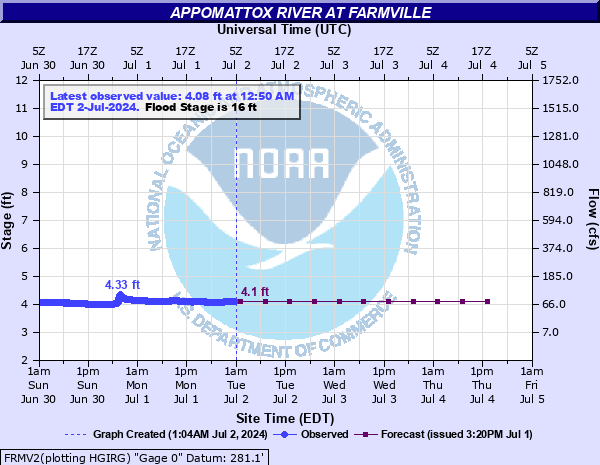
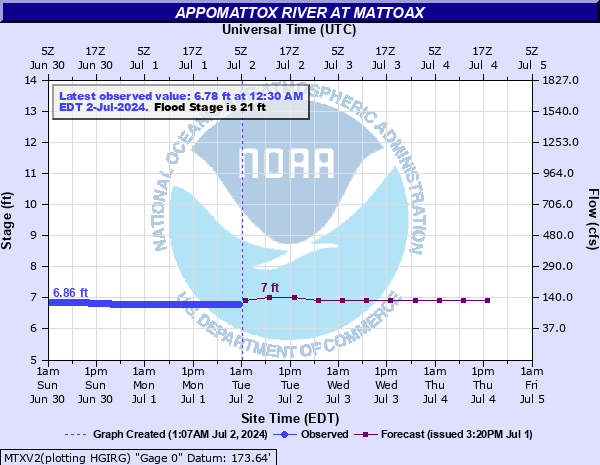
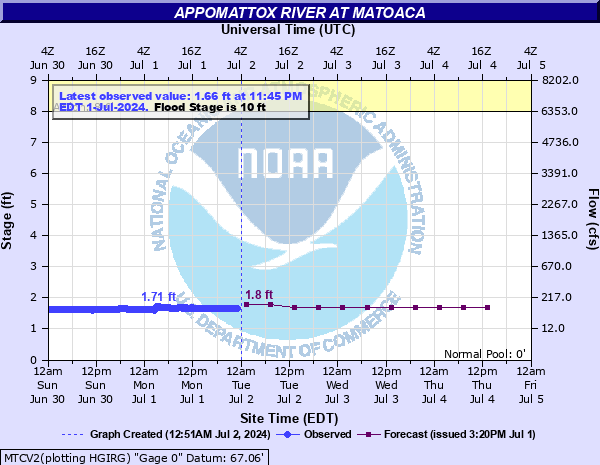
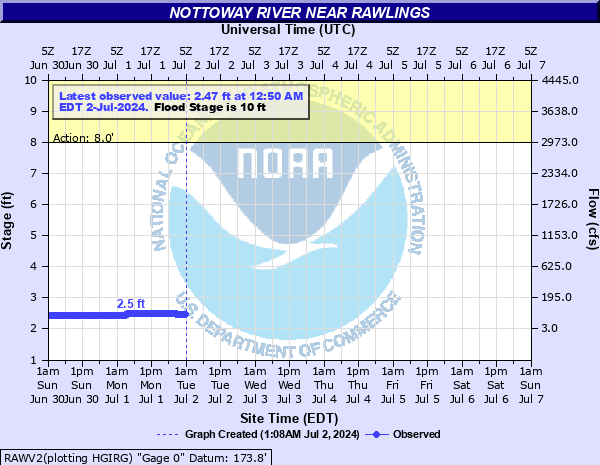
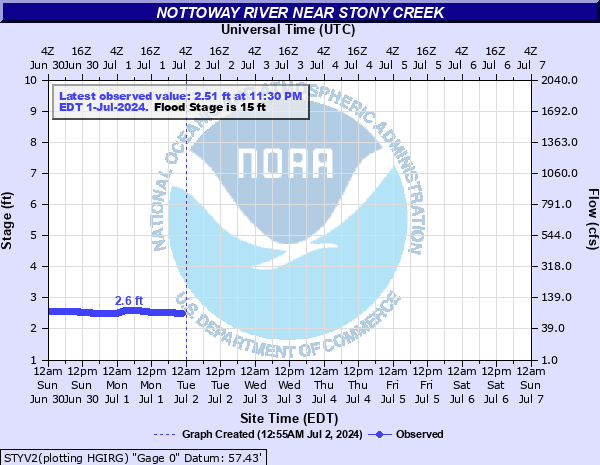
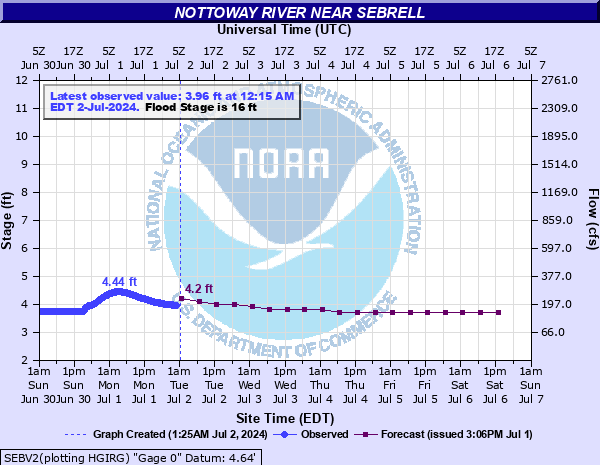
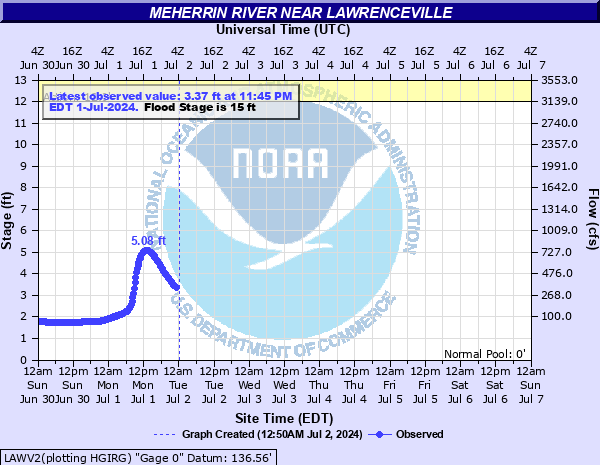
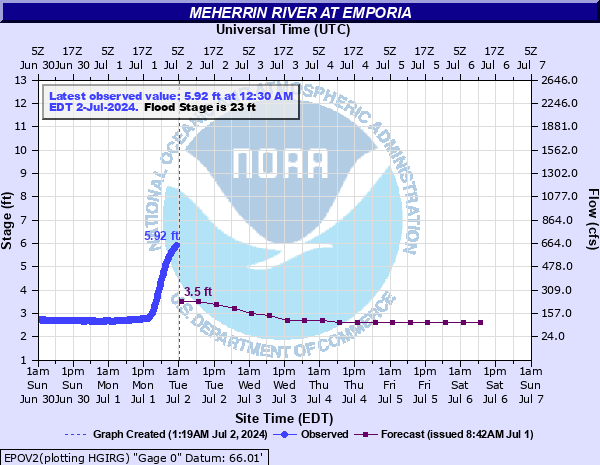
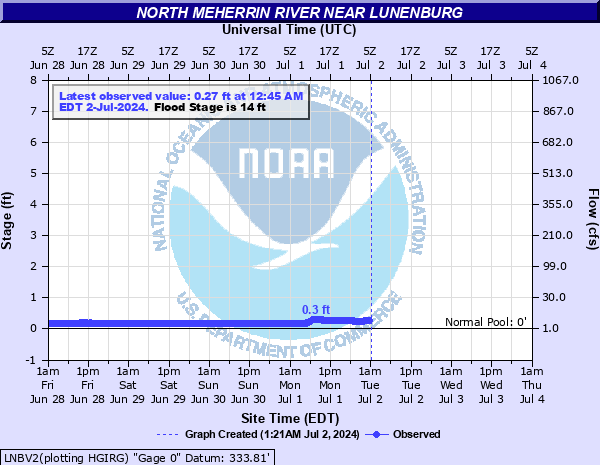
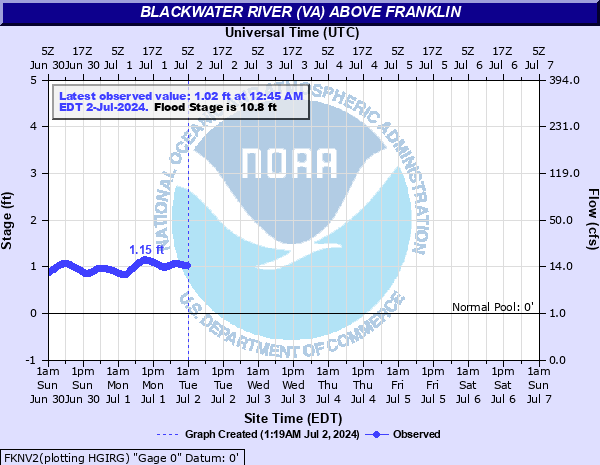
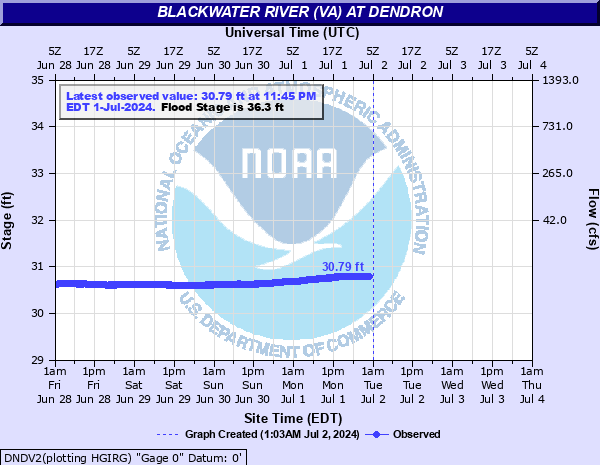
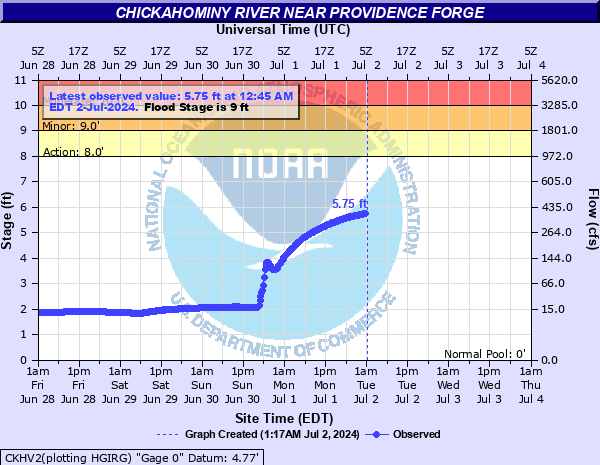
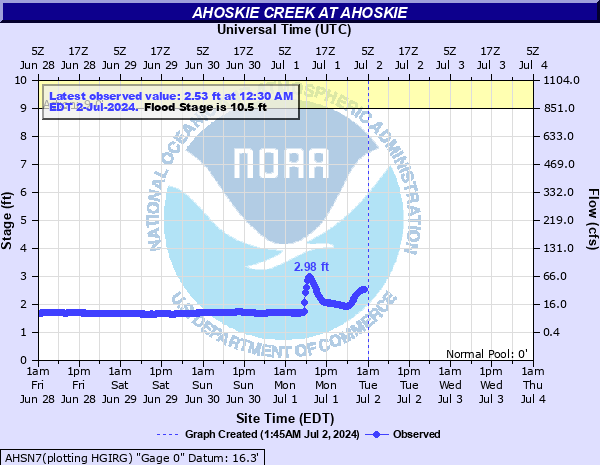
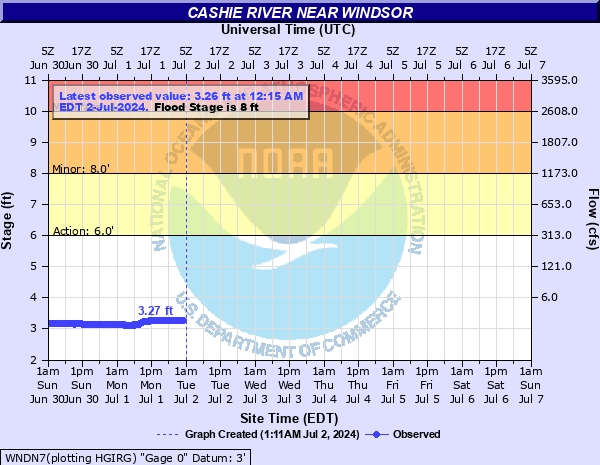
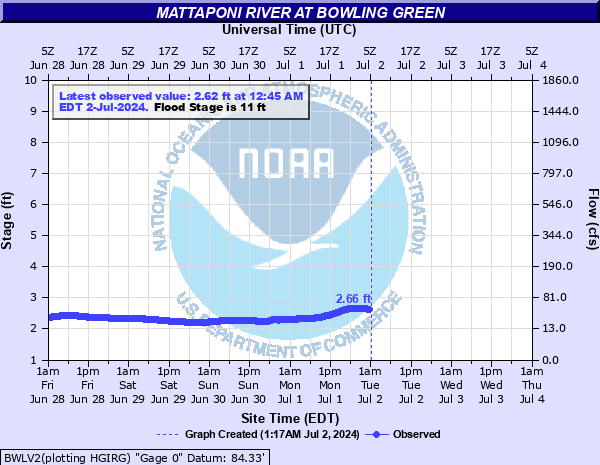
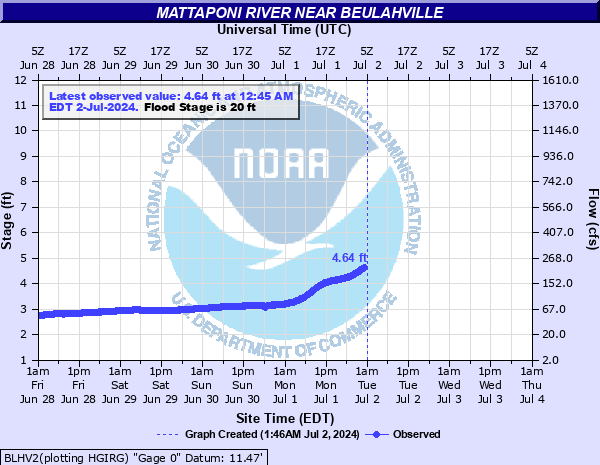
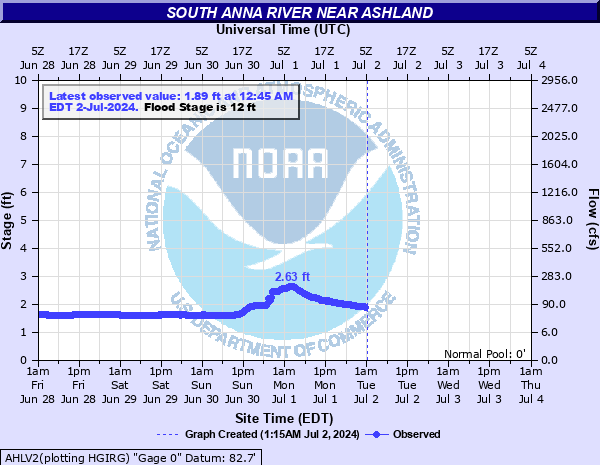
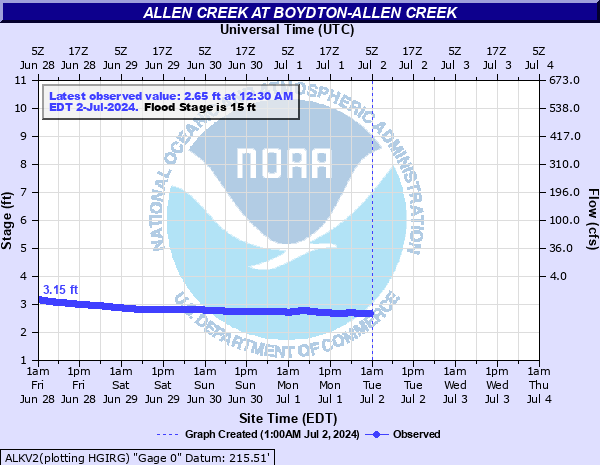
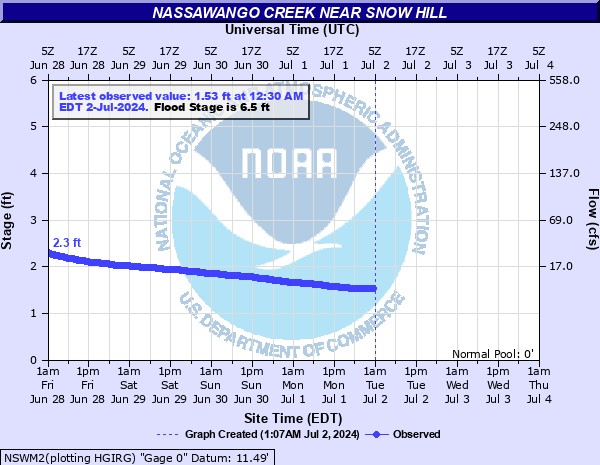
Hydrographs (showing stages and flows over time) are available through the National Water Prediction Service by clicking site names.
Mouse over each site to display hydrograph.
Hydrographs (showing stages and flows over time) are available through AHPS (Advanced Hydrologic Prediction Service) by clicking site names.
|
||||||||||||||||||||||||||||||||||||||||||||||||||||||||||||||||||||||||||||||||||||||||||||||||||||||||||||||||||||||||||||||||||||||||||||||||||||||||||||||||||||||||||||||||||||||||||||||||||||||||||||||||||||||||||||||||||||||||||||||||||||||||||||||||||||||||||||||||||||||||||||||||||||||||||||||||||||||||||||||||||||||||||||||||||||||||||||||
Thunderstorm Threat Briefing
|
|
|
|
|||||||
|
|
|
|
|||||||
|
|
|
|
|||||
| Days 4-7 Thunderstorm Outlooks | |||
 |
 |
 |
 |
 |
 |
 |
 |

 |
Current Watches |
Storm Trend Discussions |
Today's Storm Reports |
Yesterday's Storm Reports |
| SPC Day 1 Thunderstorm Outlook | SPC Day 1 Tornado Outlook | SPC Day 1 Severe Wind Outlook | SPC Day 1 Severe Hail Outlook |
 |
 |
 |
 |
| SPC Day 1 Thunderstorm Outlook Discussion | |||
| SPC Day 2 Thunderstorm Outlook | SPC Day 2 Tornado Outlook | SPC Day 2 Severe Wind Outlook | SPC Day 2 Severe Hail Outlook |
 |
 |
 |
 |
| SPC Day 2 Thunderstorm Outlook Discussion | |||
| SPC Day 3 Thunderstorm Outlook | SPC Day 4-8 Thunderstorm Outlook |
 |
 |
| SPC Day 3 Outlook Narrative | SPC Day 4-8 Outlook Narrative |
Winter Weather Threat Briefing
| Day 1 Snow Forecast | Day 2 Snow Forecast | Day 3 Snow Forecast | |
 |
 |
 |
|
| Day 1-3 Snow Totals | Worst Case Forecast 0-72 hour Snowfall | Winter Storm Severity Index |
 |
 |
 |
| CWA Snow Probabilities | ||||||
| Likelihood of 1 Inch Snow over next 3 Days | Likelihood of 2 Inch Snow over next 3 Days | Likelihood of 4 Inch Snow over next 3 Days | Likelihood of 6 Inch Snow over next 3 Days | Likelihood of 8 Inch Snow over next 3 Days | Likelihood of 12 Inch Snow over next 3 Days | |
 |
 |
 |
 |
 |
 |
|
| Peak Snow Rate (every 6 hours) in in/hr | ||||||
| 0-6HR Peak Snow Rate (in/hr) | 6-12HR Peak Snow Rate (in/hr) | 12-18HR Peak Snow Rate (in/hr) | 18-24HR Peak Snow Rate (in/hr) | 24-30HR Peak Snow Rate (in/hr) | ||
 |
 |
 |
 |
 |
||
| Snow Character (wet or dry) - every 6 hours | ||||||
| 0-6HR Snow Character | 6-12HR Snow Character | 12-18HR Snow Character | 18-24HR Snow Character | 24-30HRSnow Character | ||
 |
 |
 |
 |
 |
||
| 30-36HR Snow Character | 36-42HR Snow Character | 42-54HR Snow Character | 48-54HR Snow Character | 54-60HRSnow Character |
 |
 |
 |
 |
 |
| 60-66HR Snow Character | 66-72HR Snow Character | |||
 |
 |
| 30 Hour Forecast Snow Amounts (6 Hour Periods) | ||||||
| 0 to 6 Hours | 6 to 12 Hours | 12 to 18 Hours | 18 to 24 Hours | 24 to 30 Hours | 30 to 36 Hours | |
 |
 |
 |
 |
 |
 |
|
| Day 1 Ice Accumulation Forecast | Day 2 Ice Accumulation Forecast | Day 3 Ice Accumulation Forecast | Day 1-3 Ice Totals |
 |
 |
 |
 |
| 30 Hour Forecast Ice Accumulation (6 Hour Periods) | ||||||
| 0 to 6 Hours | 6 to 12 Hours | 12 to 18 Hours | 18 to 24 Hours | 24 to 30 Hours | 30 to 36 Hours | |
 |
 |
 |
 |
 |
 |
|
| Day 1 Snowfall Greater Than 4" | Day 2 Snowfall Greater Than 4" | Day 3 Snowfall Greater Than 4" |
 |
 |
 |
| Day 1 Freezing Rain Greater than 1/4" | Day 2 Freezing Rain Greater than 1/4" | Day 3 Freezing Rain Greater than 1/4" |
 |
 |
 |
| Day 4 Experimental Winter Weather Outlook | Day 5 Experimental Winter Weather Outlook | Day 6 Experimental Winter Weather Outlook | Day 7 Experimental Winter Weather Outlook |
 |
 |
 |
 |
| Snow Threat: 3-7 Days From Now | ||||||
| Day 3 | Day 4 | Day 5 | Day 6 | Day 7 | ||
 |
 |
 |
 |
 |
||
| Ice Threat: 3-7 Days From Now | ||||||
| Day 3 | Day 4 | Day 5 | Day 6 | Day 7 | ||
 |
 |
 |
 |
 |
||
Long Range Outlook Briefing
| Days 3-7 Hazards Outlook (WPC) |
") |
| Days 8-14 Hazards Outlook (CPC) | Days 8-14 Risk of Hazardous Temperatures (CPC) | Days 8-14 Risk of Heavy Precipitation (CPC) |
") |
") |
") |
| 6-10 Day Temperature Outlook (CPC) | 6-10 Day Precipitation Outlook (CPC) |
 |
 |
| 8-14 Day Temperature Outlook (CPC) | 8-14 Day Precipitation Outlook (CPC) |
 |
 |
| **Experimental** Week 3-4 Temperature Outlook (CPC) | **Experimental** Week 3-4 Precipitation Outlook (CPC) |
 |
 |
| One Month Temperature Outlook (CPC) | One Month Precipitation Outlook (CPC) |
 |
 |
| Three Month Temperature Outlook (CPC) | Three Month Precipitation Outlook (CPC) |
 |
 |
Drought and Fire Weather Threat Briefing
| Day 1 Max Temp Forecast | Day 2 Max Temp Forecast | Day 3 Max Temp Forecast |
 |
 |
 |
| Day 1 Min RH Forecast | Day 2 Min RH Forecast | Day 3 Min RH Forecast |
 |
 |
 |
| Day 1 Max Wind Gust | Day 2 Max Wind Gust | Day 3 Max Wind Gust |
 |
 |
 |
| SPC Fire Weather Day 1 Outlook | SPC Fire Weather Day 2 Outlook | SPC Fire Weather Day 3-8 Outlook |
 |
 |
 |
 |
 |
| Seasonal Drought Outlook | NIFC Significant Fire Potential Outlook |
 |
 |
Cold Threat Briefing?
| Day 1 Excessive Cold Risk | Day 2 Excessive Cold Risk | Day 3 Excessive Cold Risk |
 |
 |
 |
 |
||
| Day 1 Min Temp Forecast | Day 2 Min Temp Forecast | Day 3 Min Temp Forecast |
 |
 |
 |
| Day 1 Wind Chill Forecast | Day 2 Wind Chill Forecast | Day 3 Wind Chill Forecast |
 |
 |
 |
| 0-72 HR COLDEST WIND CHILL TEMPS |
 |
| Day 1 Max Temp Forecast | Day 2 Max Temp Forecast | Day 3 Max Temp Forecast |
|
|
|
|
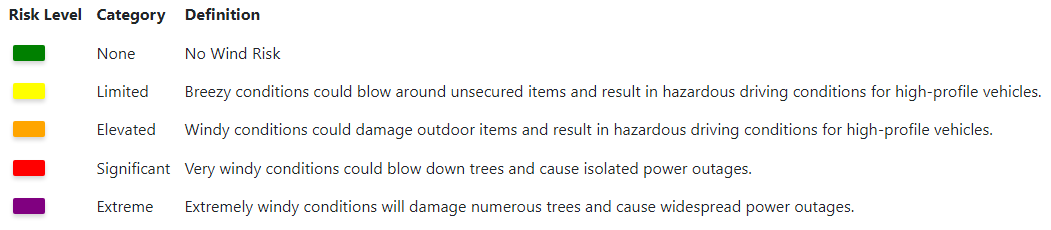
Wind Threat Briefing
| Day 1 Wind Risk | Day 2 Wind Risk | Day 3 Wind Risk |
 |
 |
 |
 |
||
| Day 1 Max Sustained Wind | Day 2 Max Sustained Wind | Day 3 Max Sustained Wind |
 |
 |
 |
| Day 1 Max Wind Gust | Day 2 Max Wind Gust | Day 3 Max Wind Gust |
|
|
|
| 0-72 HR Max SUSTAINED Wind | 0-72 HR Max Wind GUST | 0-72 Hour HR Worst Cast Peak Wind Gust |
 |
 |
 |
| 3 Hourly Wind Speed & Direction Forecasts |
 |
 |
 |
 |
 |
 |
|
| 3 Hourly Wind Gusts |
 |
 |
 |
 |
 |
 |
|
|
Thunderstorm, Tornado and Lightning Safety
|
Winter Weather Safety
|
NOAA Weather Radio
|
||||
|
Hurricane Safety and Preparedness
|
Flooding Safety
|
|||||
|
Heat Safety
|
Miscellaneous Safety and Preparedness
|
|||||
|
Additional NWS Preparedness Web Pages
|
||||||
|
More Useful Resources
|
||||||
Marine Product/Threat Briefing?
| Marine Observations as of 5:00 PM EDT Sun Apr 13 2025 | |||||||
| Location | UTC TIME | Air Temp (°F) |
Water Temp (°F) |
Wind (DIR/SP/Gust) |
Pres (mb) |
Wave&Swell (HT/PER) |
|
| Baltimore Harbor | 2024 | 60 | 52 | 330/ 9/ 14 | N/A | ||
| Tolchester Beach | 2024 | 56 | 340/ 9/ 11 | 1014.0 | |||
| Francis S Key Br | 2024 | 58 | 330/ 13/ 15 | 1014.1 | |||
| Cambridge MD | 2024 | 58 | 54 | 310/ 9/ 13 | 1014.5 | ||
| Thomas Pt, MD | 2100 | 59 | 280/ 14/ 16 | 1015.0 | |||
| Gooses Reef, MD | 2042 | 56 | 52 | 310/ 10/ 14 | N/A | 1 | |
| Cove Pt, MD | 2024 | 57 | 350/ 11/ 16 | 1014.7 | |||
| Piney Pt, MD | N/A | N/A | N/A | N/A | N/A | N/A | N/A |
| Bishops Head, MD | 2024 | 57 | 54 | 300/ 15/ 19 | 1014.2 | ||
| Potomac, MD | 2042 | 55 | 53 | 290/ 16/ 19 | N/A | 1 | |
| Solomons Island, MD | N/A | N/A | N/A | N/A | N/A | N/A | N/A |
| Lewisetta, VA | 2024 | 55 | 310/ 12/ 16 | 1015.0 | |||
| Dahlgren, VA | 2024 | 62 | 53 | 340/ 5/ 14 | 1014.4 | ||
| Rappahannock Light | 2024 | 20/ 5/ 6 | 1016.6 | ||||
| StingRay Pt | N/A | N/A | N/A | N/A | N/A | N/A | N/A |
| Yorktown, VA | 2024 | 61 | 58 | 320/ 12/ 15 | 1014.5 | ||
| Buoy 44072 York | 2042 | 54 | 56 | 100/ 8/ 10 | N/A | 1 | |
| Jamestown, VA | N/A | N/A | N/A | N/A | N/A | N/A | N/A |
| Willouby Stn, VA | 2024 | 55 | 90/ 8/ 10 | 1015.1 | |||
| Dominion Term Stn | 2024 | 60 | 310/ 12/ 14 | 1015.1 | |||
| Money Pt | 2024 | 63 | 60 | 330/ 6/ 13 | 1014.7 | ||
| Sewells Pt | 2024 | 60 | 58 | 1014.3 | |||
| Kiptopeke, VA | 2024 | 55 | 55 | 320/ 7/ 8 | 1015.0 | ||
| Ches Bay Bridge | 2024 | 58 | CALM / 2 | 1014.4 | |||
| Cape Henry,VA | 2024 | 54 | 10/ 4/ 6 | 1015.4 | |||
| Lewes, DE | 2024 | 53 | 49 | 250/ 8/ 11 | 1013.4 | ||
| Buoy 44009 | 2050 | 51 | 46 | 310/ 8/ 10 | 1012.8 | 5 | |
| Brandywine Light | 2024 | 53 | 320/ 10/ 11 | 1013.3 | |||
| Ocean City Inlet | 2024 | 56 | 49 | 360/ 15/ 20 | 1011.5 | ||
| Wachapreague, VA | 2024 | 57 | 56 | 320/ 8/ 15 | 1014.7 | ||
| Wallops Island Buoy | 2056 | 50 | N/A | 4 | |||
| Cape Henry Buoy | 2056 | 53 | N/A | 4 | |||
| Cape Charles Buoy | N/A | N/A | N/A | N/A | N/A | N/A | N/A |
| 1st Landing Buoy | N/A | N/A | N/A | N/A | N/A | N/A | N/A |
| Buoy 44014 | 2050 | 51 | 51 | 310/ 8/ 10 | 1015.4 | 5 | |
| Duck Pier | N/A | N/A | N/A | N/A | N/A | N/A | N/A |
| Buoy 44056 | N/A | N/A | N/A | N/A | N/A | N/A | N/A |
| Buoy 44100 | 2024 | 55 | 57 | 80/ 5/ 7 | 1015.7 | ||
| Oregon Inlet, NC | 2024 | 54 | 57 | 60/ 10/ 13 | 1016.1 | ||
| Buoy 41025 | 2050 | 56 | 40/ 6/ 12 | 1016.0 | 3 | ||
| Cape Lookout, NC | N/A | N/A | N/A | N/A | N/A | N/A | N/A |
DAILY MARINE THREAT
| TODAY | TOMORROW | DAY 3 | DAY 4 | DAY 5 |
 |
 |
 |
 |
 |
 |
||||
MARINE WAVE/WIND FORECASTS
| Max Wave Height Day 1 | Max Wave Height Day 2 | Max Wave Height Day 3 | Max Wave Height 0-72 HR |
 |
 |
 |
 |
| Max Wind Gust Day 1 | Max Wind Gust Day 2 | Max Wind Gust Day 3 | Max Wind Gust 0-72 HR |
 |
 |
 |
 |
HOURLY WEATHER GRAPHS
| Tangier Island | Wolf Trap | Thimble Shoal | Mouth Of Chesapeake Bay | Jamestown / Scotland Ferry |
 |
|
|
|
|
| Lower James River (Hampton Roads) | Fenwick Island | Offshore Wallops Island | Offshore Cape Henry | Offshore Corolla | Currituck Sound |
|
|
|
|
|
|
|
|
| Complete Wind Gust Likelihood and Probabilities Page |
LIKELIHOOD OF WIND GUSTS
| 25 KT LIKELYHOOD | 34 KT LIKELYHOOD | 43 KT LIKELYHOOD | 48 KT LIKELYHOOD | FORECAST WIND GUST | HIGH END WIND GUST |
 |
 |
 |
 |
 |
 |
| RIP CURRENT FORECAST (MAY-SEPT) |
 |


 Coastal Flood
 Heat
Heat