Please help the NWS spread these messages on social media! Everyone is welcome to use the text and images provided below to help the NWS build a Weather-Ready Nation.
Facebook
Tsunami Warning Center scientists use a variety of tools to detect, measure, and forecast tsunamis. Learn more: weather.gov/jetstream/tsu_detect
X/Twitter
Tsunami Warning Center scientists use a variety of tools to detect, measure, and forecast tsunamis. Learn more: weather.gov/jetstream/tsu_detect

|
Facebook
Of all the many dangerous weather hazards, tornadoes are one of the most powerful and destructive. Although the details of their formation are still being researched, we do know the general steps. Watch this video for a quick science lesson. youtu.be/MMLRNW4UJOc
X/Twitter
Although the details of tornado formation are still being researched, we do know the general steps. Watch this video for a quick #science lesson. youtu.be/MMLRNW4UJOc
Facebook
You already know to take shelter as soon as you hear thunder or see lightning. But have you ever wondered why lightning and thunder happen in the first place? Watch this video for a quick science lesson. youtu.be/Zd-Lc1cZDtA
X/Twitter
You already know to take shelter as soon as you hear thunder or see lightning. But have you ever wondered why lightning and thunder happen in the first place? Watch this video for a quick #science lesson. youtu.be/Zd-Lc1cZDtA
Facebook
Chunks of ice that fall from the sky can cause serious damage to people, animals, and property. But what exactly causes hail to form? Watch this video for some hail science! youtu.be/w1g0TToHTIA
X/Twitter
Chunks of ice that fall from the sky can cause serious damage to people, animals, and property. But what exactly causes hail to form? Watch this video for some hail #science! youtu.be/w1g0TToHTIA
Facebook
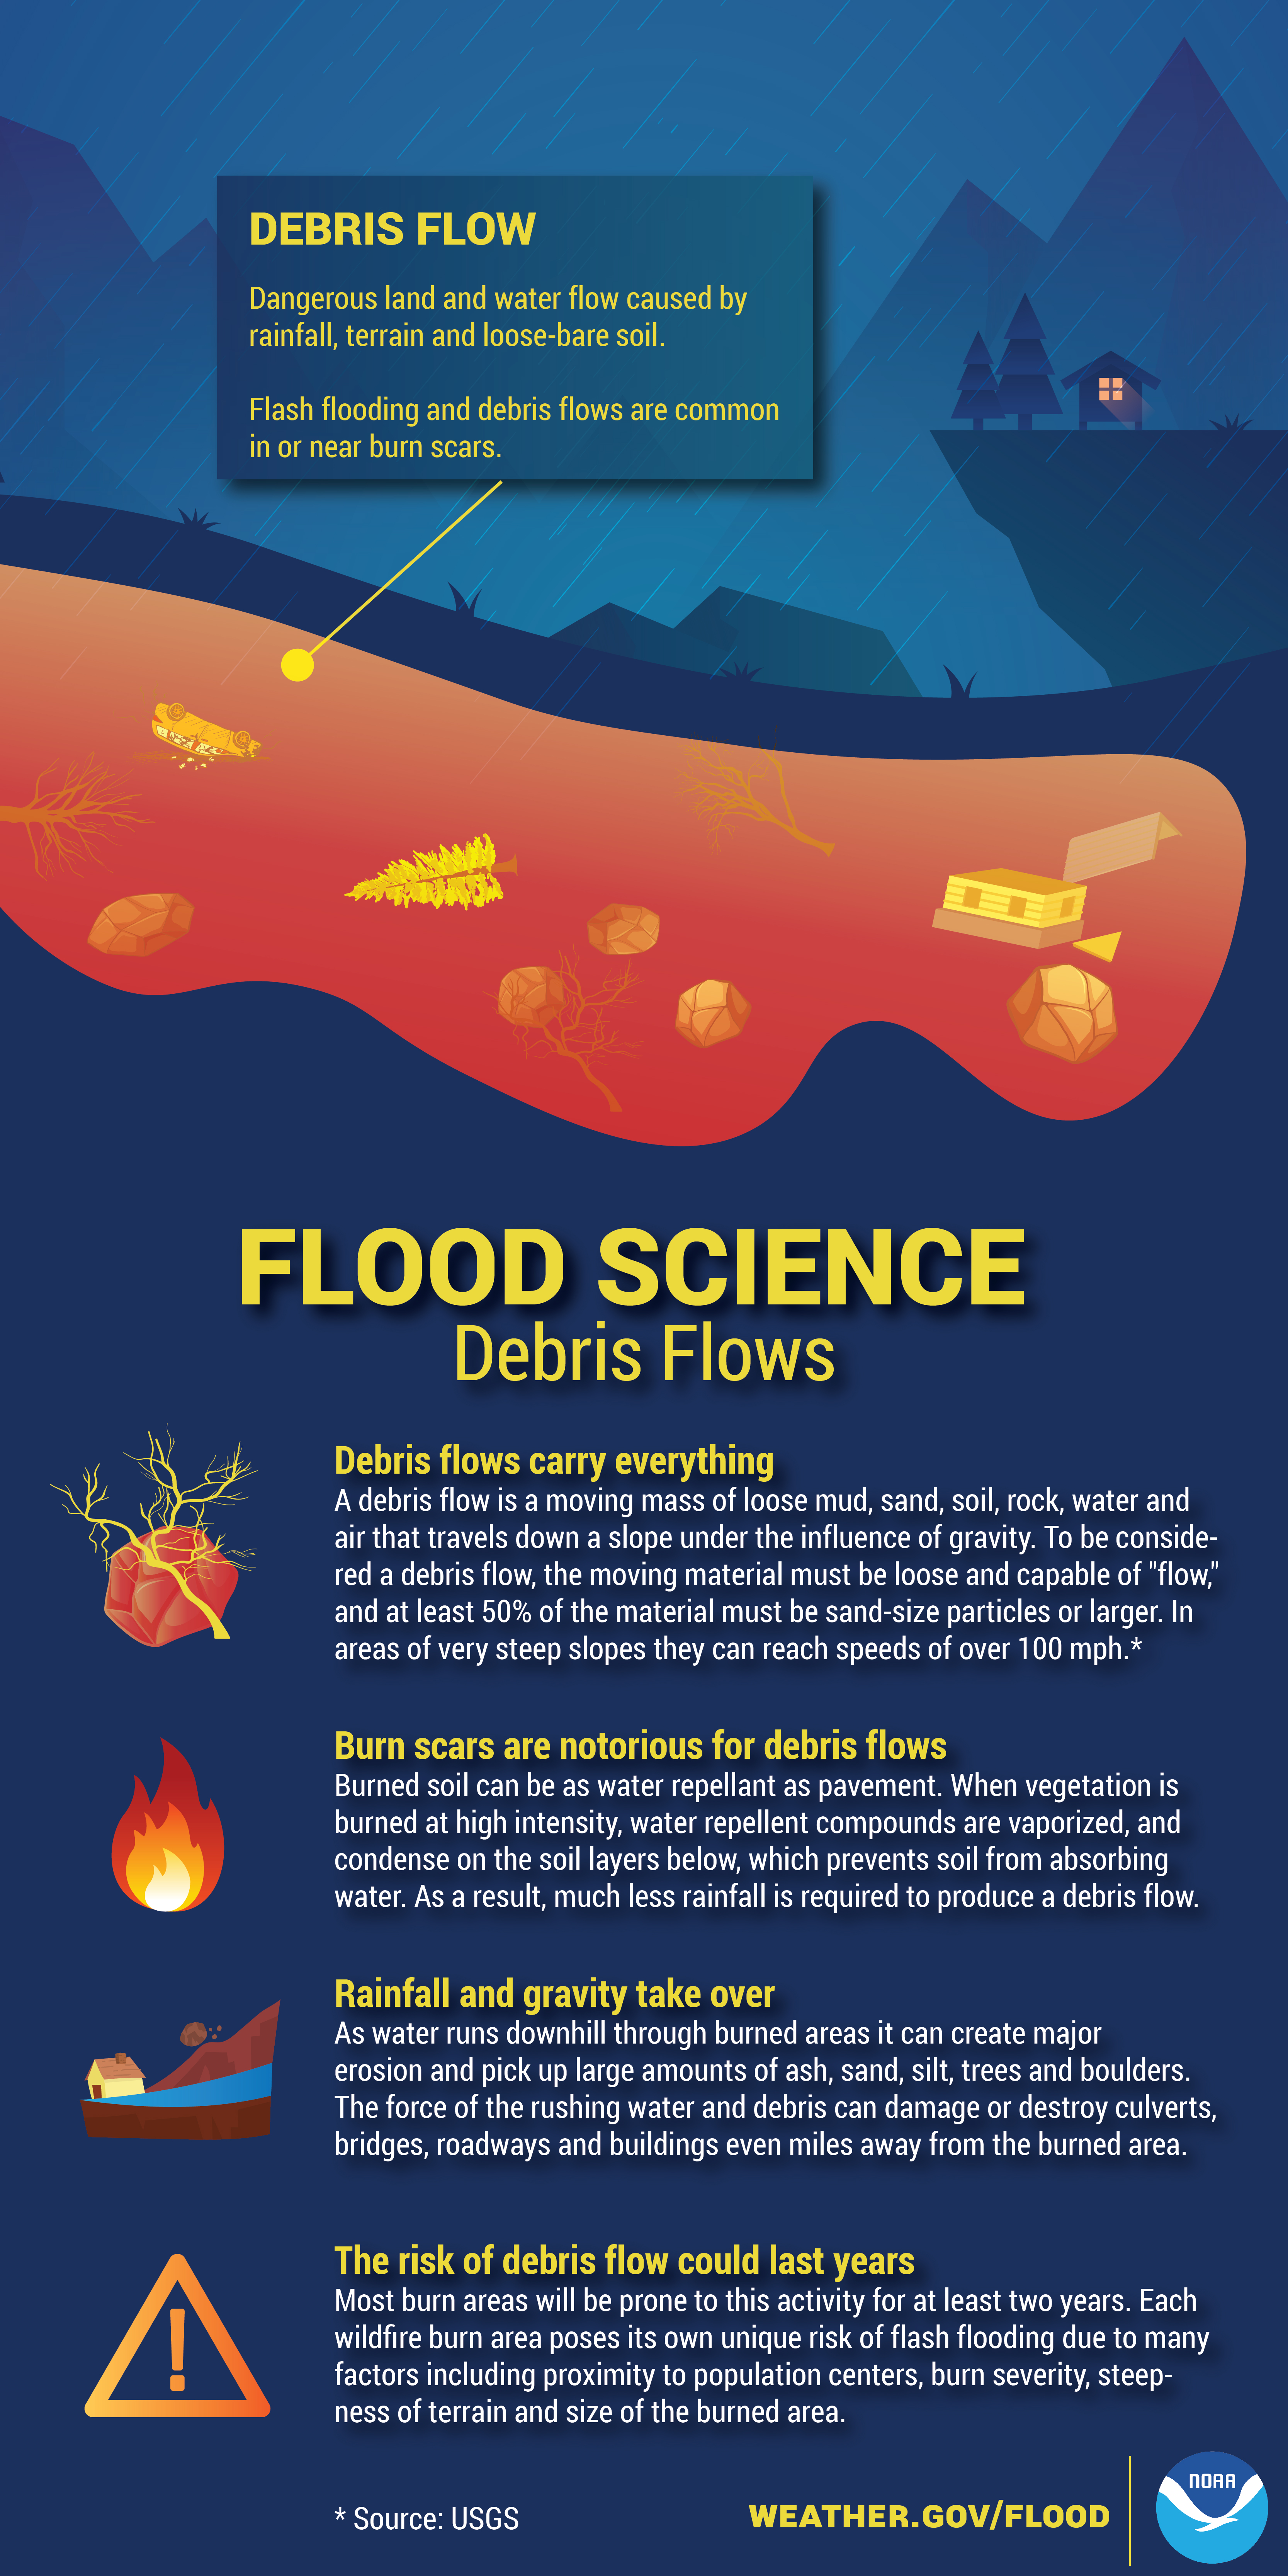
When normally dry soil becomes overly saturated, it can reach a point where it turns to a liquid state and flows downhill. Learn all about the science of debris flows in the infographic below, and visit noaa.gov/jetstream/thunderstorms/flood for more about floods.
X/Twitter
Learn all about the science of debris flows, and visit noaa.gov/jetstream/thunderstorms/flood for more about floods. #WeatherReady
|
Facebook
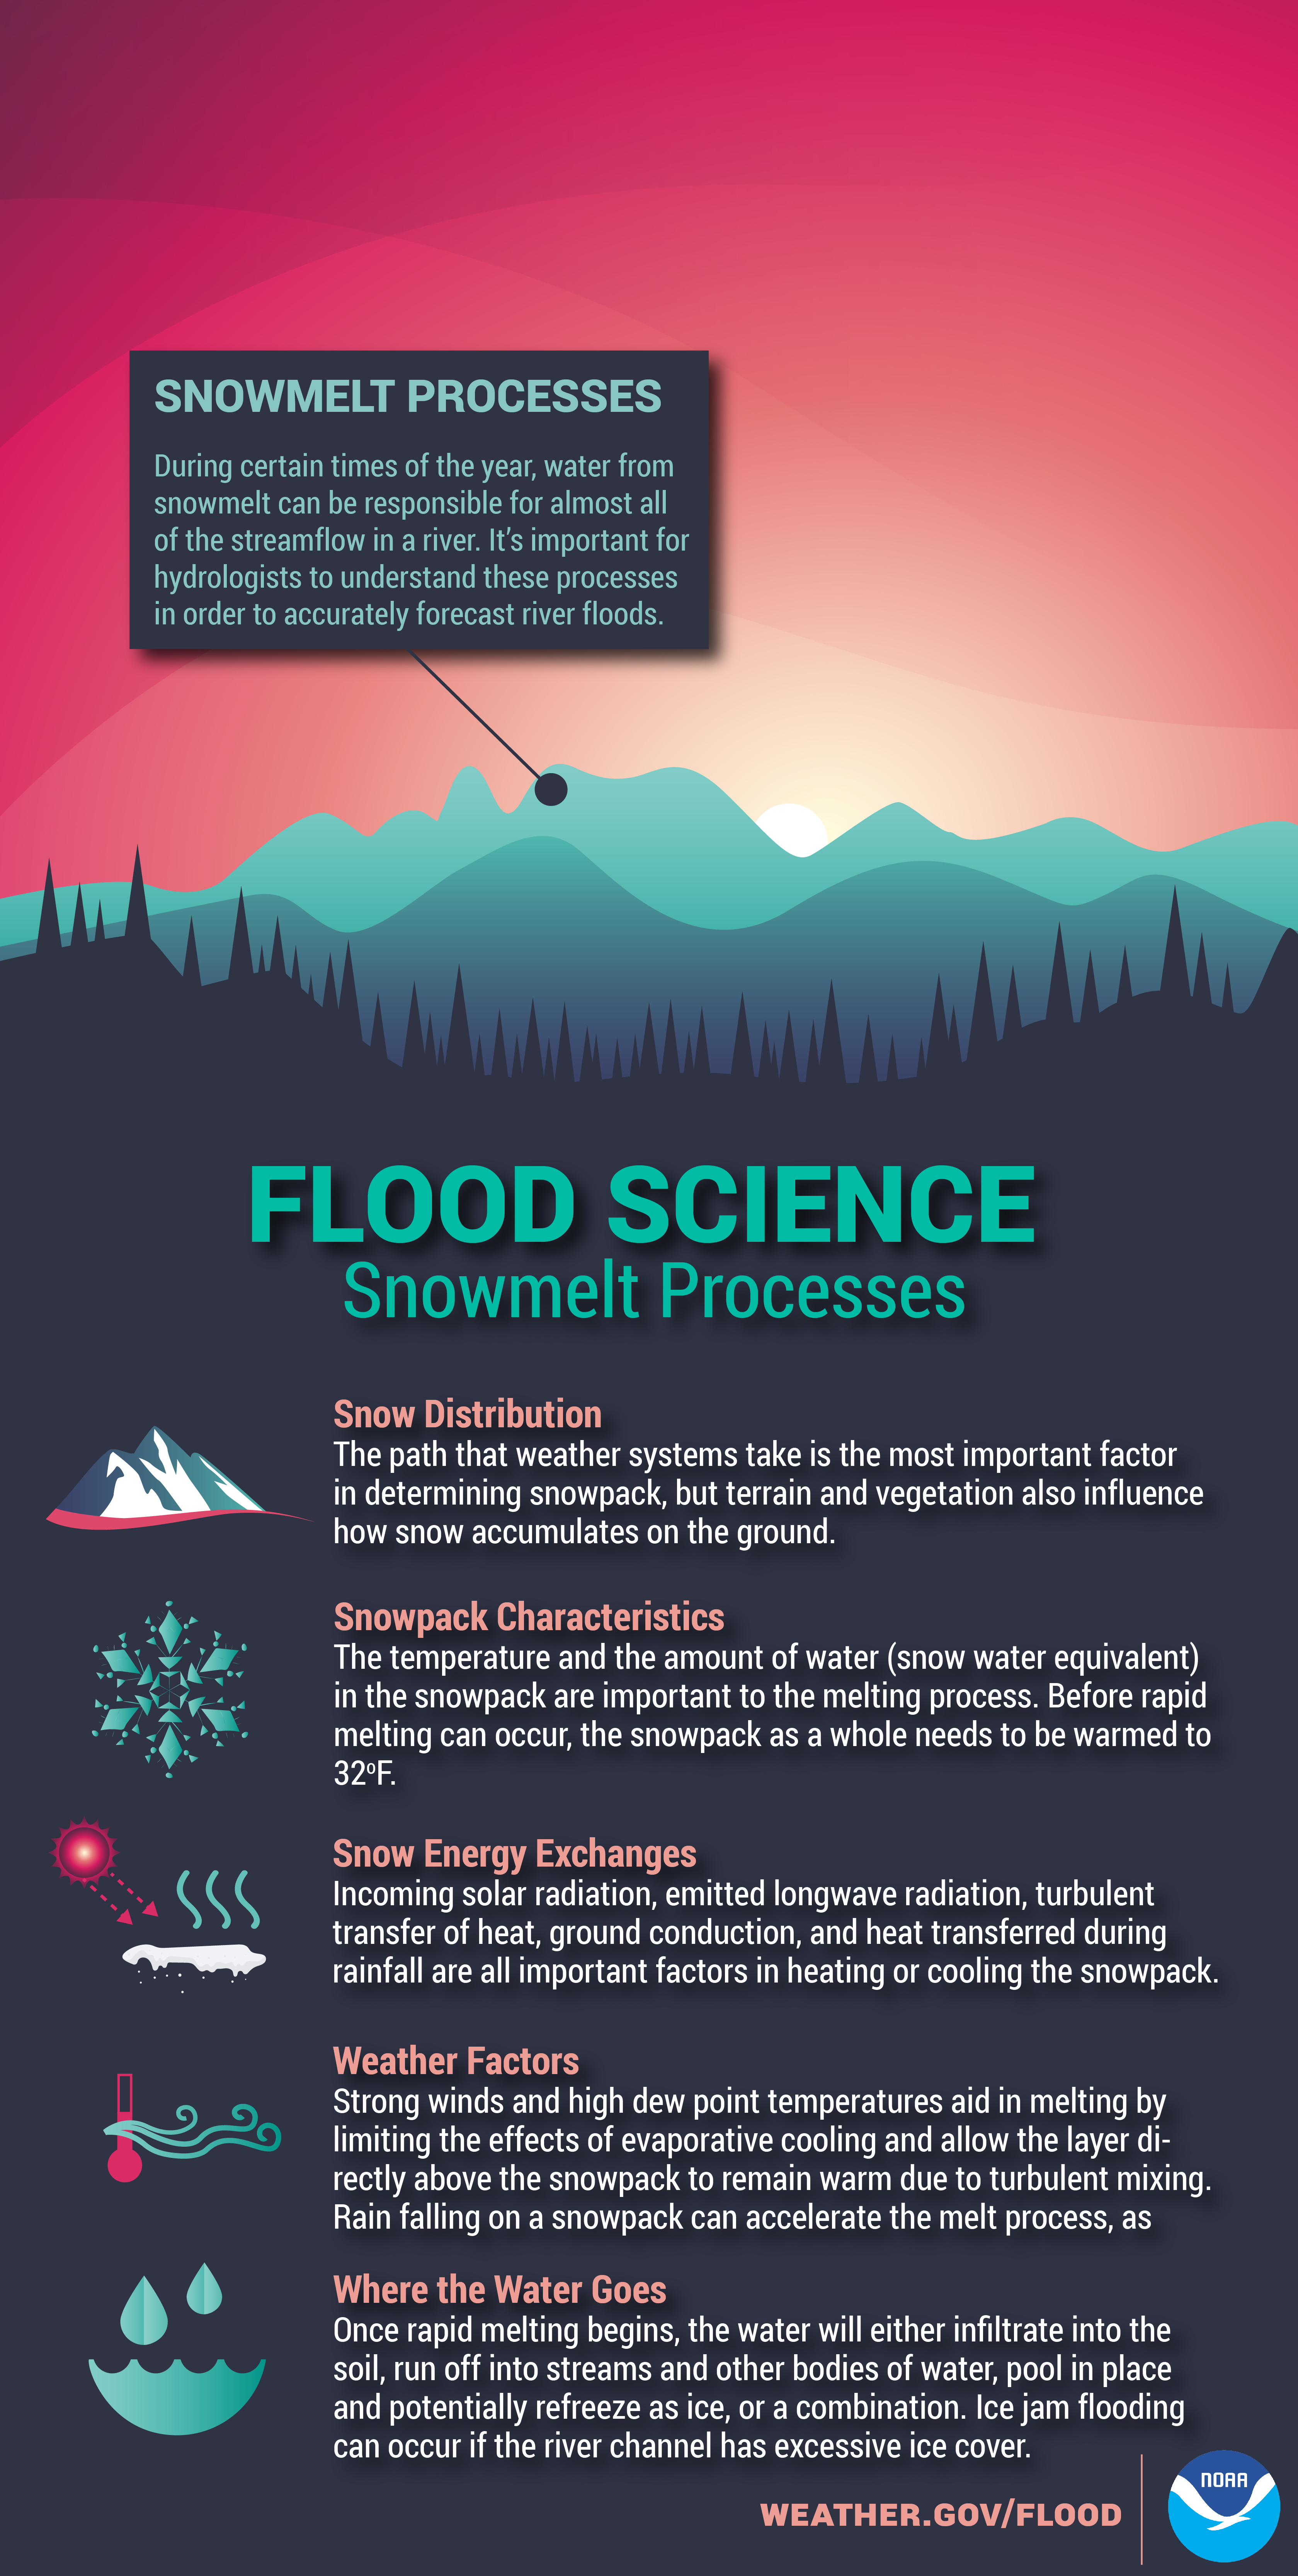
At certain times of the year, water from melting snow can be responsible for almost all of the streamflow in a river. The processes of snowmelt are crucial in forming accurate river flood forecasts. Learn more about floods at weather.gov/flood.
X/Twitter
At certain times of the year, water from melting snow can be responsible for almost all of the streamflow in a river. The processes of snowmelt are crucial in forming accurate river flood forecasts. Learn more about floods at weather.gov/flood.
|
Facebook
Even without rain or snowmelt, floods can happen along any rivers, creeks, and streams. This is because of something called streamflow routing, which occurs when water volume in a river moves from upstream to downstream. Learn more about floods at weather.gov/flood.
X/Twitter
Even without rain or snowmelt, floods can happen along any rivers, creeks, and streams. This is because of something called streamflow routing, which occurs when water volume in a river moves from upstream to downstream. Learn more about floods at weather.gov/flood.

|
Facebook
Haboob. Funny name, dangerous weather phenomenon. Learn about them and other examples of weird weather in this short video: youtu.be/vuk6gvq7Nwk #wxscience
X/Twitter
Haboob. Funny name, dangerous weather phenomenon. Learn about them and other examples of weird weather in this short video: youtu.be/vuk6gvq7Nwk #wxscience
Facebook
The term 500-year flood doesn’t necessarily mean that it’s only going to happen one time every 500 years. Rather, it’s a reference to the probability of occurrence. youtu.be/eQFyaXDH42U #FloodScience
X/Twitter
The term 500-year flood doesn’t necessarily mean that it’s only going to happen one time every 500 years. Rather, it’s a reference to the probability of occurrence. youtu.be/eQFyaXDH42U #FloodScience
Facebook
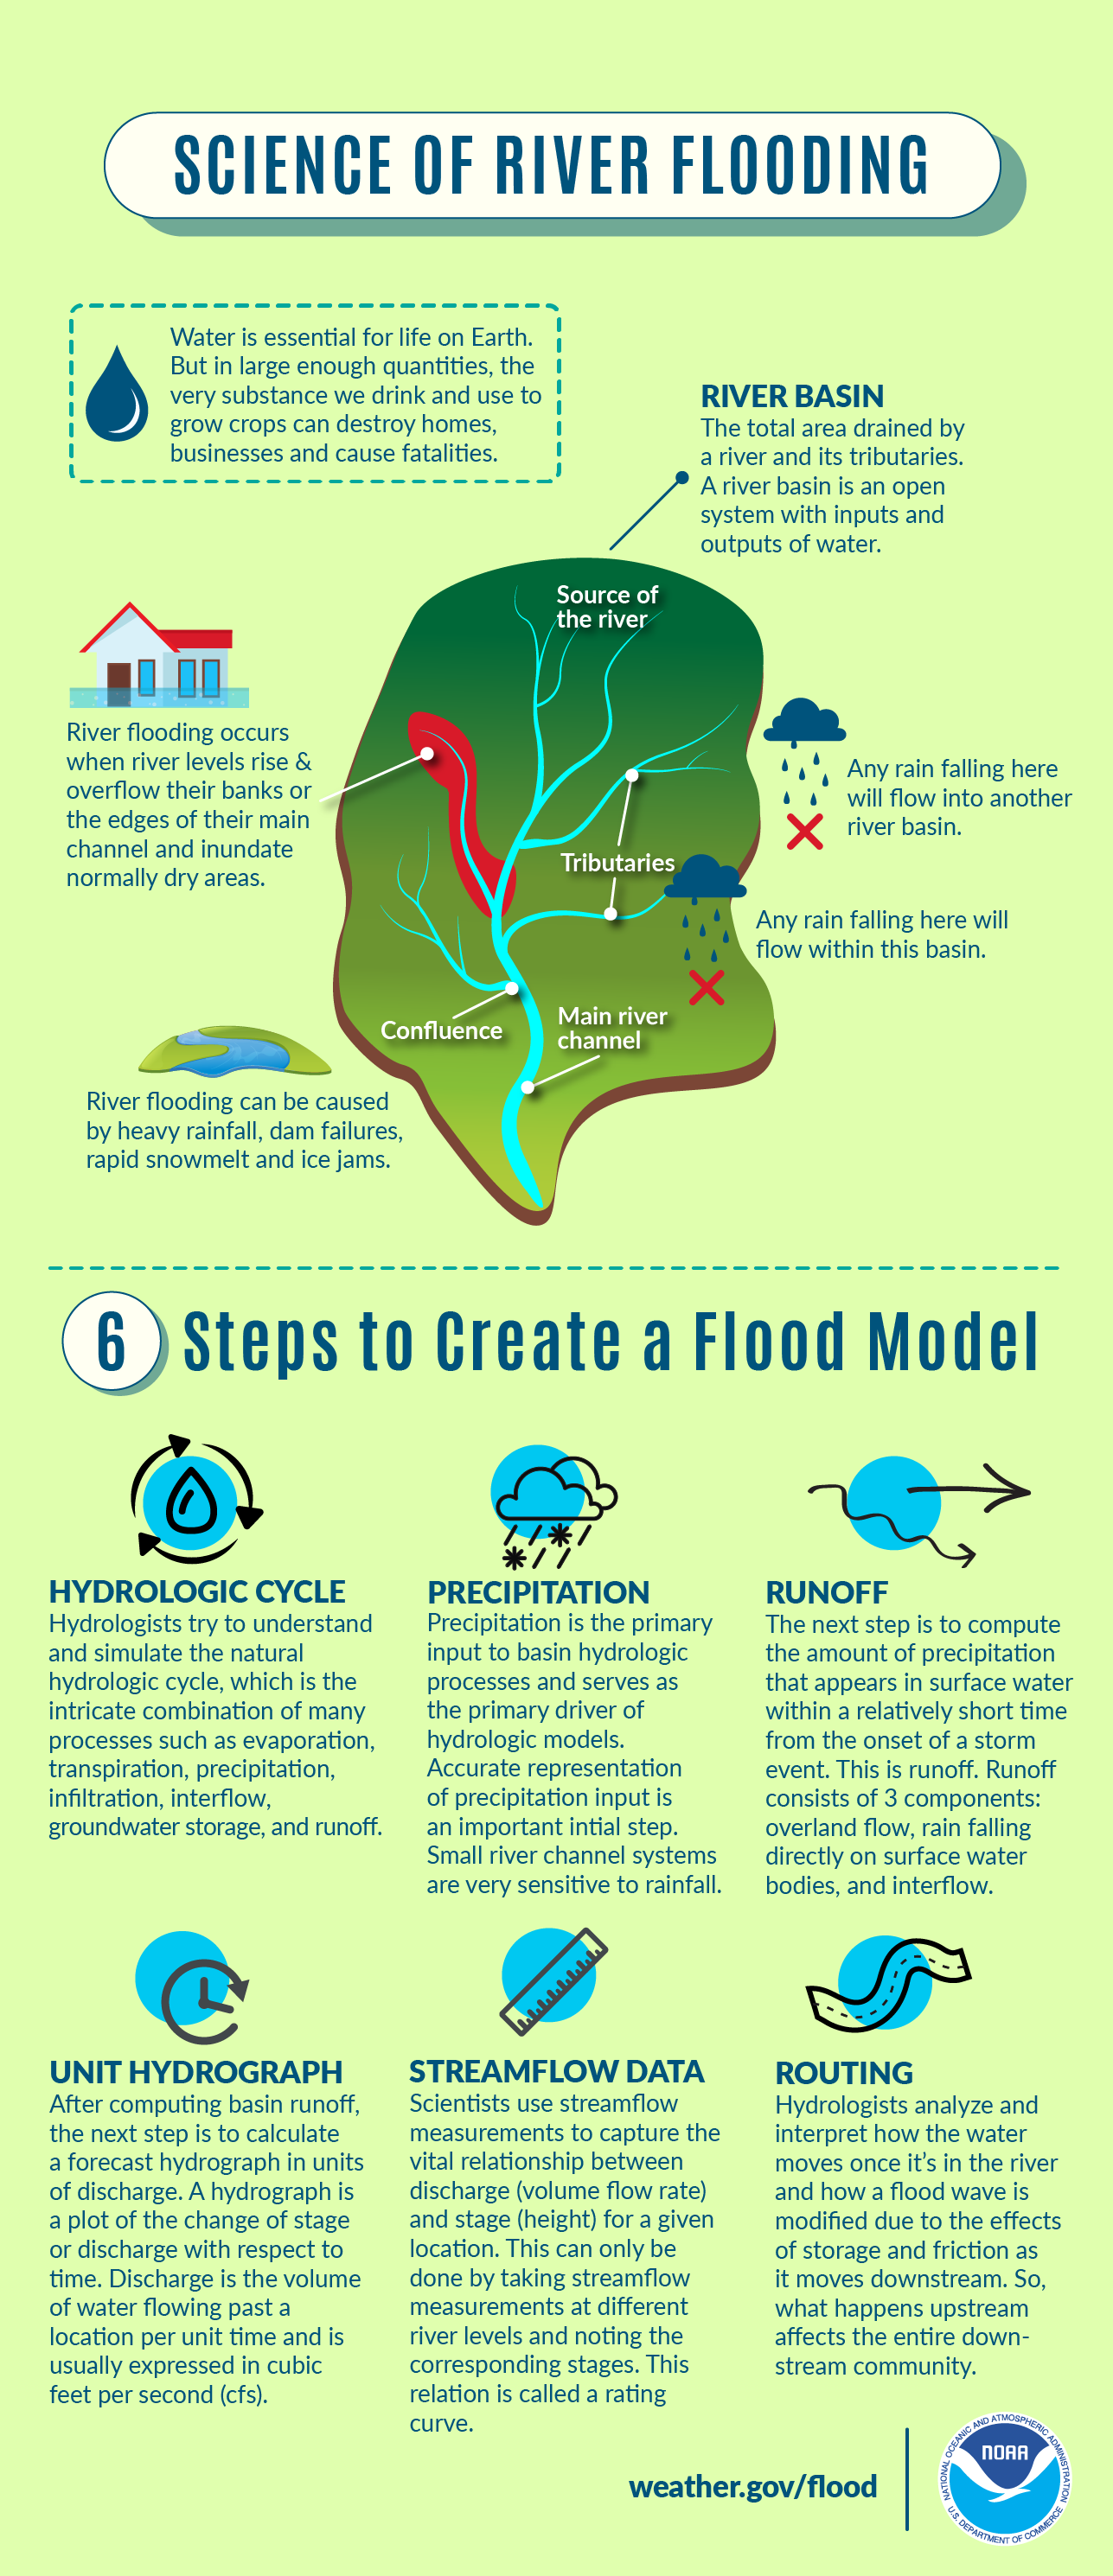
Water is essential for life on Earth--but in large enough quantities, the very substance we drink and use to grow crops can destroy homes, businesses, and cause fatalities. Learn all about the science of river flooding in the infographic below, and visit weather.gov/flood.
X/Twitter
Learn all about the science of river flooding with this graphic, and visit weather.gov/flood. #WeatherReady
|
Facebook
Did you know that weather satellite GOES-16 houses the very first operational lightning mapper flown in geostationary orbit? GLM measures total lightning (in-cloud, cloud-to-cloud and cloud-to-ground) activity continuously over the Americas and adjacent ocean regions with near-uniform spatial resolution of approximately 10 km.
When used in conjunction with radar data, GLM trends allow forecasters to make warning decisions earlier and more confidently.
goes-r.gov/spacesegment/glm.html
X/Twitter
Did you know that weather satellite GOES-16 houses the first operational lightning mapper flown in geostationary orbit? The data provided helps forecasters make potentially life-saving decisions. goes-r.gov/spacesegment/glm.html

|
Facebook
Rip currents are powerful, narrow channels of water in the surf zone that move quickly away from shore. Moving at speeds of up to eight feet per second (or 5 mph!), rip currents can move faster than an Olympic swimmer. oceantoday.noaa.gov/ripcurrentscience/welcome.html #RipCurrentScience
X/Twitter
Rip currents are powerful, narrow channels of water flowing away from shore at surf beaches and can reach speeds of 8 feet per second! oceantoday.noaa.gov/ripcurrentscience/welcome.html #RipCurrentScience

|
Facebook
Did you know there are different types of thunderstorms? Watch this video and learn what they are: youtu.be/NNrb0hI5JD4 #ThunderstormScience
X/Twitter
Did you know there are different types of thunderstorms? Watch this video and learn what they are: youtu.be/NNrb0hI5JD4 #ThunderstormScience
Facebook
Most folks think tornadoes only come from supercells, but did you know that there are multiple types of tornadoes? Learn all about them in the infographic below, and visit https://www.noaa.gov/jetstream/thunderstorms/thunderstorm-hazards-tornadoes for more.
X/Twitter
Did you know that there are multiple types of tornadoes? Visit https://www.noaa.gov/jetstream/thunderstorms/thunderstorm-hazards-tornadoes for more. #WeatherReady

|
Facebook
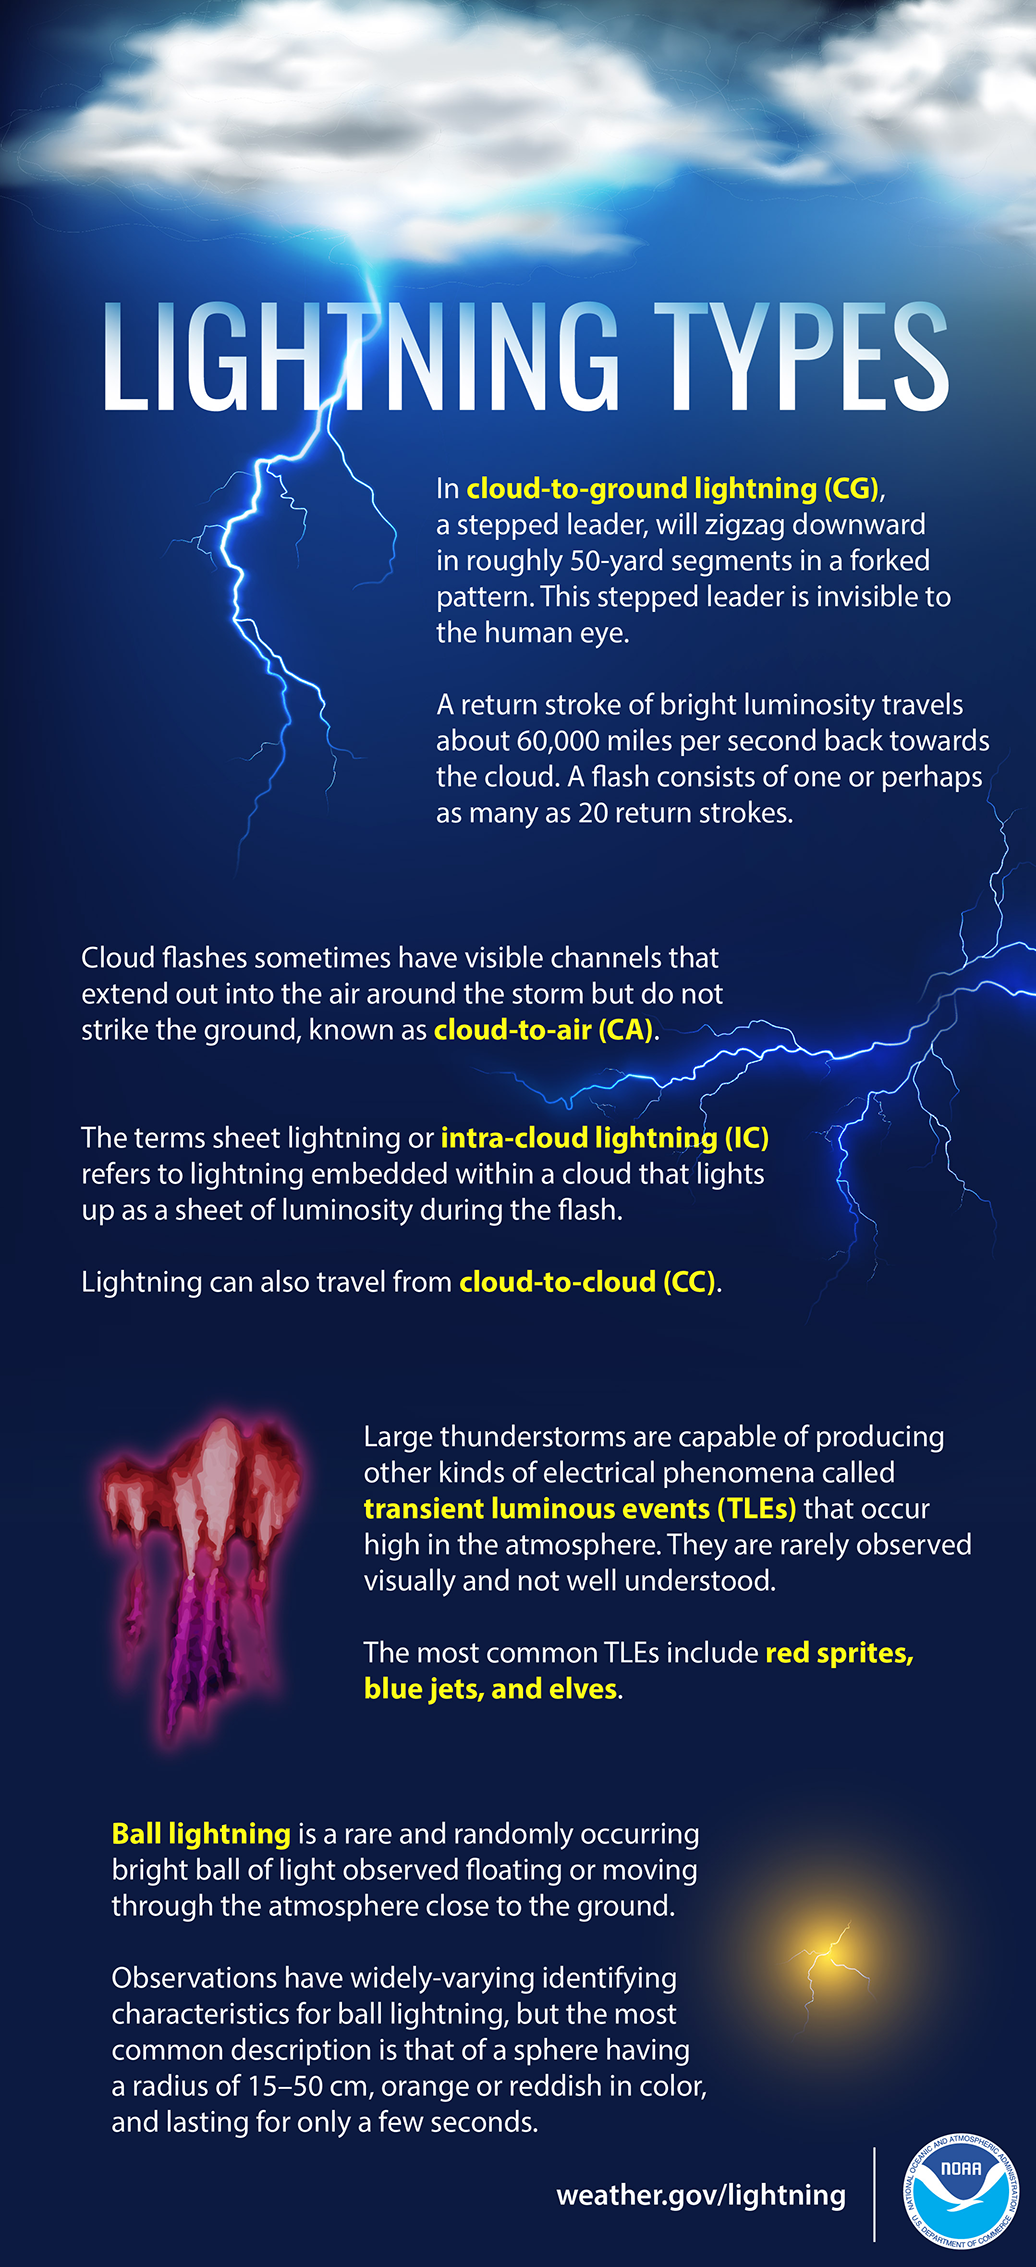
Did you know there are many different kinds of lightning? Learn all about them in the graphic below or by visiting nssl.noaa.gov/education/svrwx101/lightning/types/ #LightningScience
X/Twitter
Did you know there are many different kinds of lightning? Learn all about them in the graphic below or by visiting nssl.noaa.gov/education/svrwx101/lightning/types/ #LightningScience
|
Facebook
Do you know what to watch for when severe weather threatens? Check out NWS Skywarn. Help keep your community safe by volunteering to become a trained storm spotter for NOAA's National Weather Service. Potential volunteers should visit nws.noaa.gov/skywarn/ and contact their local NWS office. #CitizenScience
X/Twitter
Let’s learn about #NWSCitizenScience opportunities! Become a trained Skywarn storm spotter and help keep your community safe! nws.noaa.gov/skywarn/ #CitizenScience

|
Facebook
Ever wanted to take rain or snow measurements? Join CoCoRaHS or Community Collaborative Rain, Hail, and Snow Network. This volunteer network of observers measures precipitation from their backyards. Any age can volunteer. Data is used by NWS meteorologists to help with forecasts. www.cocorahs.org
X/Twitter
Ever wanted to take rain or snow measurements? Learn more about #NWSCitizenScience and join CoCoRaHS today! Cocorahs.org #CitizenScience

|
Facebook
Check out mPING (Meteorological Phenomena Identification Near the Ground) project. Weird name, cool app! You can report the type of precipitation you see where you are. No need to measure! Use the free mobile app to send reports anonymously. Reports are automatically recorded into a database, which improves weather computer models. The information is even used by road maintenance operations and the aviation industry to diagnose areas of icing. mping.nssl.noaa.gov #CitizenScience
X/Twitter
Check out mPING! Weird name, cool app for #CitizenScience! Report weather types via the mPing app and help improve weather model forecasts! mping.nssl.noaa.gov #NWSCitizenScience
|
Facebook
The NWS Cooperative Observer Program (COOP) is truly the nation's weather and climate observing network of, by, and for the people. With over 8,700 volunteer observers, this program has existed since 1890 and is one of the few programs that measures snowfall and its water equivalent. Help NWS Citizen Science and become a COOP! You can help support warnings and forecasts and build a climatological database! For more information, visit weather.gov/coop/Overview
X/Twitter
Join NWS COOP! The NWS Cooperative Observer Program (COOP) is truly the nation's weather and climate observing network of, by, and for the people. Help support warnings and forecasts and build a climatological database!
weather.gov/coop/Overview #NWSCitizenScience
|

