The National Weather Service offers tools to help you plan your day. Whether you're at your computer or on your mobile phone, you can take an hour–by–hour look at the weather for the upcoming week. Here is a step–by–step guide to accessing your hourly forecast.
Step One
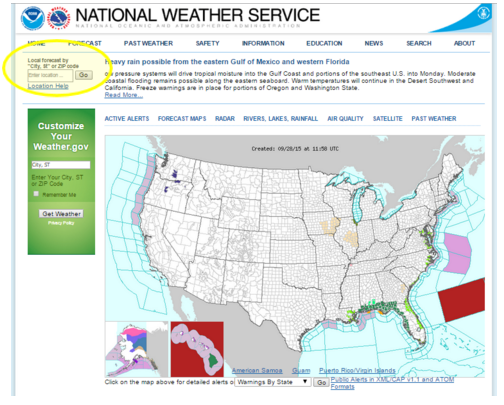
Visit weather.gov and type your ZIP code or city, state into the box highlighted below by the yellow circle. (You can also click on the map over your general location, and then click on your city/county on the second map that appears.)
Step Two
In the “Current Conditions” box at the top of the page, click on “Hourly Weather Graph” listed under the “More Information” heading.

Step Three
Get your hour-by-hour forecast! You can view the hourly forecast for the next seven days using the NWS Hourly Weather Graph.
What the Hourly Weather Graph Looks Like
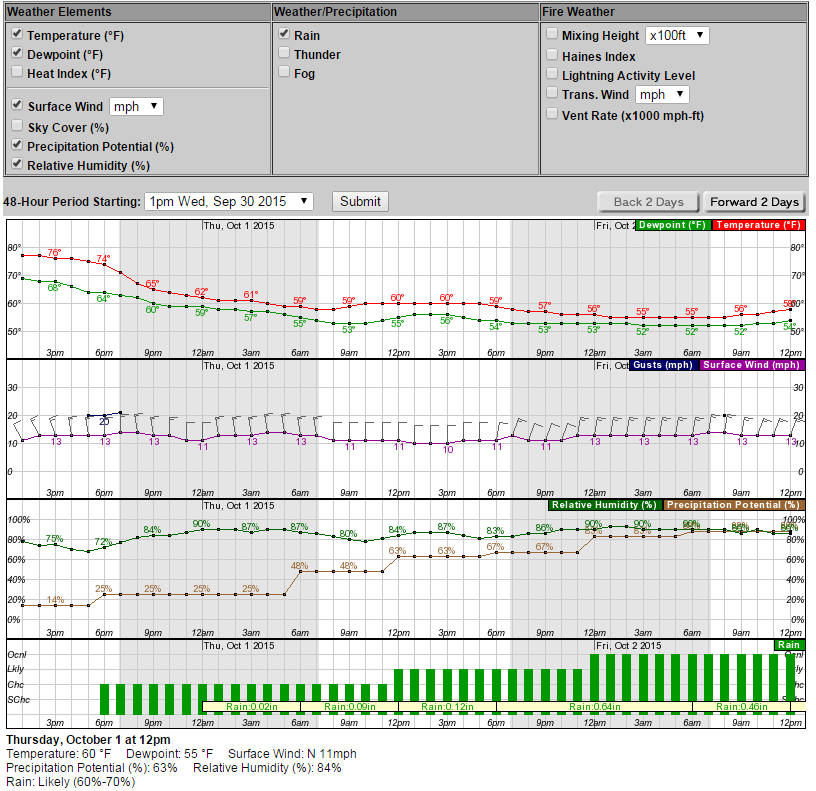
Step One: Select weather elements
Choose the weather elements and precipitation types that you’d like to view by clicking the check boxes at the top of the graph. Some elements will automatically be selected when you open the weather graph. You can uncheck the boxes next to any elements or precipitation types you don’t want to see.

Step Two: Select your time period
You can change the 48-hour period that you’d like to view by using the drop down menu. You can get the hourly forecast out to 7 days ahead.

Step Three: Read the graph
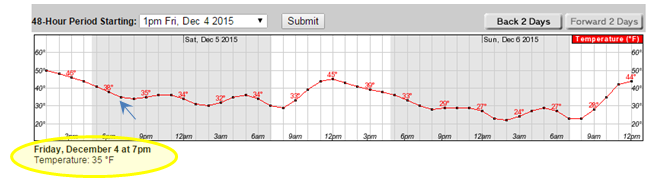
Using temperature as an example, here’s how you read the graph. Times are across the bottom, the date is across the top, and the temperature scale is along the left side. In this example, temperature is shown on the graph in red. The graph shows that on Friday December 4, 2015 at 7pm the temperature will be 35 degrees. By placing your curser over a location on the graph, you can read the forecast information for that time immediately below the graph.
If you have more than one element selected and would like to see the forecast for all elements at a specific time, simply mouse over the graph for that specific time and a text box will appear at the bottom of the page. The text will change as you move your mouse left or right on the graph over a new hour.


