Please help the NWS spread these messages on social media! Everyone is welcome to use the text and images provided below to help the NWS build a Weather-Ready Nation.
Facebook
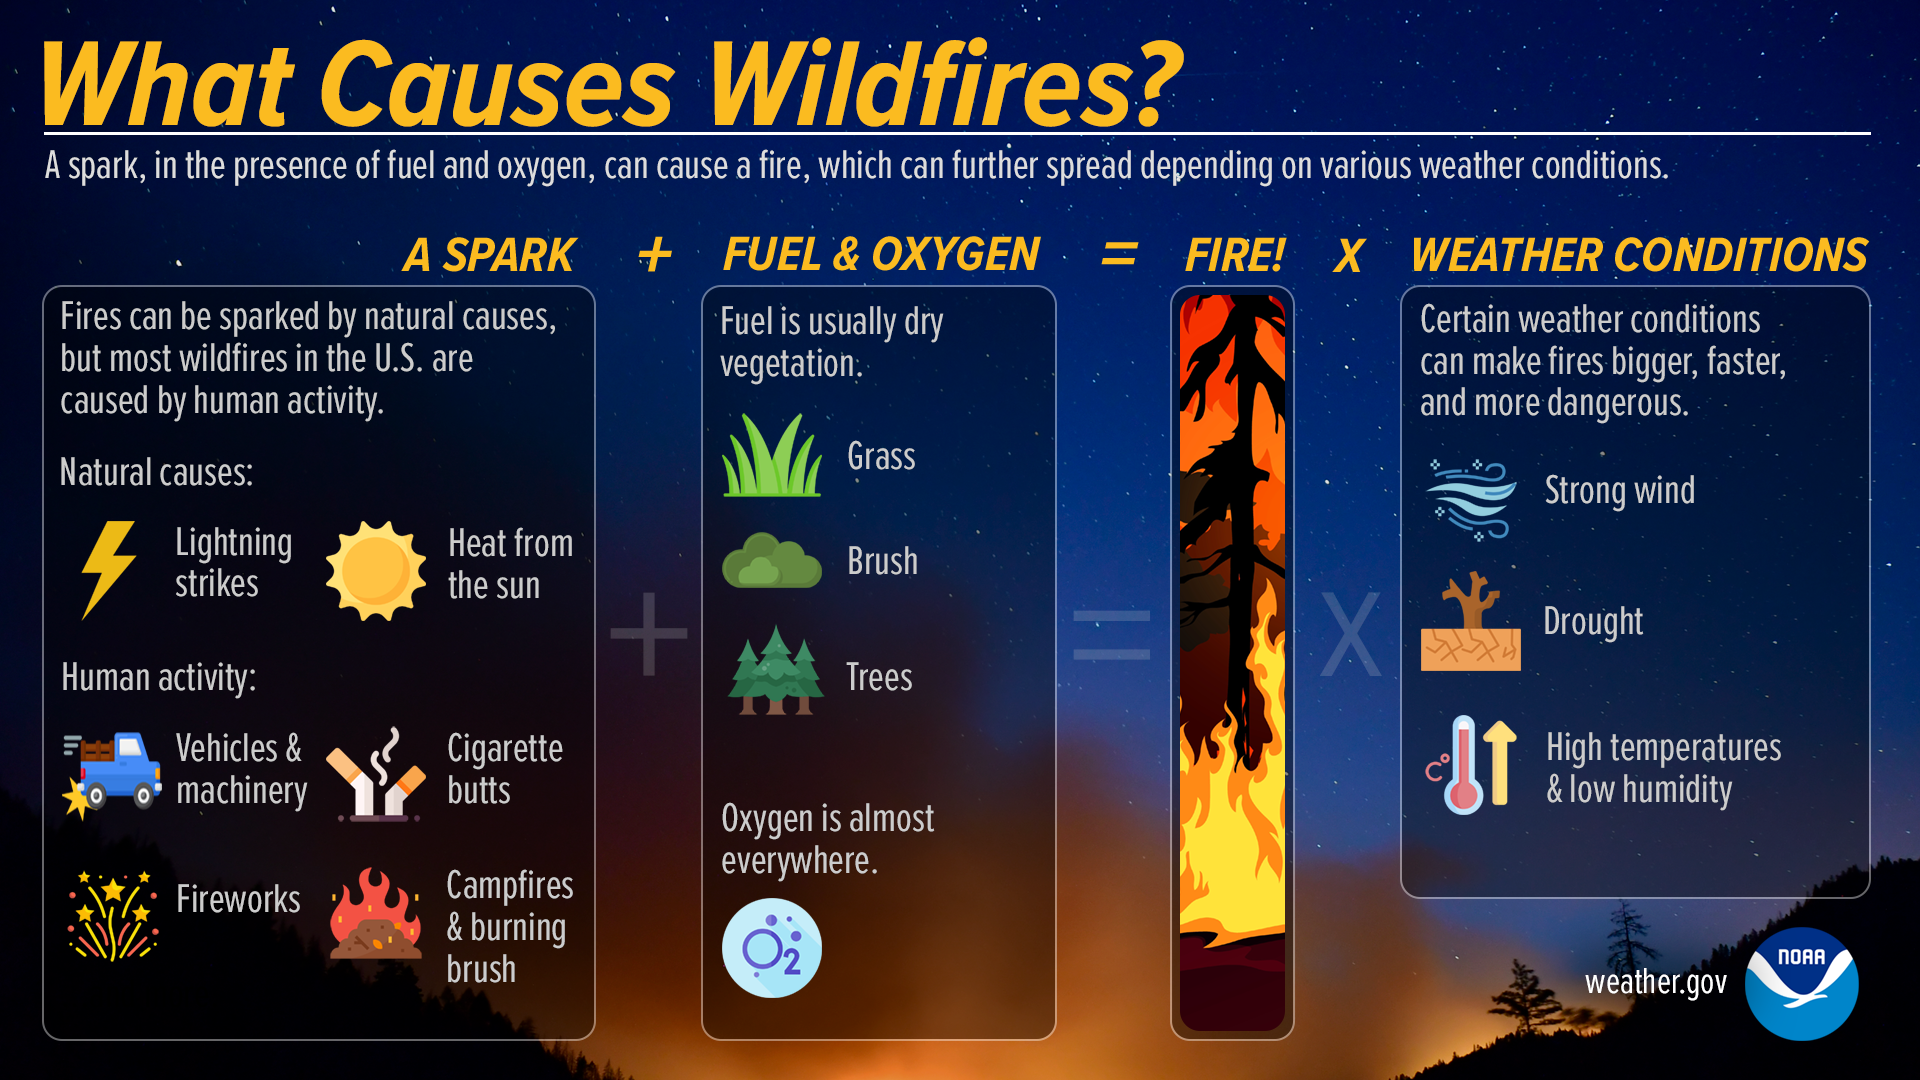
Wildfires are caused by a spark (usually man-made) in the presence of fuel (dry vegetation) and oxygen. Strong winds, high temperatures, low humidity and drought conditions can further impact the fire’s spread. To stay Weather-Ready and protect yourself from wildfires, visit weather.gov/safety/wildfire
Twitter
Wildfires are caused by a spark in the presence of fuel and oxygen. Strong winds, high temperatures, low humidity and drought conditions can further impact the fire’s spread. To stay #WeatherReady and protect yourself from wildfires, visit weather.gov/safety/wildfire
|
Facebook
Tsunami Warning Center scientists use a variety of tools to detect, measure, and forecast tsunamis. Learn more: weather.gov/jetstream/tsu_detect
Twitter
Tsunami Warning Center scientists use a variety of tools to detect, measure, and forecast tsunamis. Learn more: weather.gov/jetstream/tsu_detect

|
Facebook
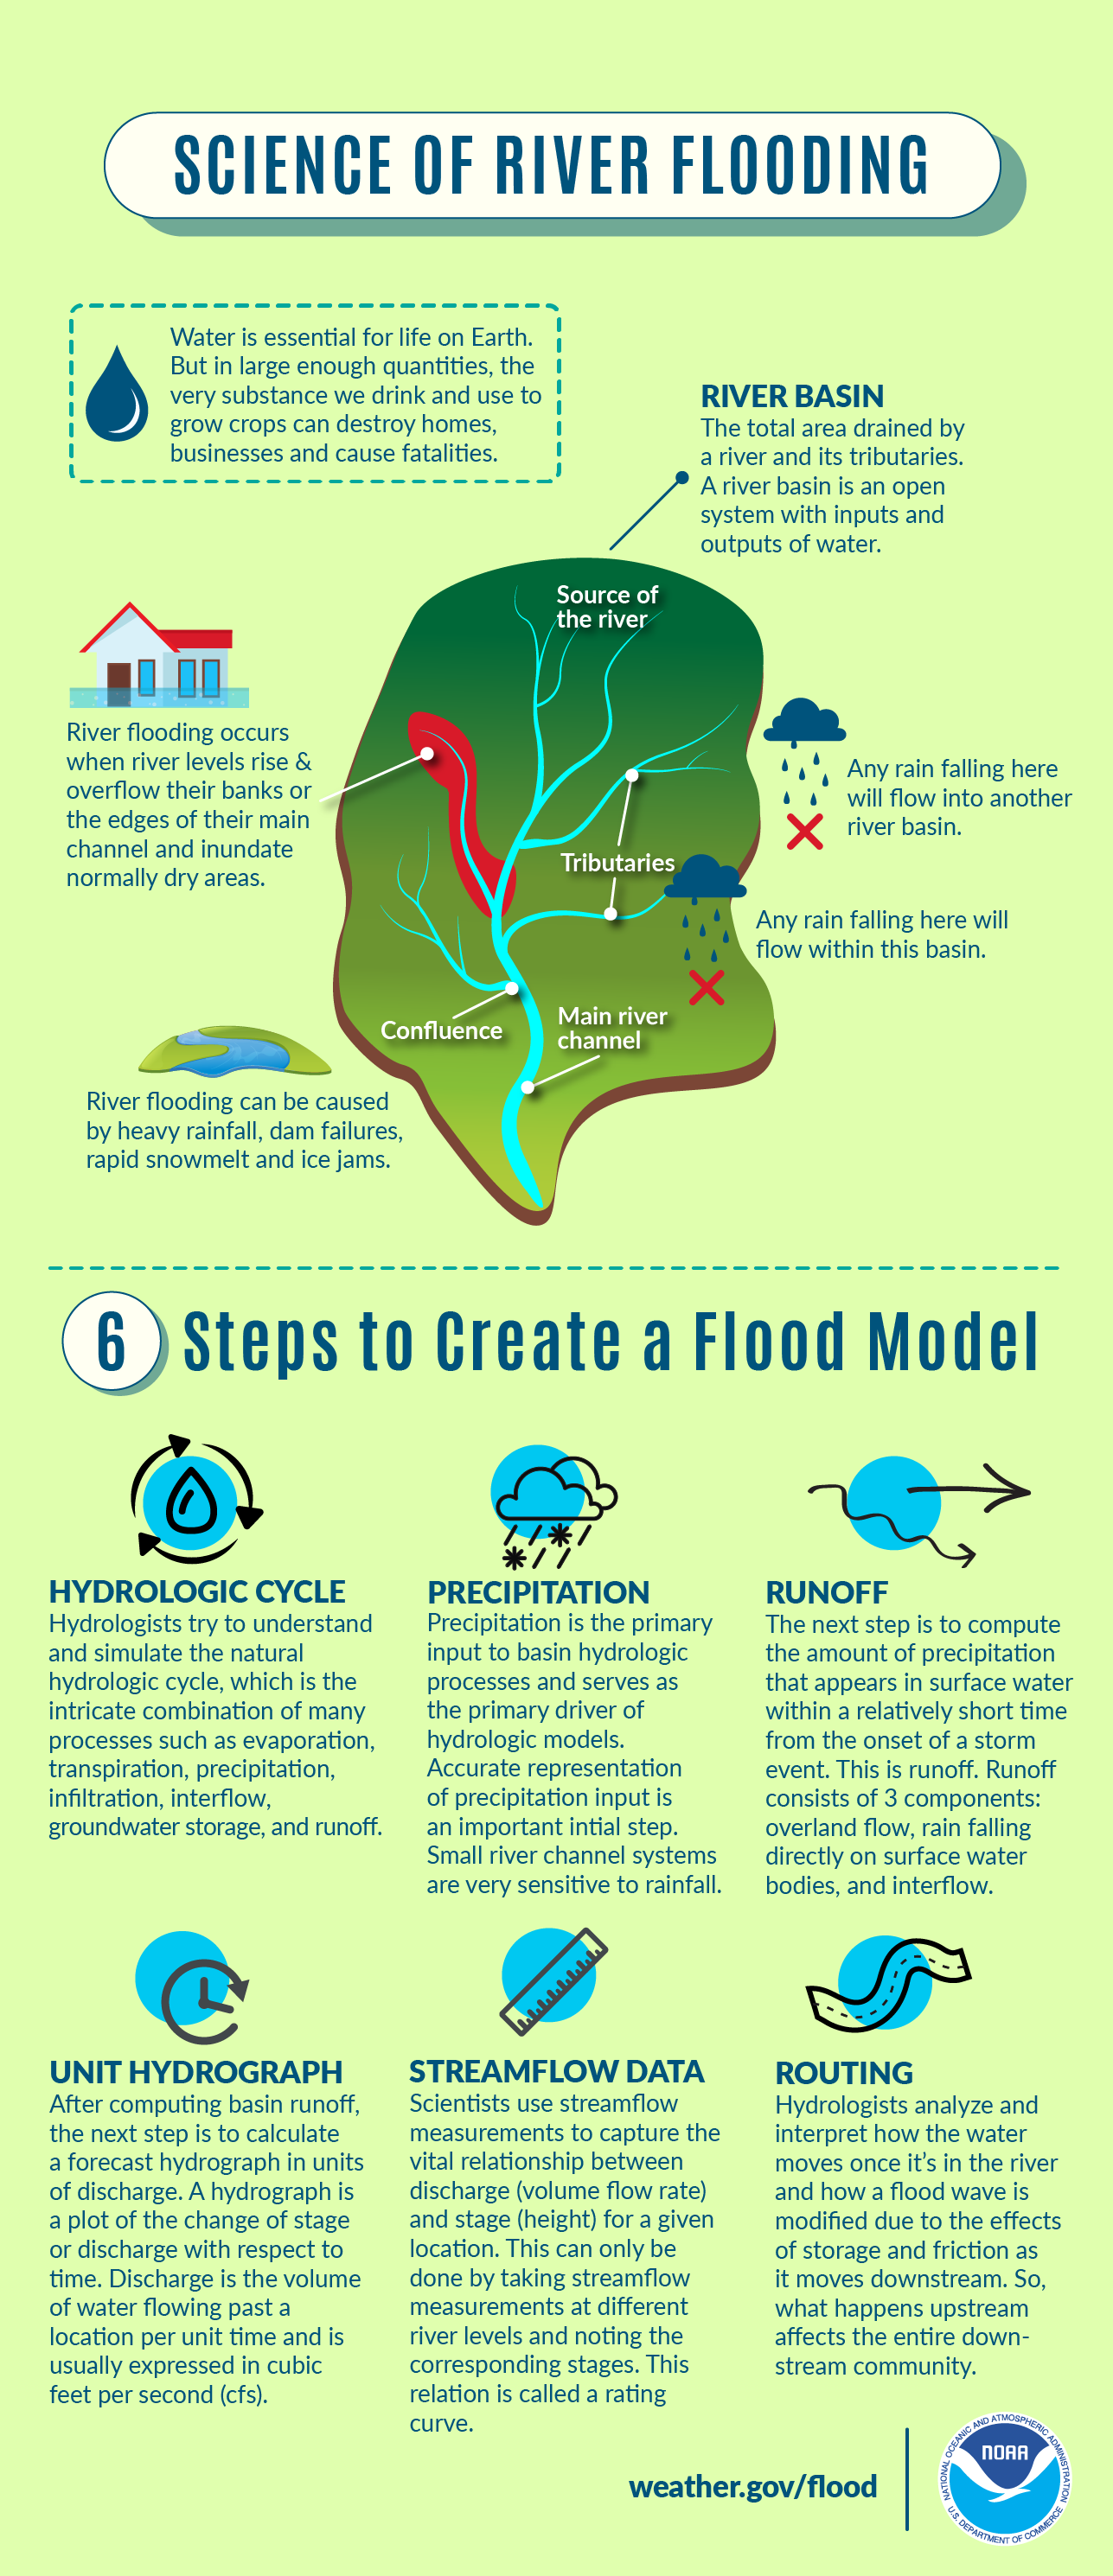
Water is essential for life on Earth. However, in large enough quantities, the very substance we drink and use to grow crops can destroy homes and businesses, and can also cause fatalities. Learn all about the science of river flooding in the infographic below, and visit weather.gov/jetstream/flood for more flood science.
Twitter
Learn all about the science of river flooding with this graphic, and visit weather.gov/jetstream/flood for more flood science. #WeatherReady
|
Facebook
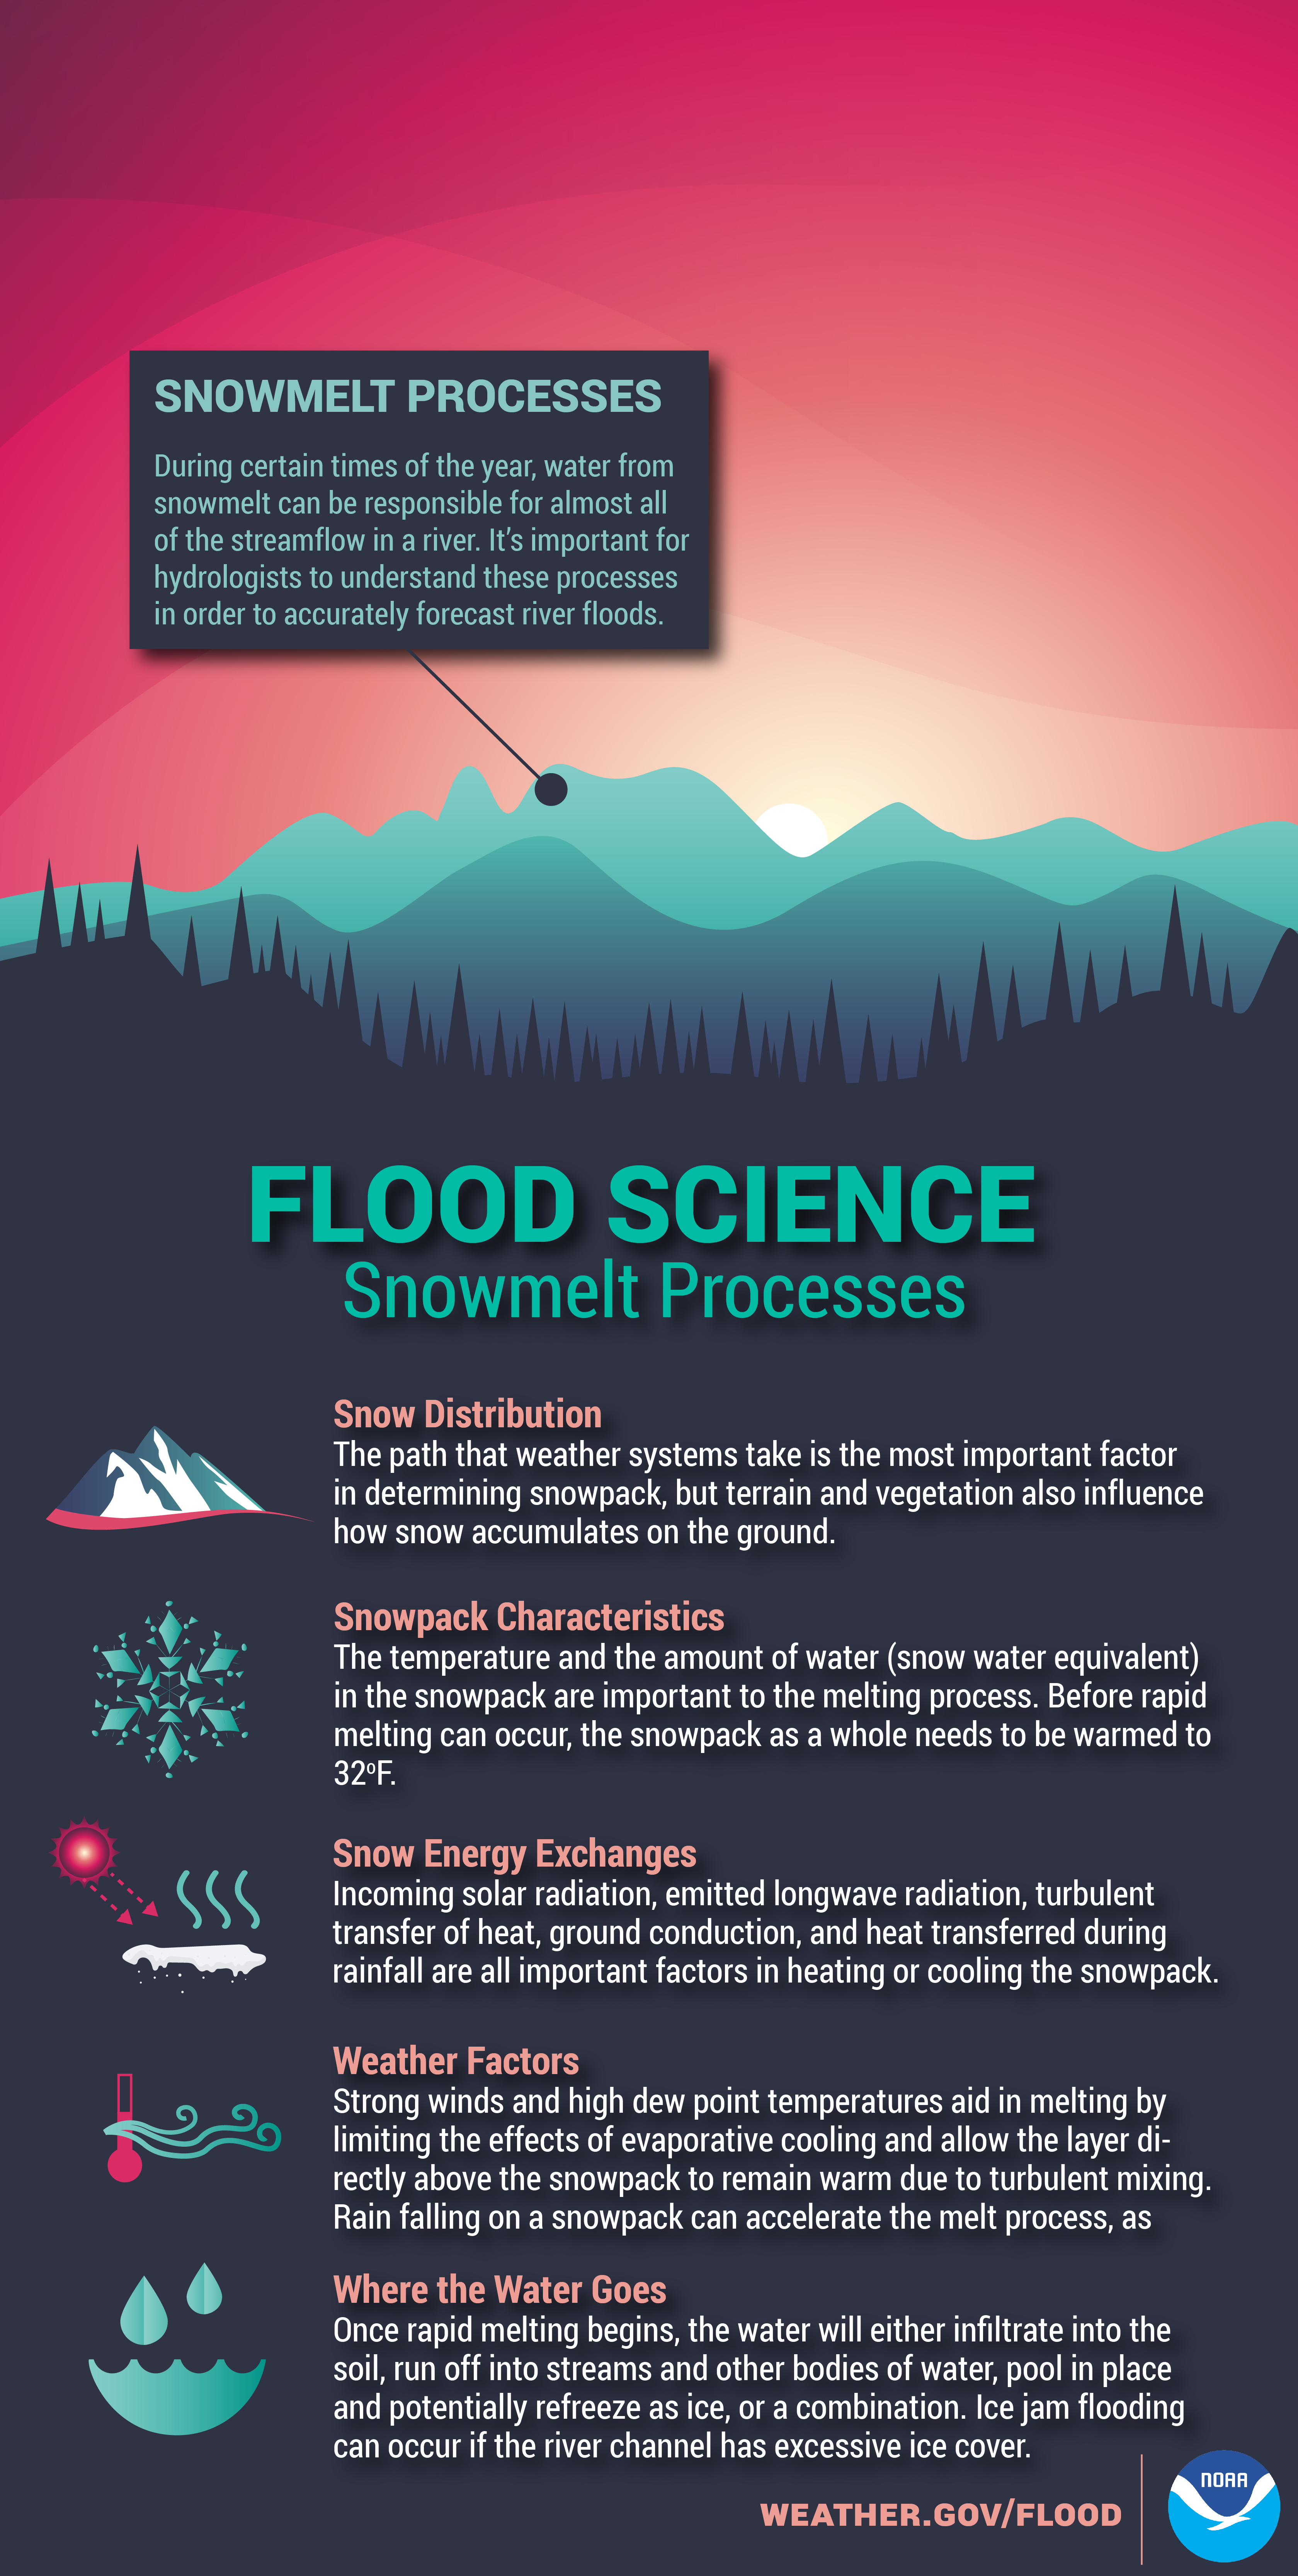
At certain times of the year, water from melting snow can be responsible for almost all of the streamflow in a river. The processes of snowmelt are crucial in forming accurate river flood forecasts. Learn more about flood science at weather.gov/jetstream/flood.
Twitter
At certain times of the year, water from melting snow can be responsible for almost all of the streamflow in a river. The processes of snowmelt are crucial in forming accurate river flood forecasts. Learn more about flood science at weather.gov/jetstream/flood.
|
Facebook
Even without rain or snowmelt, floods can happen along any rivers, creeks, and streams. This is because of something called streamflow routing, which occurs when water volume in a river moves from upstream to downstream. Learn more about flood science at weather.gov/jetstream/flood.
Twitter
Even without rain or snowmelt, floods can happen along any rivers, creeks, and streams. This is because of something called streamflow routing, which occurs when water volume in a river moves from upstream to downstream. Learn more about flood science at weather.gov/jetstream/flood.

|
Facebook
What’s a flash drought? Simply put, it is a rapid onset of drought that usually includes high temperatures and winds. Stay Weather-Ready during drought by conserving water and practicing fire prevention. drought.gov/what-is-drought/flash-drought
Twitter
Warm temperatures can quickly rise to dangerous levels — especially in the summer and in parked cars. Stay #WeatherReady and don’t underestimate the heat. drought.gov/what-is-drought/flash-drought

|
Facebook
Haboob. Funny name, dangerous weather phenomenon. Learn about them and other examples of weird weather in this short video: youtu.be/vuk6gvq7Nwk #wxscience
Twitter
Haboob. Funny name, dangerous weather phenomenon. Learn about them and other examples of weird weather in this short video: youtu.be/vuk6gvq7Nwk #wxscience
Facebook
The term 500-year flood doesn’t necessarily mean that it’s only going to happen one time every 500 years. Rather, it’s a reference to the probability of occurrence. youtu.be/eQFyaXDH42U #FloodScience
Twitter
The term 500-year flood doesn’t necessarily mean that it’s only going to happen one time every 500 years. Rather, it’s a reference to the probability of occurrence. youtu.be/eQFyaXDH42U #FloodScience
Facebook
Water is essential for life on Earth. But in large enough quantities, the very substance we drink and use to grow crops can destroy homes, businesses, and cause fatalities. Learn all about the science of river flooding in the infographic below, and visit weather.gov/safety/flood for flood safety tips. #FloodScience
Twitter
Learn all about the science of river flooding with this graphic, and visit weather.gov/safety/flood for flood safety tips. #FloodScience
|
Facebook
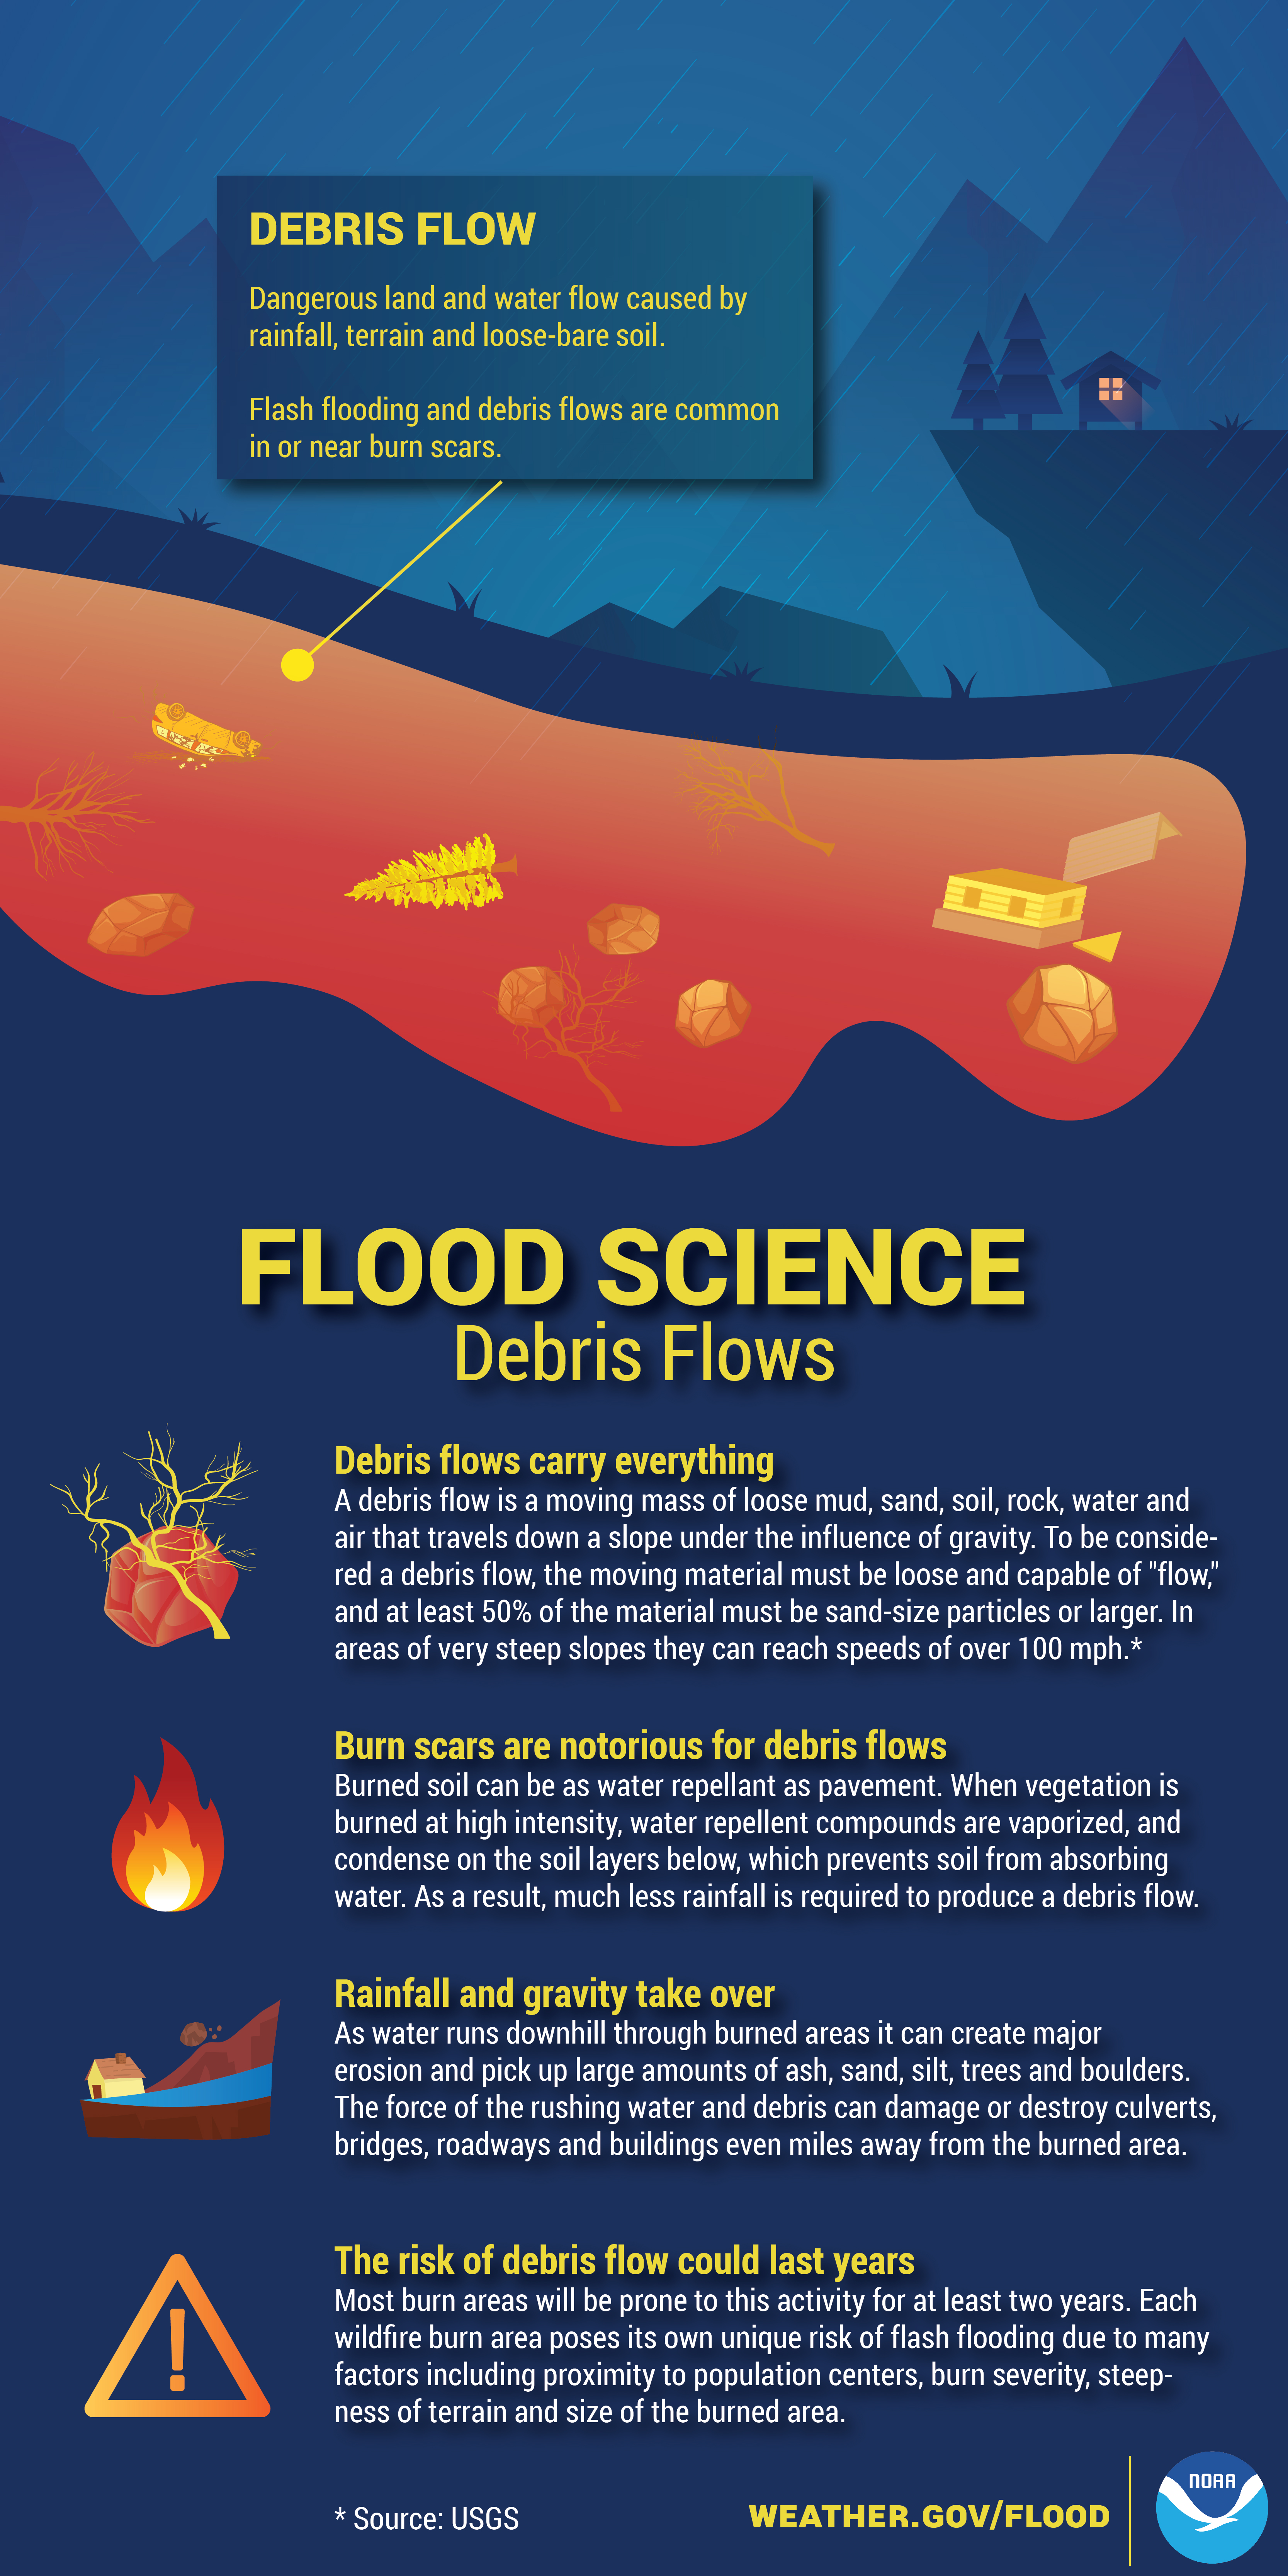
There are a lot of factors that determine the speed of wildfires. Check out the infographic below to learn a little wildfire science, and visit weather.gov/safety/wildfire for the latest safety tips.
Twitter
There are a lot of factors that determine the speed of wildfires. Check out the infographic below to learn a little #WildfireScience, and visit weather.gov/safety/wildfire for the latest safety tips. #WeatherReady

|
Facebook
Lake Effect snow occurs when cold air moves across warmer water. Warmth and moisture rise into the air, condensing into clouds that can produce 2 to 3 inches of snow per hour or more. Learn more weather science at weather.gov/jetstream
Twitter
Lake Effect snow occurs when cold air moves across warmer water. Warmth and moisture rise into the air, condensing into clouds that can produce 2 to 3 inches of snow per hour or more. Learn more weather science at weather.gov/jetstream

|
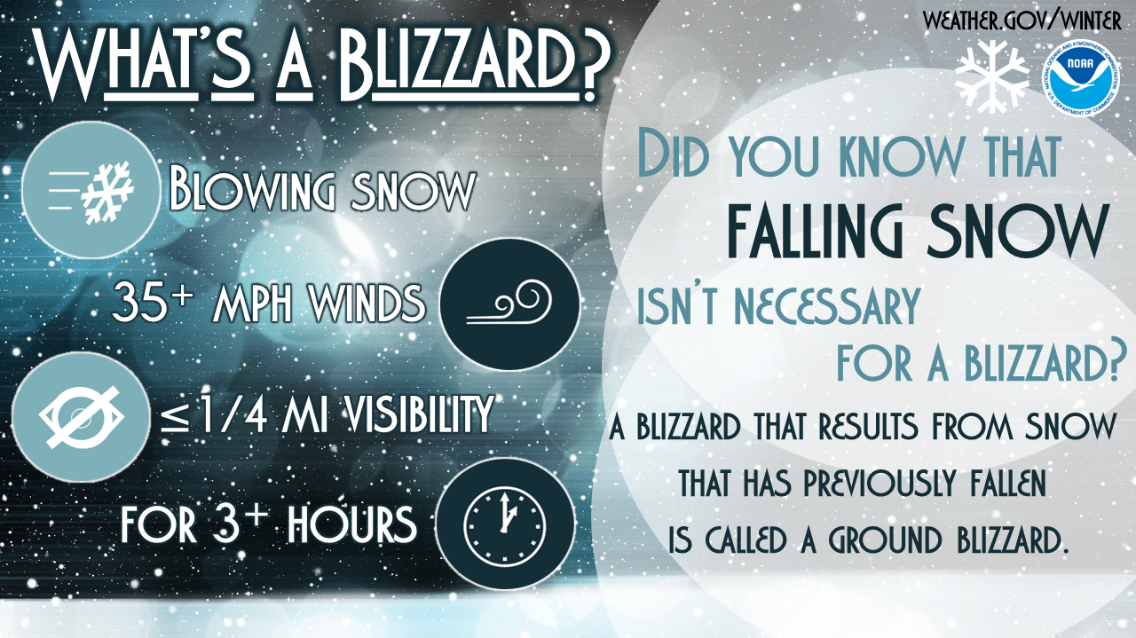
Facebook
Did you know not all blizzards involve falling snow? By definition, a blizzard includes 35+ mph winds that cause blowing snow, reducing visibility to 1/4 mile or less for at least 3 hours. If the visibility reduction comes from snow that has already fallen, it is called a ground blizzard. Whether or not the snow falls during the time of the blizzard, dangerous conditions can result. Make sure you’re prepared! weather.gov/winter
Twitter
Did you know that not all blizzards involve falling snow? Whether or not the snow falls during the blizzard, dangerous conditions can result. weather.gov/winter Be #WeatherReady!
|
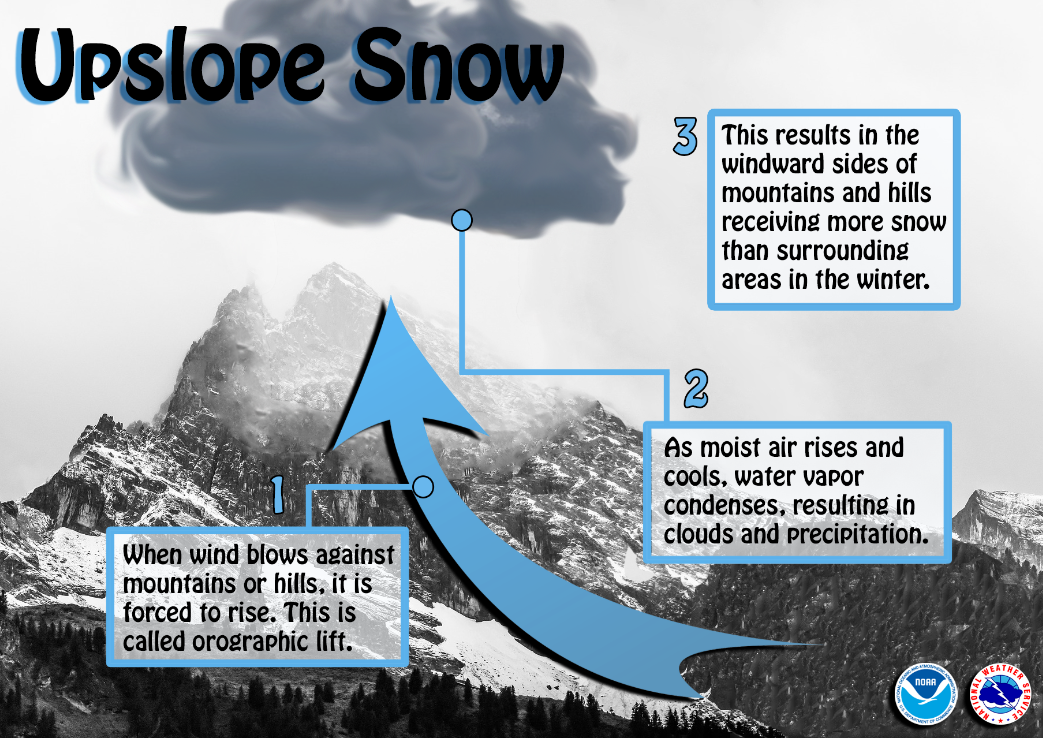
Facebook
Have you wondered why the windward side of mountains or large hills receives so much more snow than surrounding areas? This is due to upslope snow. When moist wind blows against the side of mountains/hills, the air is forced to rise (called orographic lift). As the air rises and cools, water vapor condenses, resulting in clouds and precipitation over the windward region. Conversely, the leeward side often receives less snow due to descending air.
Twitter
Why does the windward side of mountains or large hills receive so much more snow than surrounding areas? It’s because of the upslope effect. When you’re in one of these windward areas, make sure you’re #WeatherReady
|
Facebook
During winter months, falling snow serves as an important source of fresh water across the world. When spring arrives, melting snow helps replenish rivers, lakes, and reservoirs. The melting snow adds much-needed moisture to the soil and helps refill underground aquifers, which are vital for growing crops and for drinking water. weather.gov/jetstream/hydro
Twitter
During winter months, falling snow serves as an important source of fresh water. weather.gov/jetstream/hydro

|
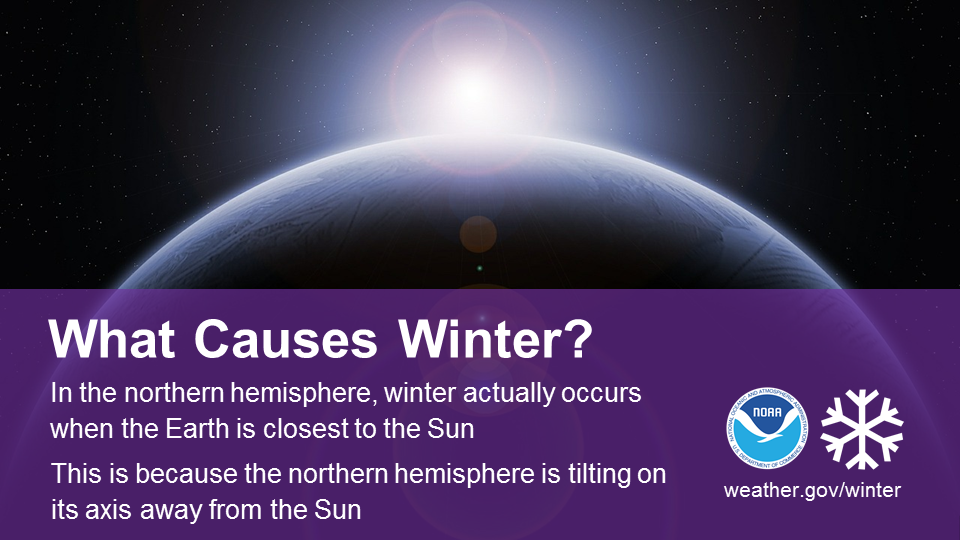
Facebook
Did you know that in the northern hemisphere, winter actually occurs when the Earth is closest to the Sun? This is possible because of the way the Earth tilts on its axis. During winter, the northern hemisphere is tilting away from the Sun, causing the Sun’s rays to hit the northern hemisphere at a lower angle, which results in far lower temperatures. Learn more at scijinks.gov/earths-seasons/
Twitter
In the northern hemisphere, winter actually occurs when the Earth is closest to the Sun. Learn more scijinks.gov/earths-seasons/
|
Facebook
Did you know that while no two snowflakes are exactly the same, they are all six-sided? Snowflakes’ hexagonal shapes are due to the molecular structure of ice. Learn more about the science behind snowflakes: noaa.gov/stories/how-do-snowflakes-form-science-behind-snow
Twitter
Did you know that no two snowflakes are alike, but they are all 6-sided? noaa.gov/stories/how-do-snowflakes-form-science-behind-snow #SnowflakeScience

|
Facebook
While the aurora borealis is usually green, why does it sometimes appear to be a range of other colors, including red, blue, pink, and purple? Find out here: swpc.noaa.gov/content/aurora-tutorial
Twitter
Red, Green, Blue? Why does the Aurora change colors? Find out here: swpc.noaa.gov/content/aurora-tutorial #SpaceWeather

|
Facebook
Did you know that frost can form when the official low is above freezing? The official temperature is recorded around 6ft above the ground, and in a strong temperature inversion on a clear night, ground temps can be 5-10℉ cooler than the air below that. youtu.be/HBn1oSWu2nE
Twitter
Did you know that frost can form when the official low is above freezing? The official temperature is recorded around 6ft above the ground, and in a strong temperature inversion on a clear night, ground temps can be 5-10℉ cooler than the air below that. youtu.be/HBn1oSWu2nE
Facebook
Why do we see fog in valleys more often than other spots? First, air at higher elevations cools down, which then drains downslope into the valley. From there, a cool, stable layer forms near the ground, which limits turbulent mixing and traps the cool, moist air. Finally, the air near the ground continues to cool until water vapor molecules are changed into small droplets of liquid water. weather.gov/safety/fog-mountain-valley
Twitter
Looking down on the clouds? Do you know how valley fog is created? weather.gov/safety/fog-mountain-valley #FogScience

|
Facebook
Fog limits visibility, delays air travel, brings danger to the roads, and makes things generally spooky. But, how does it form? Watch this short video: youtu.be/QkRqjcO1ROk
Twitter
Fog limits visibility, delays air travel, brings danger to the roads, and makes things generally spooky. But, how does it form? Watch this short video: youtu.be/QkRqjcO1ROk #FogScience
Facebook
Wind is just air moving somewhere else...but WHERE is it going, and WHY? Check out this short video for a primer. youtu.be/kb9oRYUzlwQ
Twitter
Wind is just air moving somewhere else...but WHERE is it going, and WHY? Check out this short video for a primer. youtu.be/kb9oRYUzlwQ #WindScience
Facebook
In calm winds, our body is able to keep a thin layer of warmer air near it. Once the wind picks up, that layer is quickly disrupted, exposing any unprotected body parts to the full brunt of the cold.
Arctic air + brisk winds = dangerously cold wind chills.
weather.gov/safety/cold weather.gov/safety/cold
Twitter
In calm winds, our body is able to keep a thin layer of warmer air near it. Once the wind picks up, that layer is quickly disrupted, exposing any unprotected body parts to the full brunt of the cold.
Arctic air + brisk winds = dangerously cold wind chills.
weather.gov/safety/cold weather.gov/safety/cold

|
Facebook
Santa Ana winds are strong downslope winds that blow through the mountain passes in Southern California. They are created over the Great Basin region from high-pressure air masses, which then blow down towards sea level. These winds, which can easily exceed 40 miles per hour (18 m/s), are warm and dry and can severely exacerbate brush or forest fires, especially under drought conditions. For more info, visit earthobservatory.nasa.gov/NaturalHazards/view.php?id=10727.
Twitter
Santa Ana winds are notorious for creating dangerous fire conditions. Learn how here: earthobservatory.nasa.gov/NaturalHazards/view.php?id=10727 #WindScience

|
Facebook
Do you know what to watch for when severe weather threatens? Check out NWS Skywarn. Help keep your community safe by volunteering to become a trained storm spotter for NOAA's National Weather Service. Potential volunteers should visit weather.gov/skywarn/ and contact their local NWS office. #CitizenScience
Twitter
Let’s learn about #NWSCitizenScience opportunities! Become a trained Skywarn storm spotter and help keep your community safe! weather.gov/skywarn/ #CitizenScience

|
Facebook
Ever wanted to take rain or snow measurements? Join CoCoRaHS or Community Collaborative Rain, Hail, and Snow Network. This volunteer network of observers measures precipitation from their backyards. Any age can volunteer. Data is used by NWS meteorologists to help with forecasts. www.cocorahs.org
Twitter
Ever wanted to take rain or snow measurements? Learn more about #NWSCitizenScience and join CoCoRaHS today! Cocorahs.org #CitizenScience

|
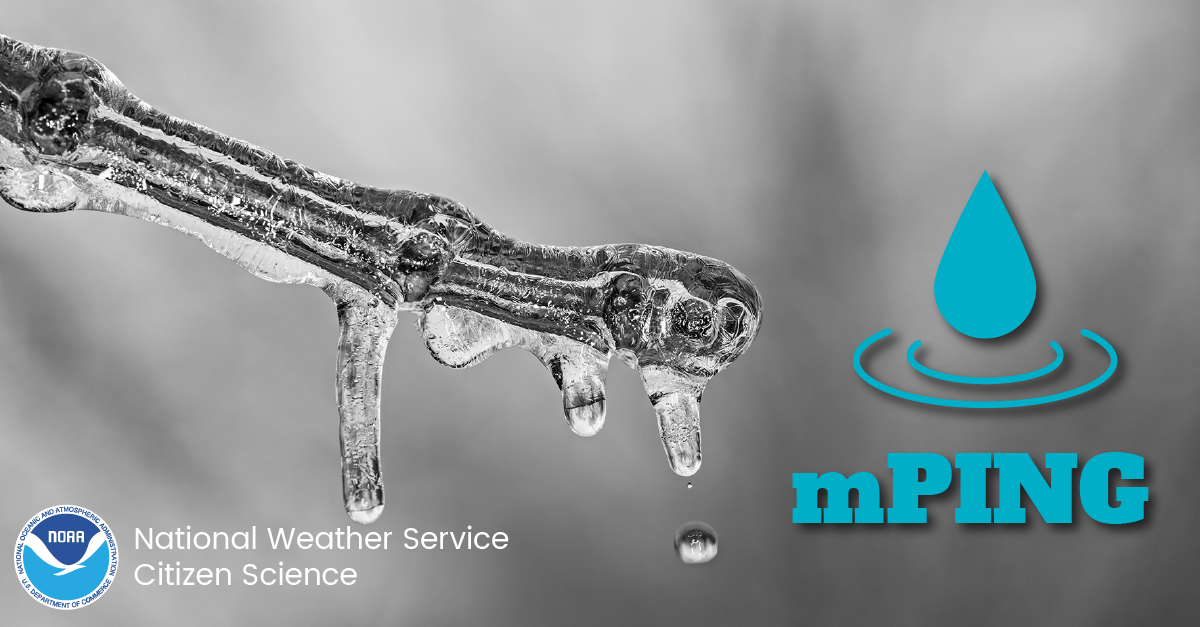
Facebook
Check out mPING (Meteorological Phenomena Identification Near the Ground) project. Weird name, cool app! You can report the type of precipitation you see where you are. No need to measure! Use the free mobile app to send reports anonymously. Reports are automatically recorded into a database, which improves weather computer models. The information is even used by road maintenance operations and the aviation industry to diagnose areas of icing. mping.nssl.noaa.gov #CitizenScience
Twitter
Check out mPING! Weird name, cool app for #CitizenScience! Report weather types via the mPing app and help improve weather model forecasts! mping.nssl.noaa.gov #NWSCitizenScience
|
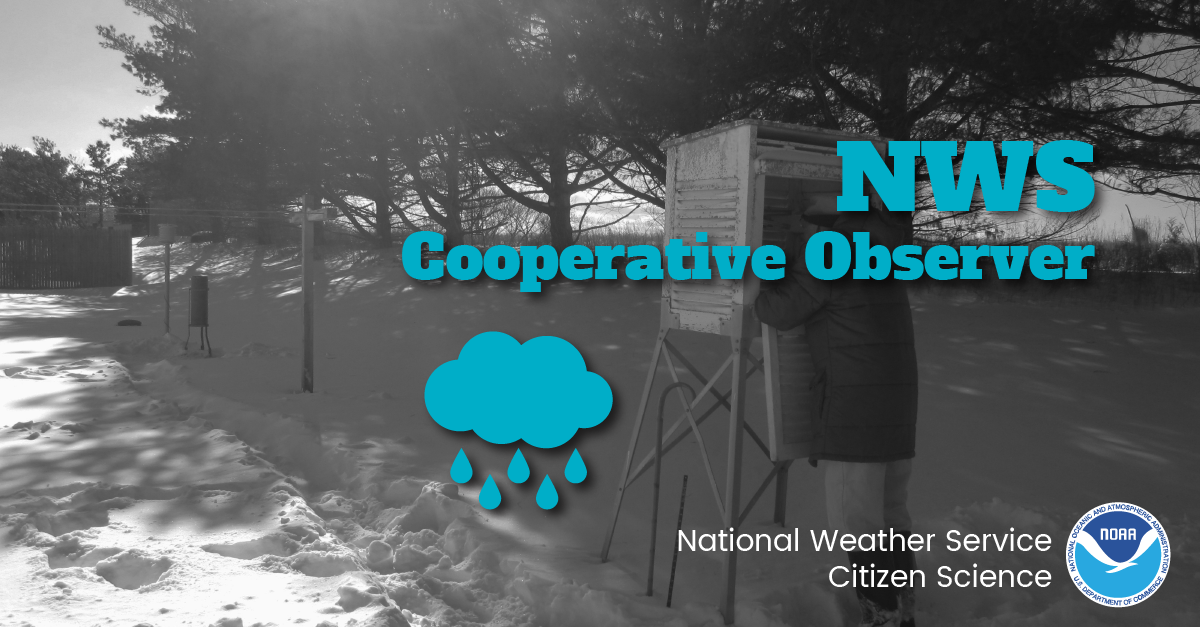
Facebook
The NWS Cooperative Observer Program (COOP) is truly the nation's weather and climate observing network of, by, and for the people. With over 8,700 volunteer observers, this program has existed since 1890 and is one of the few programs that measures snowfall and its water equivalent. Help #NWSCitizenScience and become a COOP! You can help support warnings, forecasts, and build a climatological database! For more information, visit weather.gov/coop/Overview
Twitter
Join NWS COOP! The NWS Cooperative Observer Program (COOP) is truly the nation's weather and climate observing network of, by, and for the people. Help support warnings, forecasts & build a climatological database! weather.gov/coop/Overview #NWSCitizenScience
|

