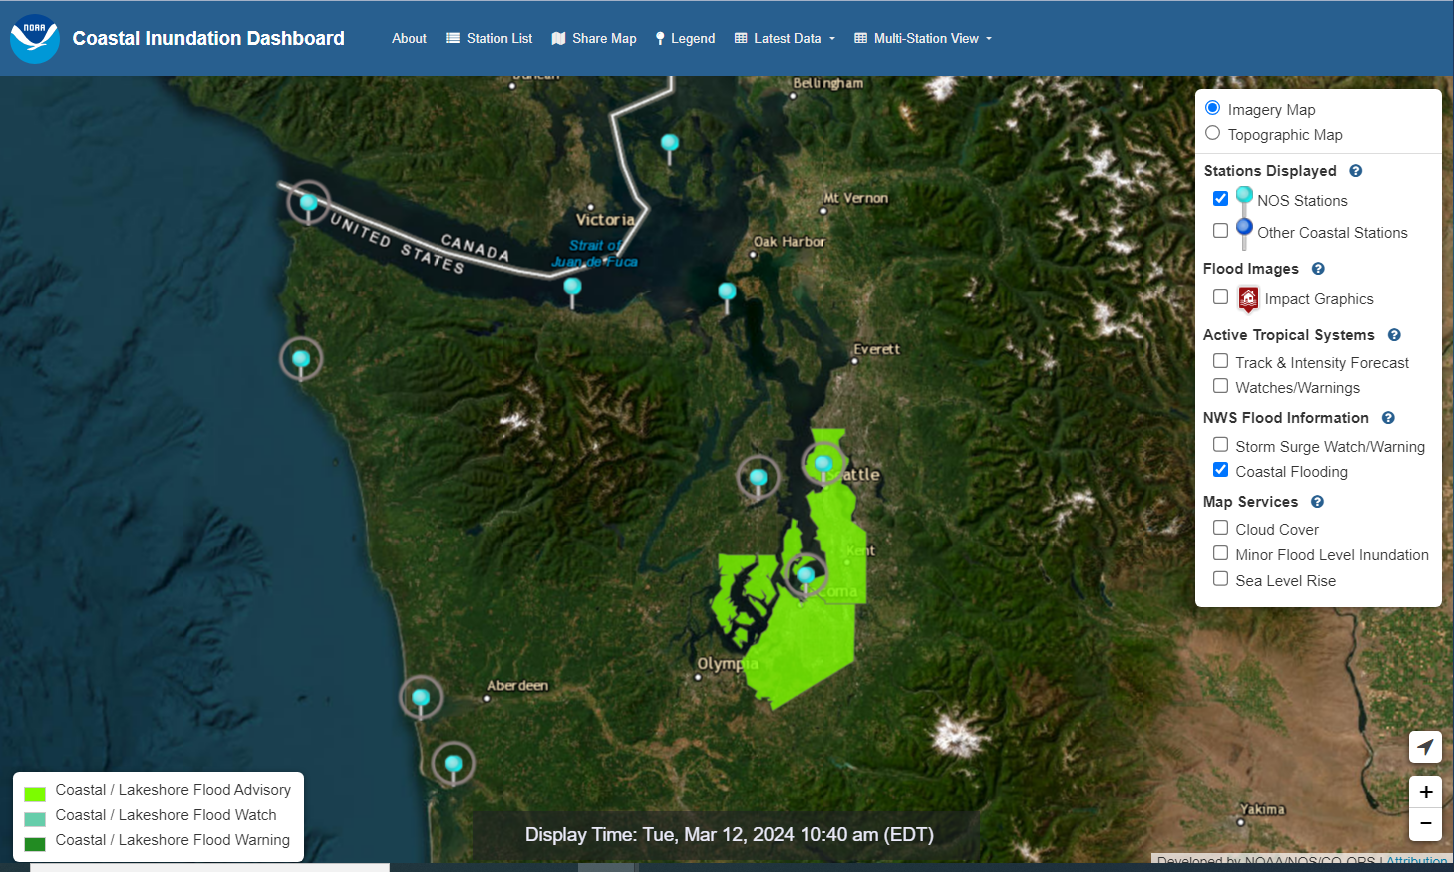
CO-OPS, the Center for Operational Oceanographic Products and Services in the National Ocean Service, maintains tide gauges and other oceanographic and meteorological sensors around our nation’s sea coasts and Great Lakes. Over the past few months, we have launched some upgrades to our Coastal Inundation Dashboard web product. Coastal Inundation Dashboard provides real-time and historic coastal flooding information along with projected high tide flood frequency at NOS long-term water level stations nationwide. The product dynamically compares real-time water level observations with minor, moderate and major flood impact thresholds established by local National Weather Service (NWS) Weather Forecast Offices (WFOs) to highlight where coastal flooding may be occurring.
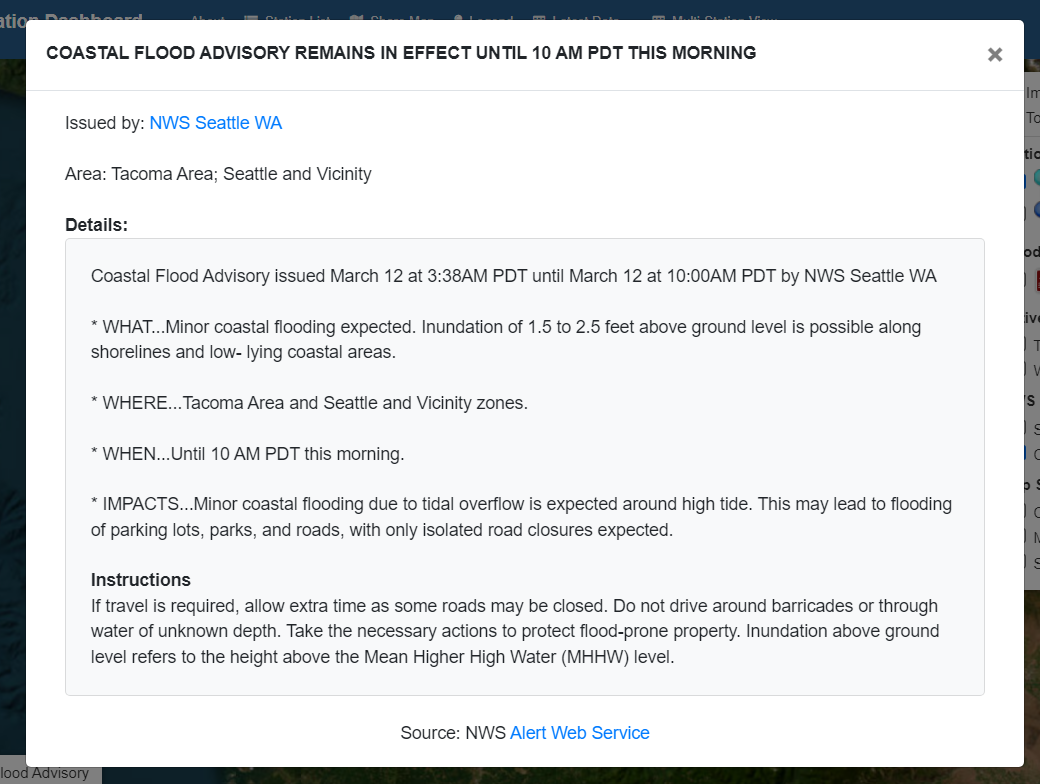
One of the map layers, Coastal Flooding, allows users to toggle on locations along the coast that are under an NWS coastal flood advisory, watch or warning, which indicate areas that may experience flooding over the next 1-2 days. Previously the map only displayed the NWS zones along the coast where the advisory was active, however now users can click the watch/warning areas to bring up a detailed text advisory information issued by the NWS WFO in an easy-to-read WHAT-WHERE-WHEN format along with a link the WFO page for more forecast information. This provides valuable background context related to the coastal flood event including the expected duration and impacts, directly within the Dashboard map.
 |
 |
A second new feature that was recently implemented relates to a feature where the Dashboard allows users to view historic flood days at coastal water level stations both annually and seasonally. Flood days are computed based on historic water level observations exceeding a station-specific flood threshold derived from an analysis of flood thresholds along the coast. Understanding that the threshold set for each station may not be representative for all locations in the vicinity of the station, the Dashboard now allows users to define their own flood threshold and recompute flood days based off of the new threshold. This improvement allows users who have a good understanding of when flood impacts begin within their area of concern to more accurately assess their historic flood frequency and how it has changed with sea level rise and an increase in coastal storms.
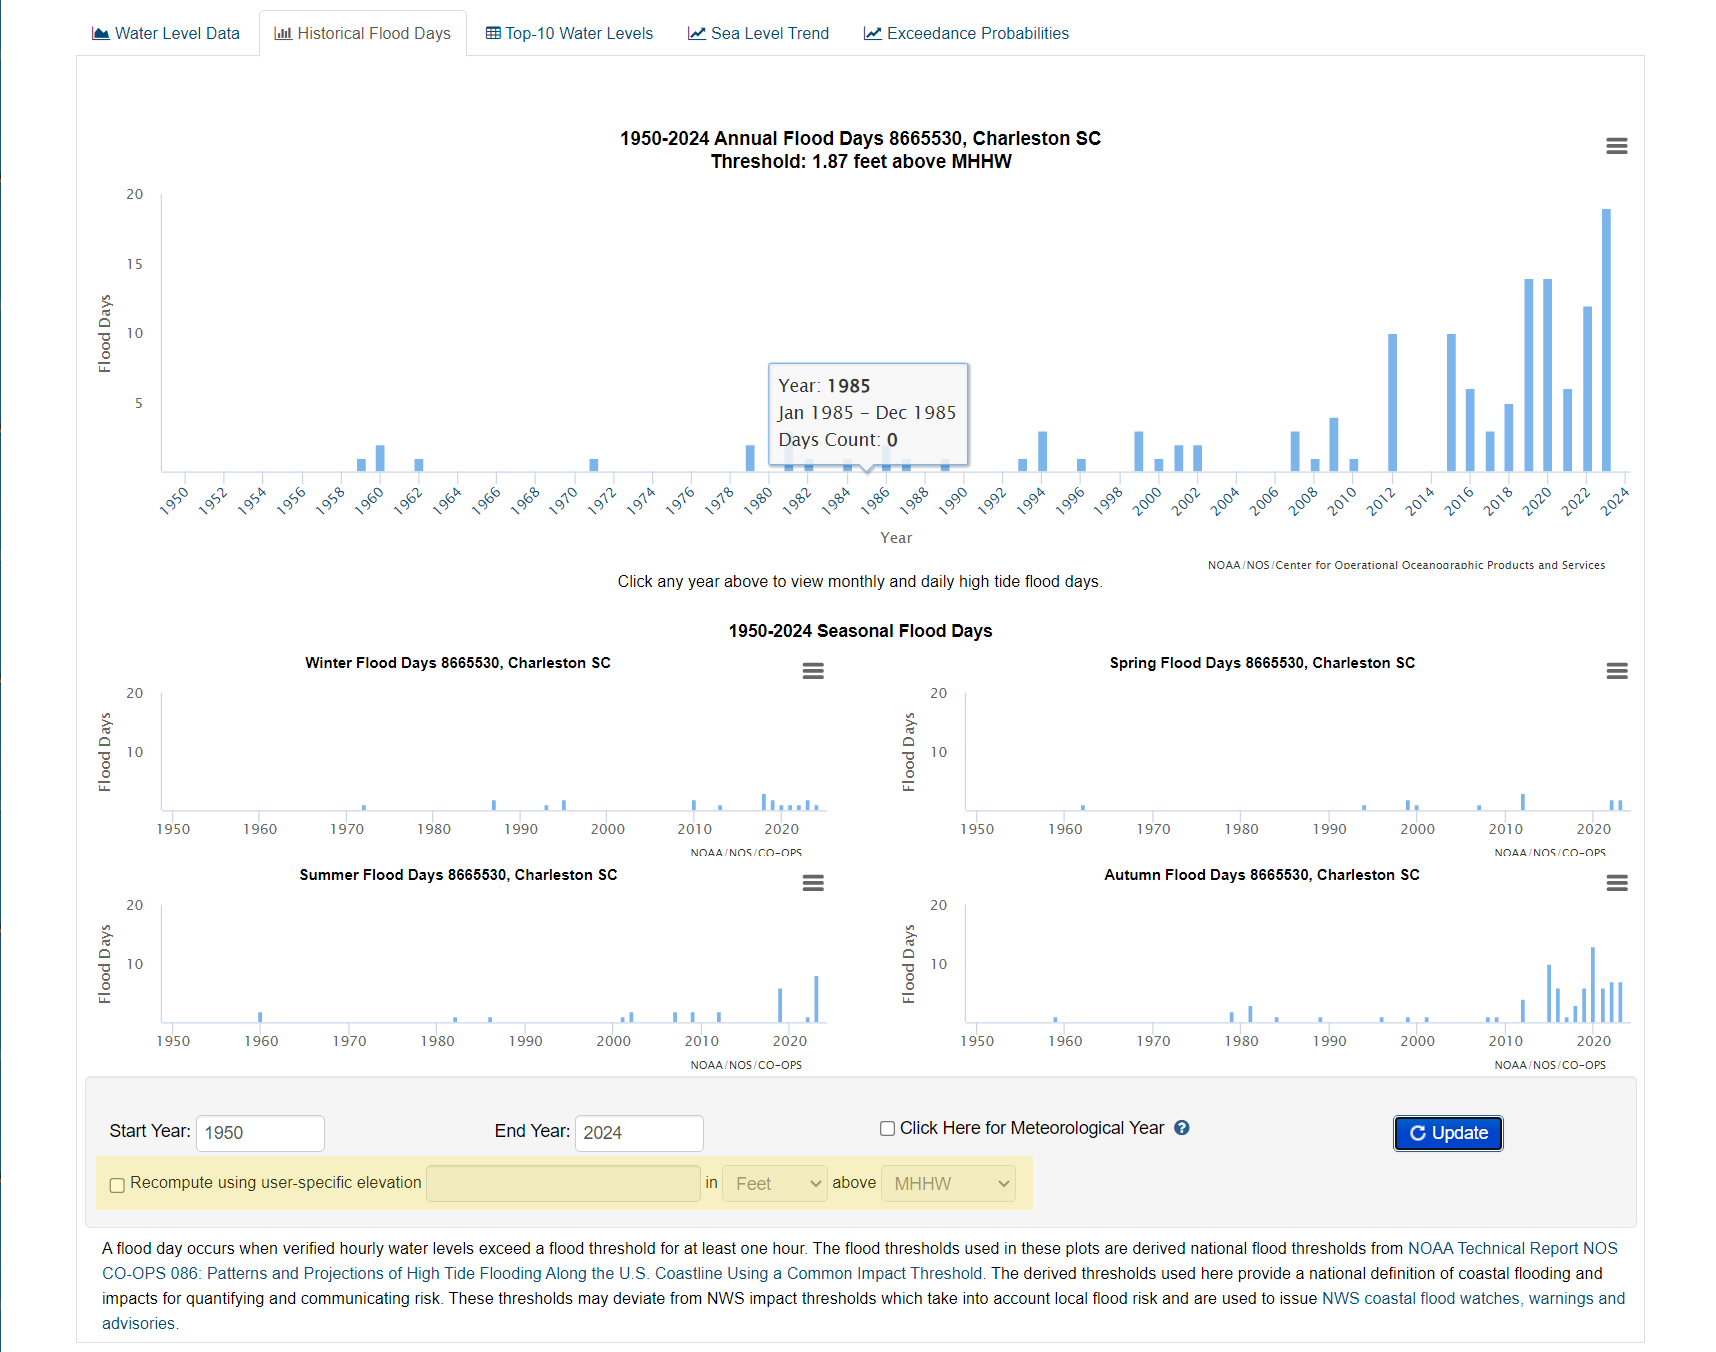
Finally, several improvements were made to the user interface when viewing station-specific information, including making it easier to save hyperlinks to specific station tabs such as Historical Flood Days and Top-Ten Water Levels and adding links to additional station data and information such as tidal datums and tide predictions directly within the Dashboard.

