National Weather Service United States Department of Commerce

Tropical information for southeast Arizona

Welcome to the southeast Arizona tropical page. This site was put together to give you, the user, access to tropical weather information that has affected Arizona.
 
Tropical cyclones in Arizona
 
Perhaps somewhat surprisingly, Arizona is occasionally struck by tropical cyclones. In fact, southern Arizona experiences flash flooding indirectly associated with a tropical cyclone about once every two years, while an intact, albeit decaying, tropical depression or tropical storm moves across southern Arizona about once every five years.
 
Until the 1920s, the mere existence of eastern Pacific hurricanes was disputed. Even when they were "discovered," eastern Pacific tropical cyclones were not routinely tracked until the 1940s, or named until 1960. When these tropical cyclones were detected, they were either bearing down on an unprepared coast, or were disrupting shipping and fishing. However with the deployment of weather satellites in the mid 1960s, tropical cyclones were finally tracked routinely and accurately. Forecasting these storms has improved immensely since the 1980s with the use of better computer weather models, Doppler weather radars, and a better observing system in both the U.S. and Mexico.
 
Tropical storms and hurricanes, because they thrive in warm water, weaken rapidly once they move inland. This is especially true in western Mexico and the southwest U.S. where several large mountain ranges severely disrupt landfalling tropical systems. However, given the right atmospheric conditions, these storms can survive far inland. Even if they dissipate hundreds of miles away from Arizona, heavy rain and flash flooding can still develop over the region.
 
Since 1965, eight remnant tropical storms or hurricanes have survived the trip over mountains and deserts to affect southern Arizona as an intact tropical storm or depression (Graphic 1).
They were, of course, in a weakened state by the time they arrived, but five (Katrina 1967, Joanne 1972, Kathleen 1976, Lester 1992 and Nora 1997) have actually made it into southern Arizona as a tropical storm, with maximum sustained winds of 39 mph or greater.
A map showing tracks of tropical weather system that hit Arizona since 1965.
Graphic 1: Track of the eight tropical cyclones which have struck southern Arizona since 1965. Data from the National Hurricane Center (//www.nhc.noaa.gov), Sellers et al. (1985), Smith (1986), and Garza (1999). Click on image for larger view.
 
Also since 1965, there have been 17 storms which, despite dissipating south or southwest of Arizona, triggered flash flooding as their remnant moisture spread into the state (Graphic 2). In fact, four of the five most serious floods in southern Arizona since 1970 were caused by the remnants of tropical cyclones
Composite map of tropical storms that had a direct or indirect impact on Arizona.
Graphic 2: Track of all eastern Pacific tropical storms and hurricanes which have produced flash flooding in southern Arizona since 1965. Click on image for larger view.
Historical Hurricane tracks
 
Local research has found that El Nino-Southern Oscillation (ENSO) has little effect on either increasing or decreasing the chance of a tropical cyclone impacting Arizona in any given year, although there are typically more tropical storms and hurricanes in the eastern Pacific during El Niño years. Although longer-range ENSO patterns may not offer much forecasting help, there is a critical weather pattern which tends to support tropical cyclone incursions into Arizona. About 70 percent of all eastern Pacific tropical storms and hurricanes track harmlessly west over the open waters of the eastern Pacific. The other 30 percent, though, are turned northward by the jet stream as it occasionally dips south along the west coast of the U.S. (Graphic 3). This tends to happen more frequently during the latter stages of the North American Monsoon from late August into early October. Once a tropical storm is forced to turn northward, or recurve, there is a much greater chance of it affecting a land area before dissipating, and for remnant moisture to be carried into northwest Mexico or the southwest U.S.
Typical Arizona Tropical cyclone weather pattern
Graphic 3: Typical Arizona tropical cyclone weather pattern. An incoming upper level trough will either capture the deep moisture and funnel it into Arizona, or will steer the tropical storm or hurricane itself toward Arizona. This same trough will tend to weaken the tropical cyclone, but it also can accelerate it, and not allow it to weaken as quickly as usual as it heads toward the region. Click on image for larger view.
 
The turn north toward Arizona still does not guarantee a direct impact on the region. The interaction between the steering trough to the west and the weakening tropical cyclone is critical, and has to be exact for heavy rains to develop over Arizona, or for the tropical system itself to arrive in Arizona intact. If the trough moves into the west coast too fast, much of the tropical remnants can be suppressed to the south and east of Arizona. If the trough weakens or dissipates, either the tropical system may stall well to the south and dissipate, or there will not be enough atmospheric lift to work on the incoming moisture. In these examples, rainfall can end up spotty and limited, while clouds associated with both systems stabilize the atmosphere and prevent embedded thunderstorms from developing.
 
Tropical systems can have a significant impact for weeks and even months after the storm has passed. The heavy rains from these tropical systems can saturate the thin soils over Arizona in the fall, with the water remaining locked in the soil all winter due to lower evaporation rates. This makes it easier for subsequent winter storms to cause large-scale flooding.
 
Acknowledgement:
We are greatly indebted to David Roth at the NOAA/NWS Hydrometeorological Prediction Center, and the late Miguel Cortez at Servicio Meteorólogico Nacional, for their work in documenting tropical-cyclone rainfall in both the southwest U.S. and Mexico. The rainfall graphics shown for each tropical cyclone listed on our web page were produced by Mr. Roth. The extensive information exchange between the SMN and the NWS has greatly helped forecasters in recent years to better predict tropical cyclone rainfall in the southwest U.S. and Mexico.
 
References:
Garza, A.L., 1999: 1985-1998 North Pacific Tropical Cycles Impacting The Southwestern United States and Northern Mexico: An Updated Climatology. NOAA Technical Memorandum, NWS WR-258.

_____, 2008: National Hurricane Center. NOAA/NWS Tropical Prediction Center, Miami, FL. [Available on line at: //www.nhc.noaa.gov].

Roth, D., 2008: Tropical Cyclone Rainfall Data. NOAA/NWS Hydrometeorological Prediction Center, Camp Springs, MD. [Available on line at: //www.hpc.ncep.noaa.gov/tropical/rain/tcrainfall.html].

Sellers, W.D., R.H. Hill, and M. Sanderson-Rae, 1985: Arizona Climate: The First 100 Years. University of Arizona Press.

Smith, W, 1986: The Effects of Eastern North Pacific Tropical Cyclones on the Southern United States, NOAA Technical Memorandum, NWS WR-197.

 
Eastern Pacific
Graphical tropical weather outlook (GTWO) of the eastern Pacific Ocean. Click on the above image to jump to the GTWO of the Pacific basin.
Atlantic basin

Graphical tropical weather outlook (GTWO) of the Atlantic Ocean basin and the Gulf of Mexico. Click on the above image to jump to the GTWO of the Atlantic basin.


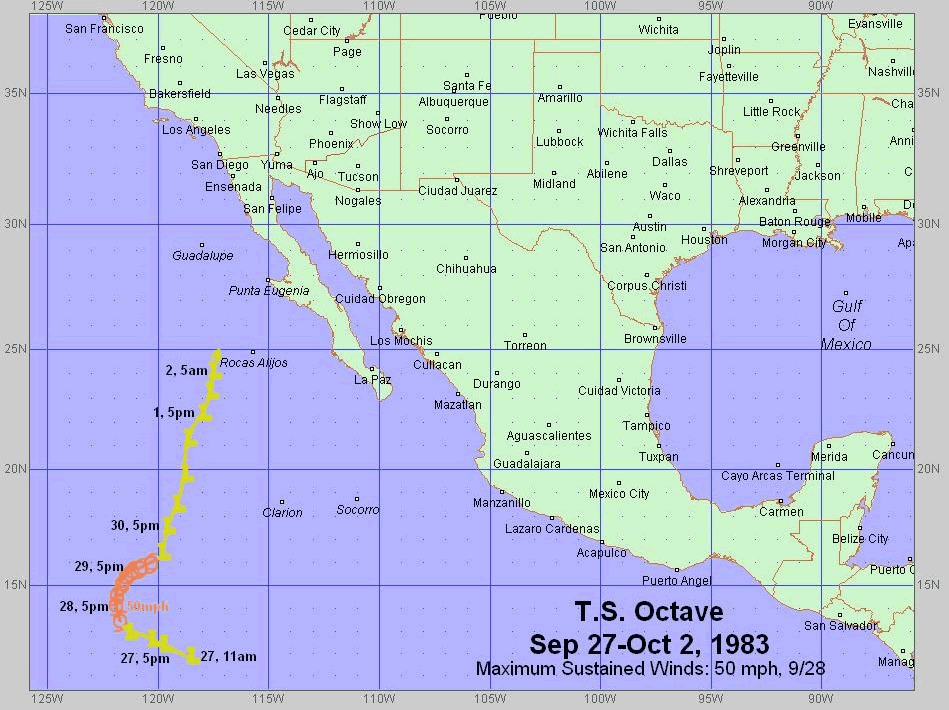
Tropical Storm OCTAVE 1983
Forty years ago this fall, southeast Arizona experienced perhaps its worst weather-related disaster in recorded history. The Flood of 1983 killed 13 people and injured hundreds in a five-day period. Dozens of homes, businesses, roads and bridges were destroyed or heavily damaged in the Tucson Metropolitan Area alone. The towns of Clifton, Duncan, Wilkleman, Hayden and Marana were almost entirely submerged by flood waters. Over 10,000 people were driven from their homes. Over 1300 homes were either destroyed or heavily damaged. Total damage across Arizona reached $500 million in 1983 dollars, which today translates to a little over $1 billion.
 
The stage for the record flooding was set earlier in 1983. A very wet winter across Arizona was followed by a wet monsoon season. Soils were already saturated by the time Octave arrived. Even modest amounts of rain would have caused problems. What every corner of southeast Arizona received instead was 3 to 8 inches of rain between the afternoon of September 28 and the morning of October 3, 1983, with isolated totals up to a foot (Graphic 1). Tucson International Airport officially received 6.71 inches of rain, however much of the City of Tucson received over 8 inches, Mt. Lemmon picked up 10.45 inches, and Mt. Graham received around 12.00 inches. Image of rainfall produced by Tropical Storm Octave across the southwest United States
  Graphic 1: Rainfall associated with Tropical Storm Octave. Data from Roth (2008) and Saarinen, et al. (1984).
 
Image of Tropical Storm Octave track. The torrential rains were caused not only by the remains of Octave, but also by an unusually strong, early fall, low pressure system off the California coast. Octave herself was never a strong tropical storm. Her maximum sustained winds peaked around 50 mph on September 29. By the morning of September 30th, she had already weakened to a tropical depression, and by the morning of October 2nd, Octave had degenerated into a remnant low (Graphic 2).
Graphic 2: Track of Tropical Storm Octave.  
 
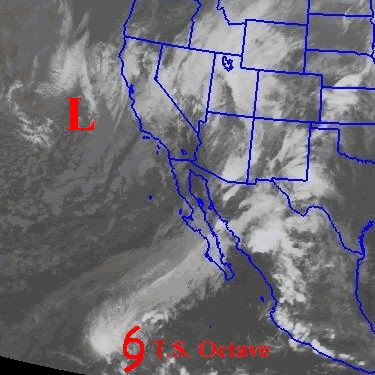
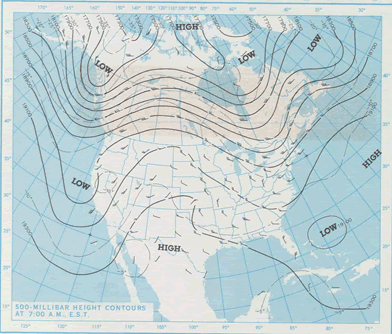
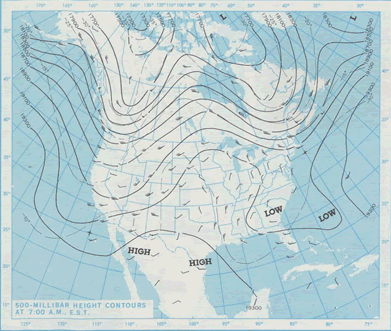
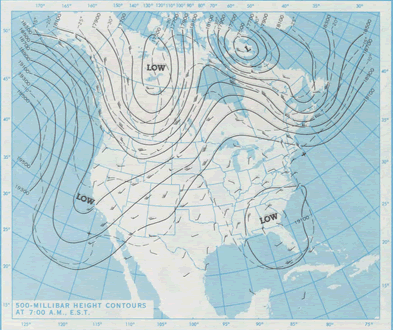
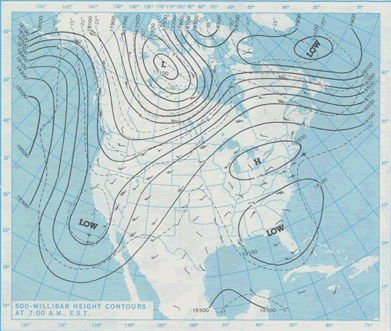
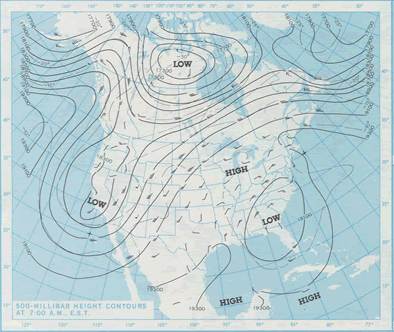
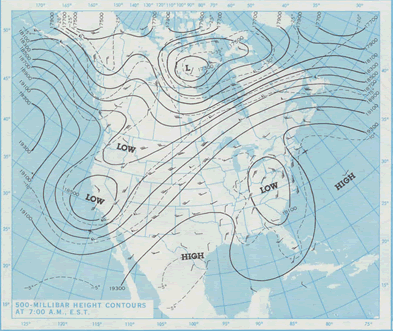
However the California low pressure stalled just west of the California coast, and funneled almost all of the remnants of Octave northeast into the southeast half of Arizona (Graphic 3).
Click on image below for a satellite loop from the evening of September 29, 1983 to the morning of September 30, 1983.
Satellite image of Octave on September 29, 1983
Graphic 3: Satellite image of T.S. Octave and incoming low pressure system, 500pm MST, September 29, 1983. The first of three rounds of very heavy rain was already drenching southeast Arizona.
 
Thunderstorms associated with Octave began on September 28, although most of the initial rain was spotty. On the afternoon of the 29th, the first of three waves of heavy showers and strong thunderstorms swept across southeast Arizona. There was a break on the 30th, but soon after midnight on October 1st, a steady, drenching rain developed over southeast Arizona which continued through mid morning. The flooding, which up until that point had been rather isolated, quickly turned serious and widespread. River bank erosion began to cut into bridge pilings, homes and businesses. Virtually every low water crossing in Tucson flooded as police and fire departments struggled to respond to hundreds of requests for help. A third round of very heavy rain swept across southeast Arizona in the early morning hours of October 2nd, which sent most river gaging points along the Santa Cruz, Rillito, and Gila Rivers to their highest crests and flows on record.
 
As bad as it was, the Flood of 1983 could have been even worse. Just a few days after Octave, Hurricane Priscilla developed off the west coast of Mexico, and for a time on October 4th and 5th, threatened to follow almost the same path as Octave into Arizona. Fortunately, Priscilla weakened more rapidly than Octave did, her moisture did not become ingested into another incoming storm system, and she dissipated harmlessly about 120 miles west of Baja California.
 

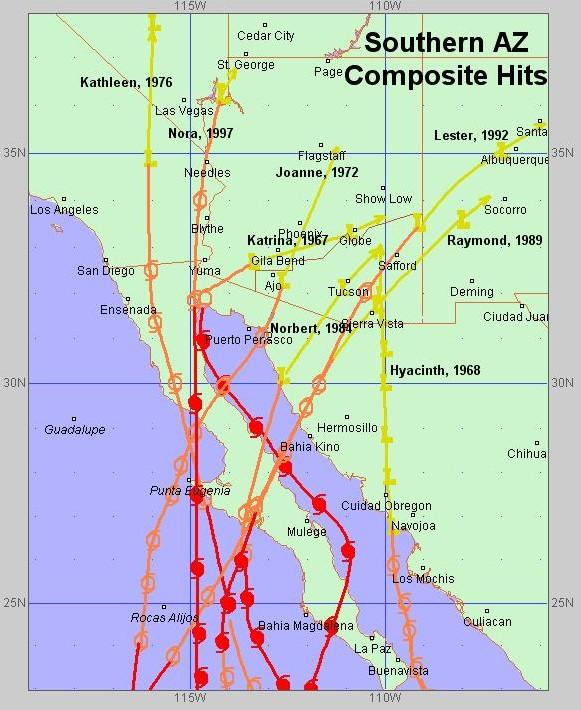
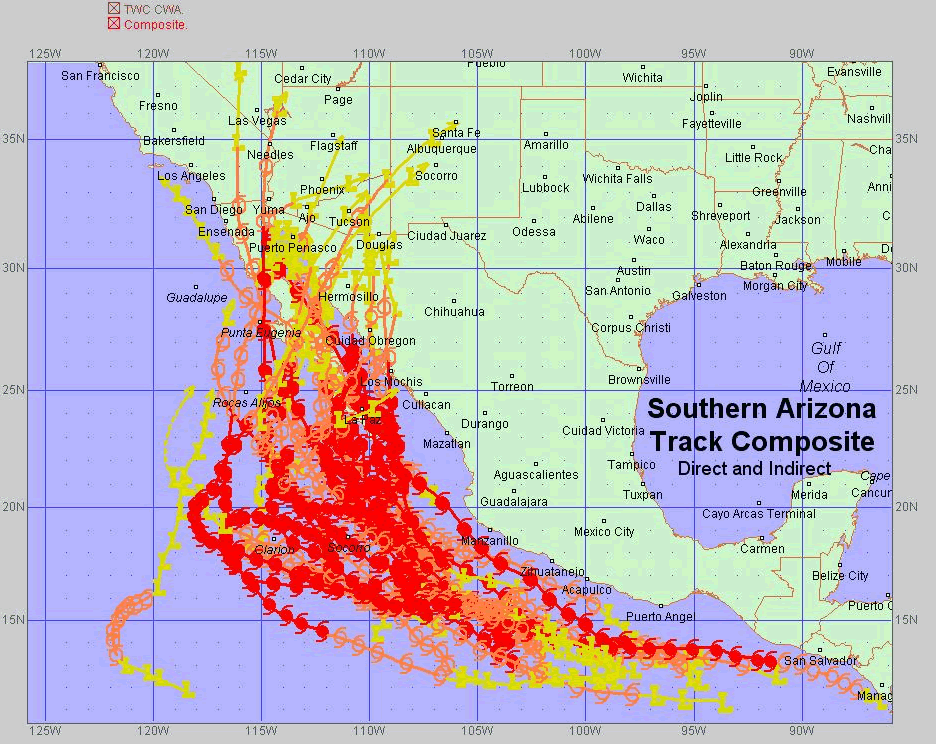
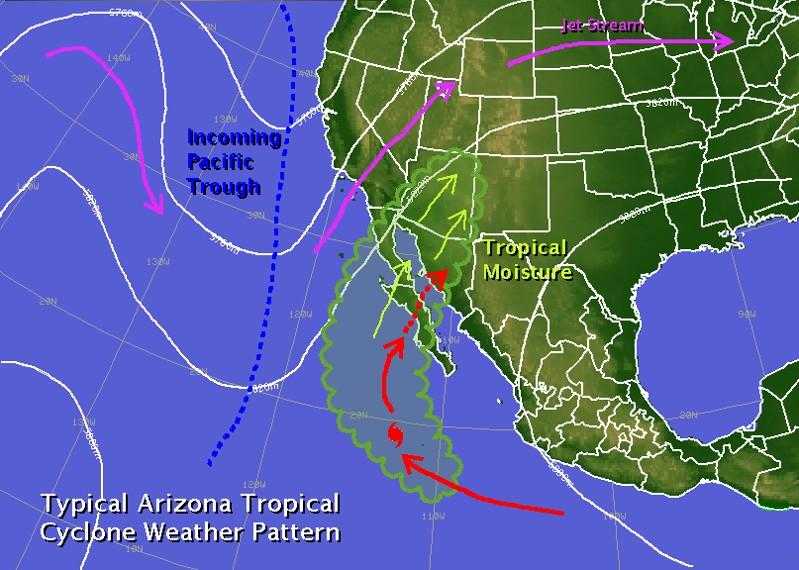
Despite its inland location, decaying tropical depressions move off the tropical Eastern Pacific into southeast Arizona about once every 5 years, and five systems have even made it into southern Arizona as tropical storms since 1965 (Katrina, 1967; Joanne, 1972; Kathleen, 1976; Lester, 1992; Nora, 1997).

 
Date | [Sep 26] [Sep 27] [Sep 28] [Sep 29] [Sep 30] [Oct 1] [Oct 2]
 
 
References:

_____, 2008: NHC Archive of Hurricane Seasons. NOAA/NWS National Hurricane Center, Miami, FL. [Available on line at: http://www.nhc.noaa.gov/pastall.shtml].

Roth, D., 2008: Tropical Cyclone Rainfall Data. NOAA/NWS Hydrometeorological Prediction Center, Camp Springs, MD. [Available on line at: http://www.hpc.ncep.noaa.gov/tropical/rain/tcrainfall.html].

Saarinen, T.F., V. Baker, R. Durrenberger, and T. Maddock, 1984: The Tucson, Arizona, Flood of October, 1983. National Academy Press, Washington, D.C. 112 pp.

Sellers, W.D., R.H. Hill, and M. Sandersen-Rae (editors), 1984: Arizona Climate: The First 100 Years. University of Arizona Press, Tucson, AZ. 143 pp.

Smith, W., 1986: The effects of eastern north Pacific tropical cyclones on the southwestern United States. NOAA Technical Memo, NWS-WR-197.