In order for a climate record to be useful, it needs to maintained at a location for a long period of time. This builds a representative long term average for all the recorded weather elements. For rainfall, this is especially important due to our highly variable (location to location from year to year) Monsoon rainfall and a long station climate record helps smooth out some of that variability.
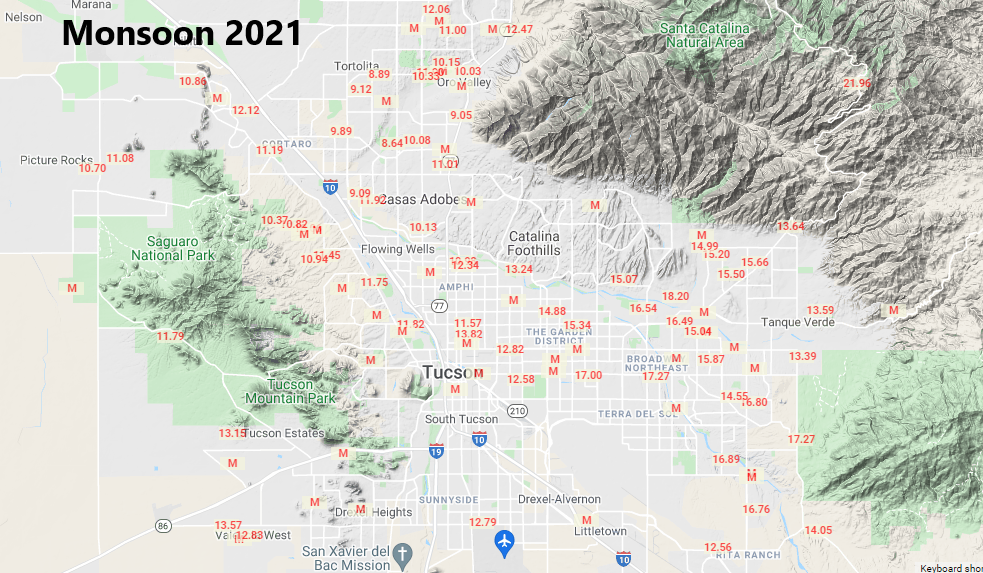
Case in point, parts of the Tucson metro received significantly more rainfall this year than what was recorded at the Tucson Airport, the official climate site for Tucson. So, does that mean the total was not correct or accurate? Not at all! It just means the airport received less than some other portions of the metro. However, if you look at the Monsoon 2021 rainfall map you will also notice that the airport received more rain than some other parts of the metro! So, spatially it happens to be a reasonable average for Tucson this year.
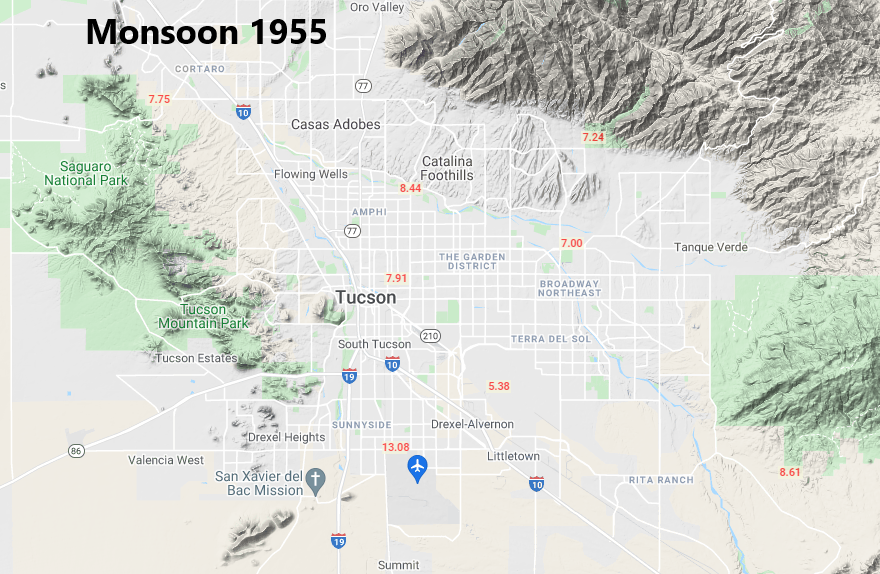
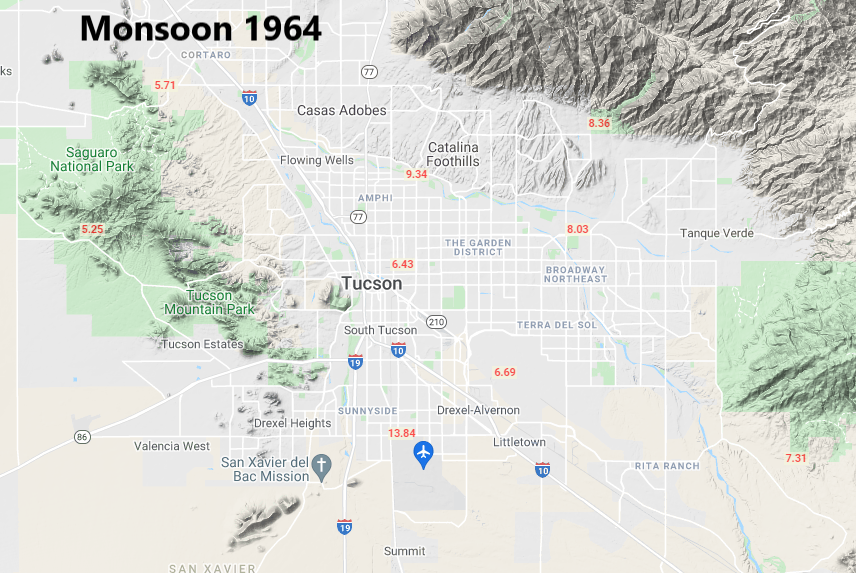
But what about the past? Well looking at year to year variation, we can compare 2021 to our first and second place wettest monsoon years, 1964 & 1955. (Note - there was a much lower density of observations back then). For both those record wet years the Tucson Airport received significantly more rain than other parts of the metro! Does that mean that wasn't accurate or correct those years? Again, not at all! It just means the airport received more rain than other locations in the metro area those specific years which highlights the extremely variable nature of Monsoon rainfall. It also highlights the need for a long period of record at a climate site to smooth out some of the variability inherent to our rainfall.