There are no watches, warnings, or advisories at this time.
Today's High Temperatures
High temperatures today will be around normal across southeastern Arizona. Increasing moisture will bring scattered clouds today with a very slight chance of a shower.






 Forecast Discussion
 Tucson Radar
 MRMS radar imagery
 GOES-18
 Southern Arizona
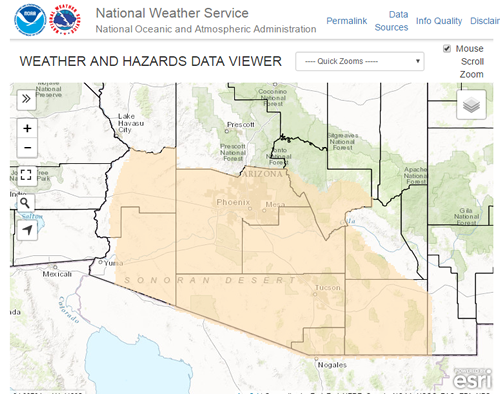 Detailed Hazards
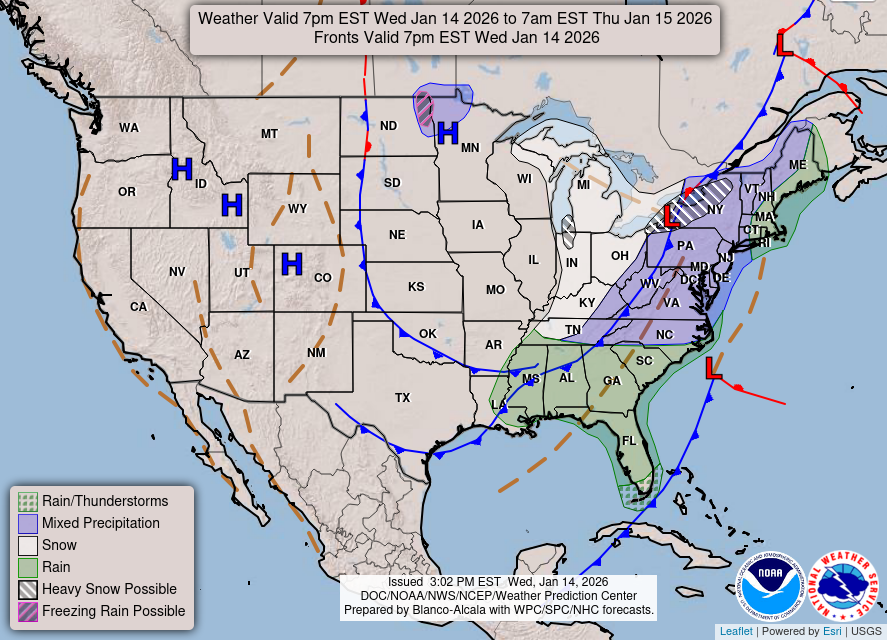 Weather Map
 Graphical Forecasts
 Heat Risk
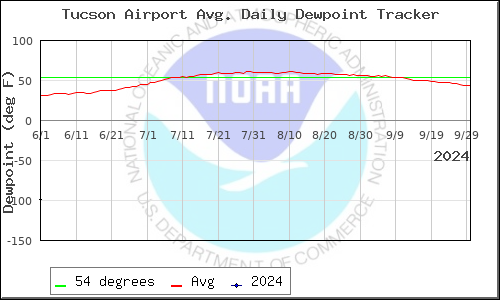 Monsoon
 Climate Graphs & Charts
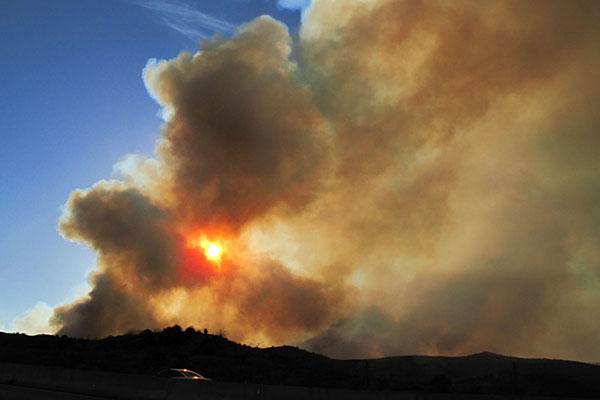 Fire Weather
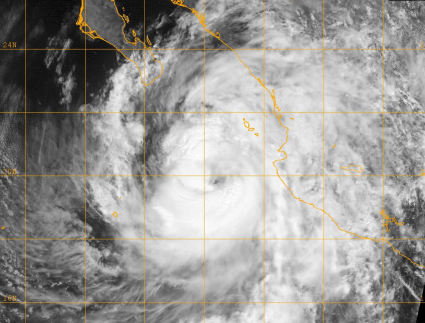 Tropical
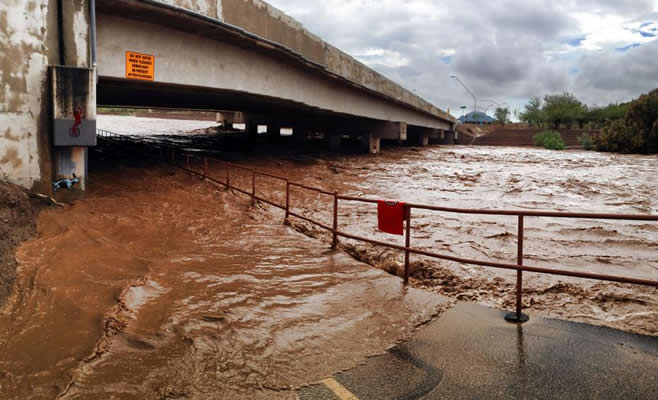 Hydrology
 Skywarn
 Drought Page
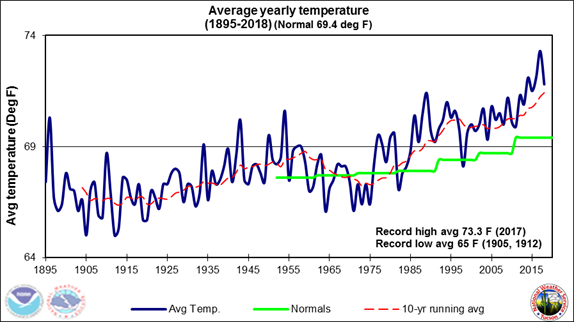 Past Tucson Climate reports
 Hourly Forecasts
 Follow us on X
 Follow us on Facebook
 Follow us on YouTube
 TWC RSS Feed