National Weather Service
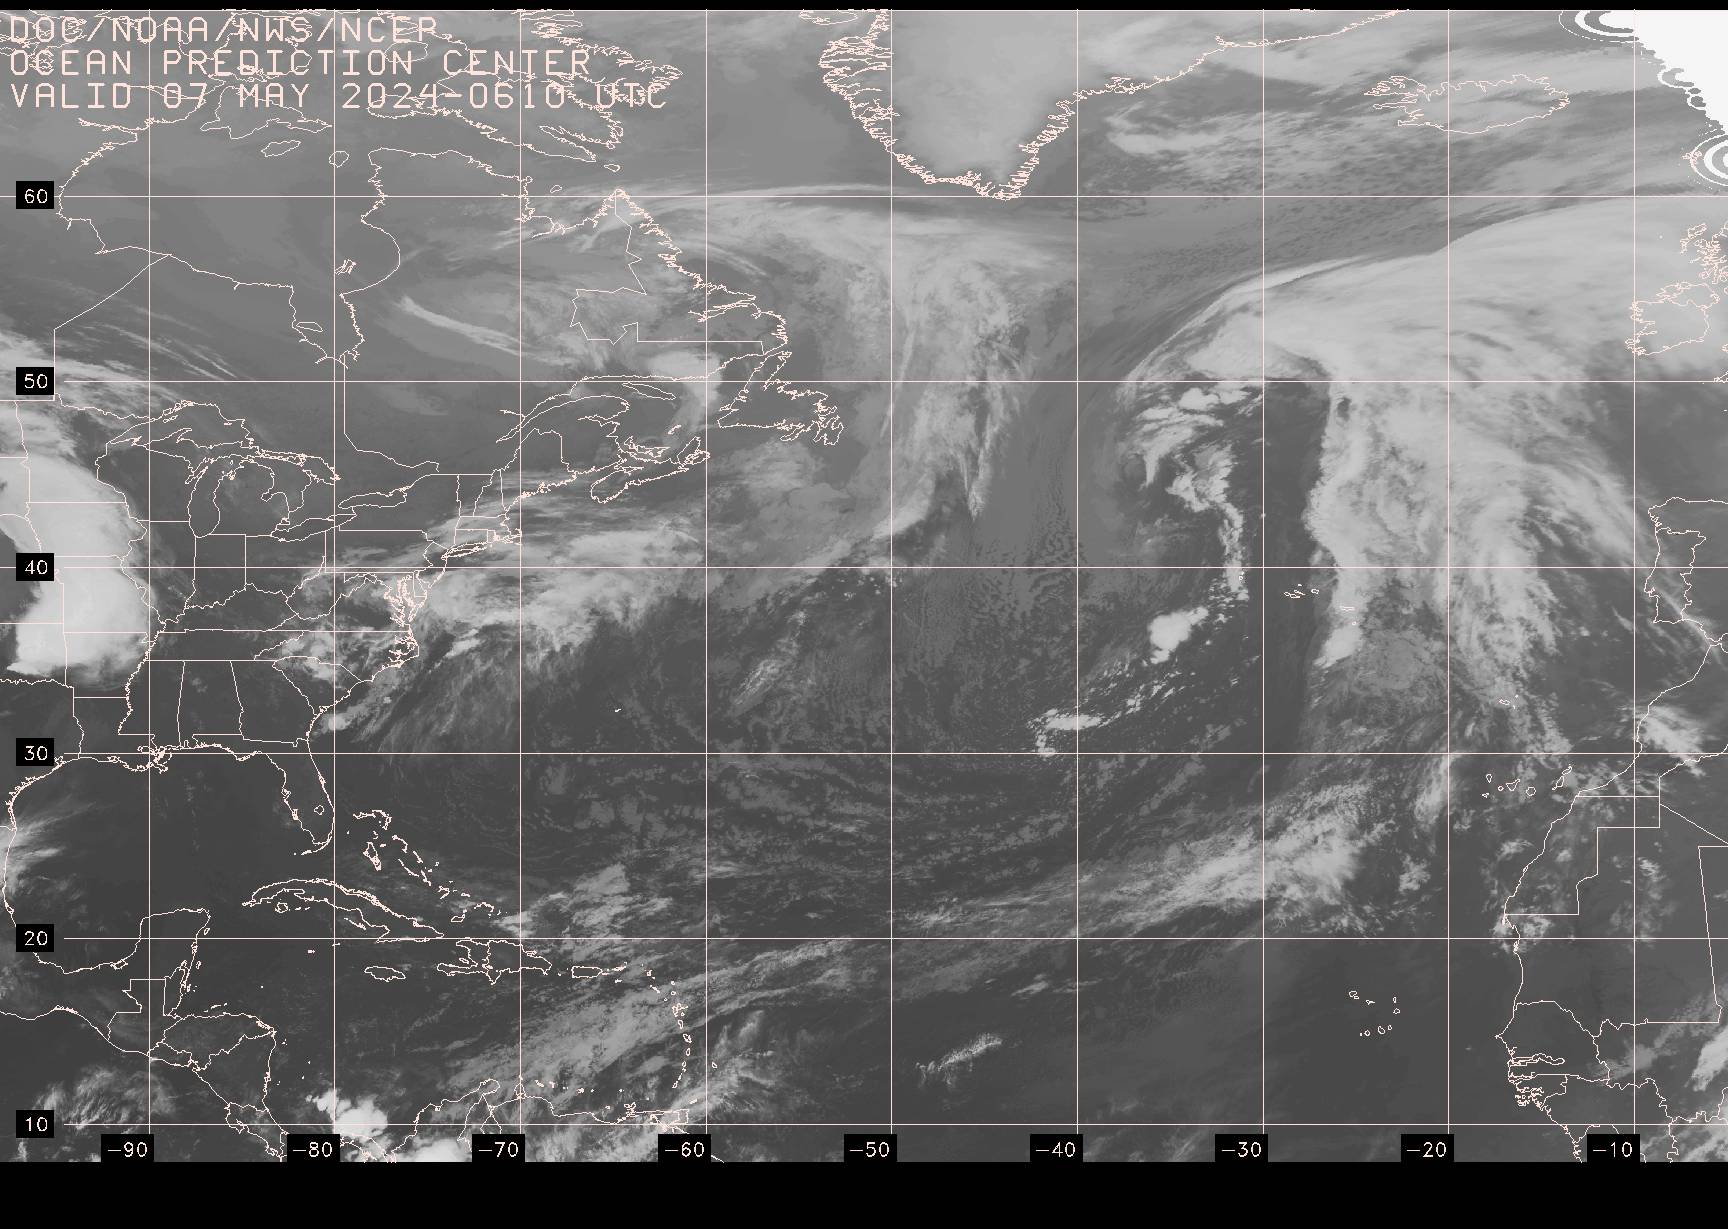
Boston Radiofax Charts Mobile Page
Note: Tropical Cyclone Danger Area chart replaced by 48HR High Wind/Wave Warning chart Dec 01 - May 14 Valid times 00z,06z,12z and 18z, Map area 05N-40N, 35W-100W
These charts also available via E-mail
Tropical cyclone charts also broadcast from New Orleans, LA
Always check date/time
Questions/comments
www.weather.gov/marine
marine.weather@noaa.gov