
Life-threatening, potentially catastrophic flash flooding expected along the central Gulf Coast as the remnants of Arthur track across the area. Isolated brief tornadoes and damaging gusts remain possible overnight in the Southeast. Isolated to scattered dry thunderstorms may cause lightning-ignited fires and erratic behavior due to gusty winds across parts of the West Friday. Read More >
Latest Drought Information Statement
U.S. Drought Monitor for Texas
U.S. Monthly Drought Outlook
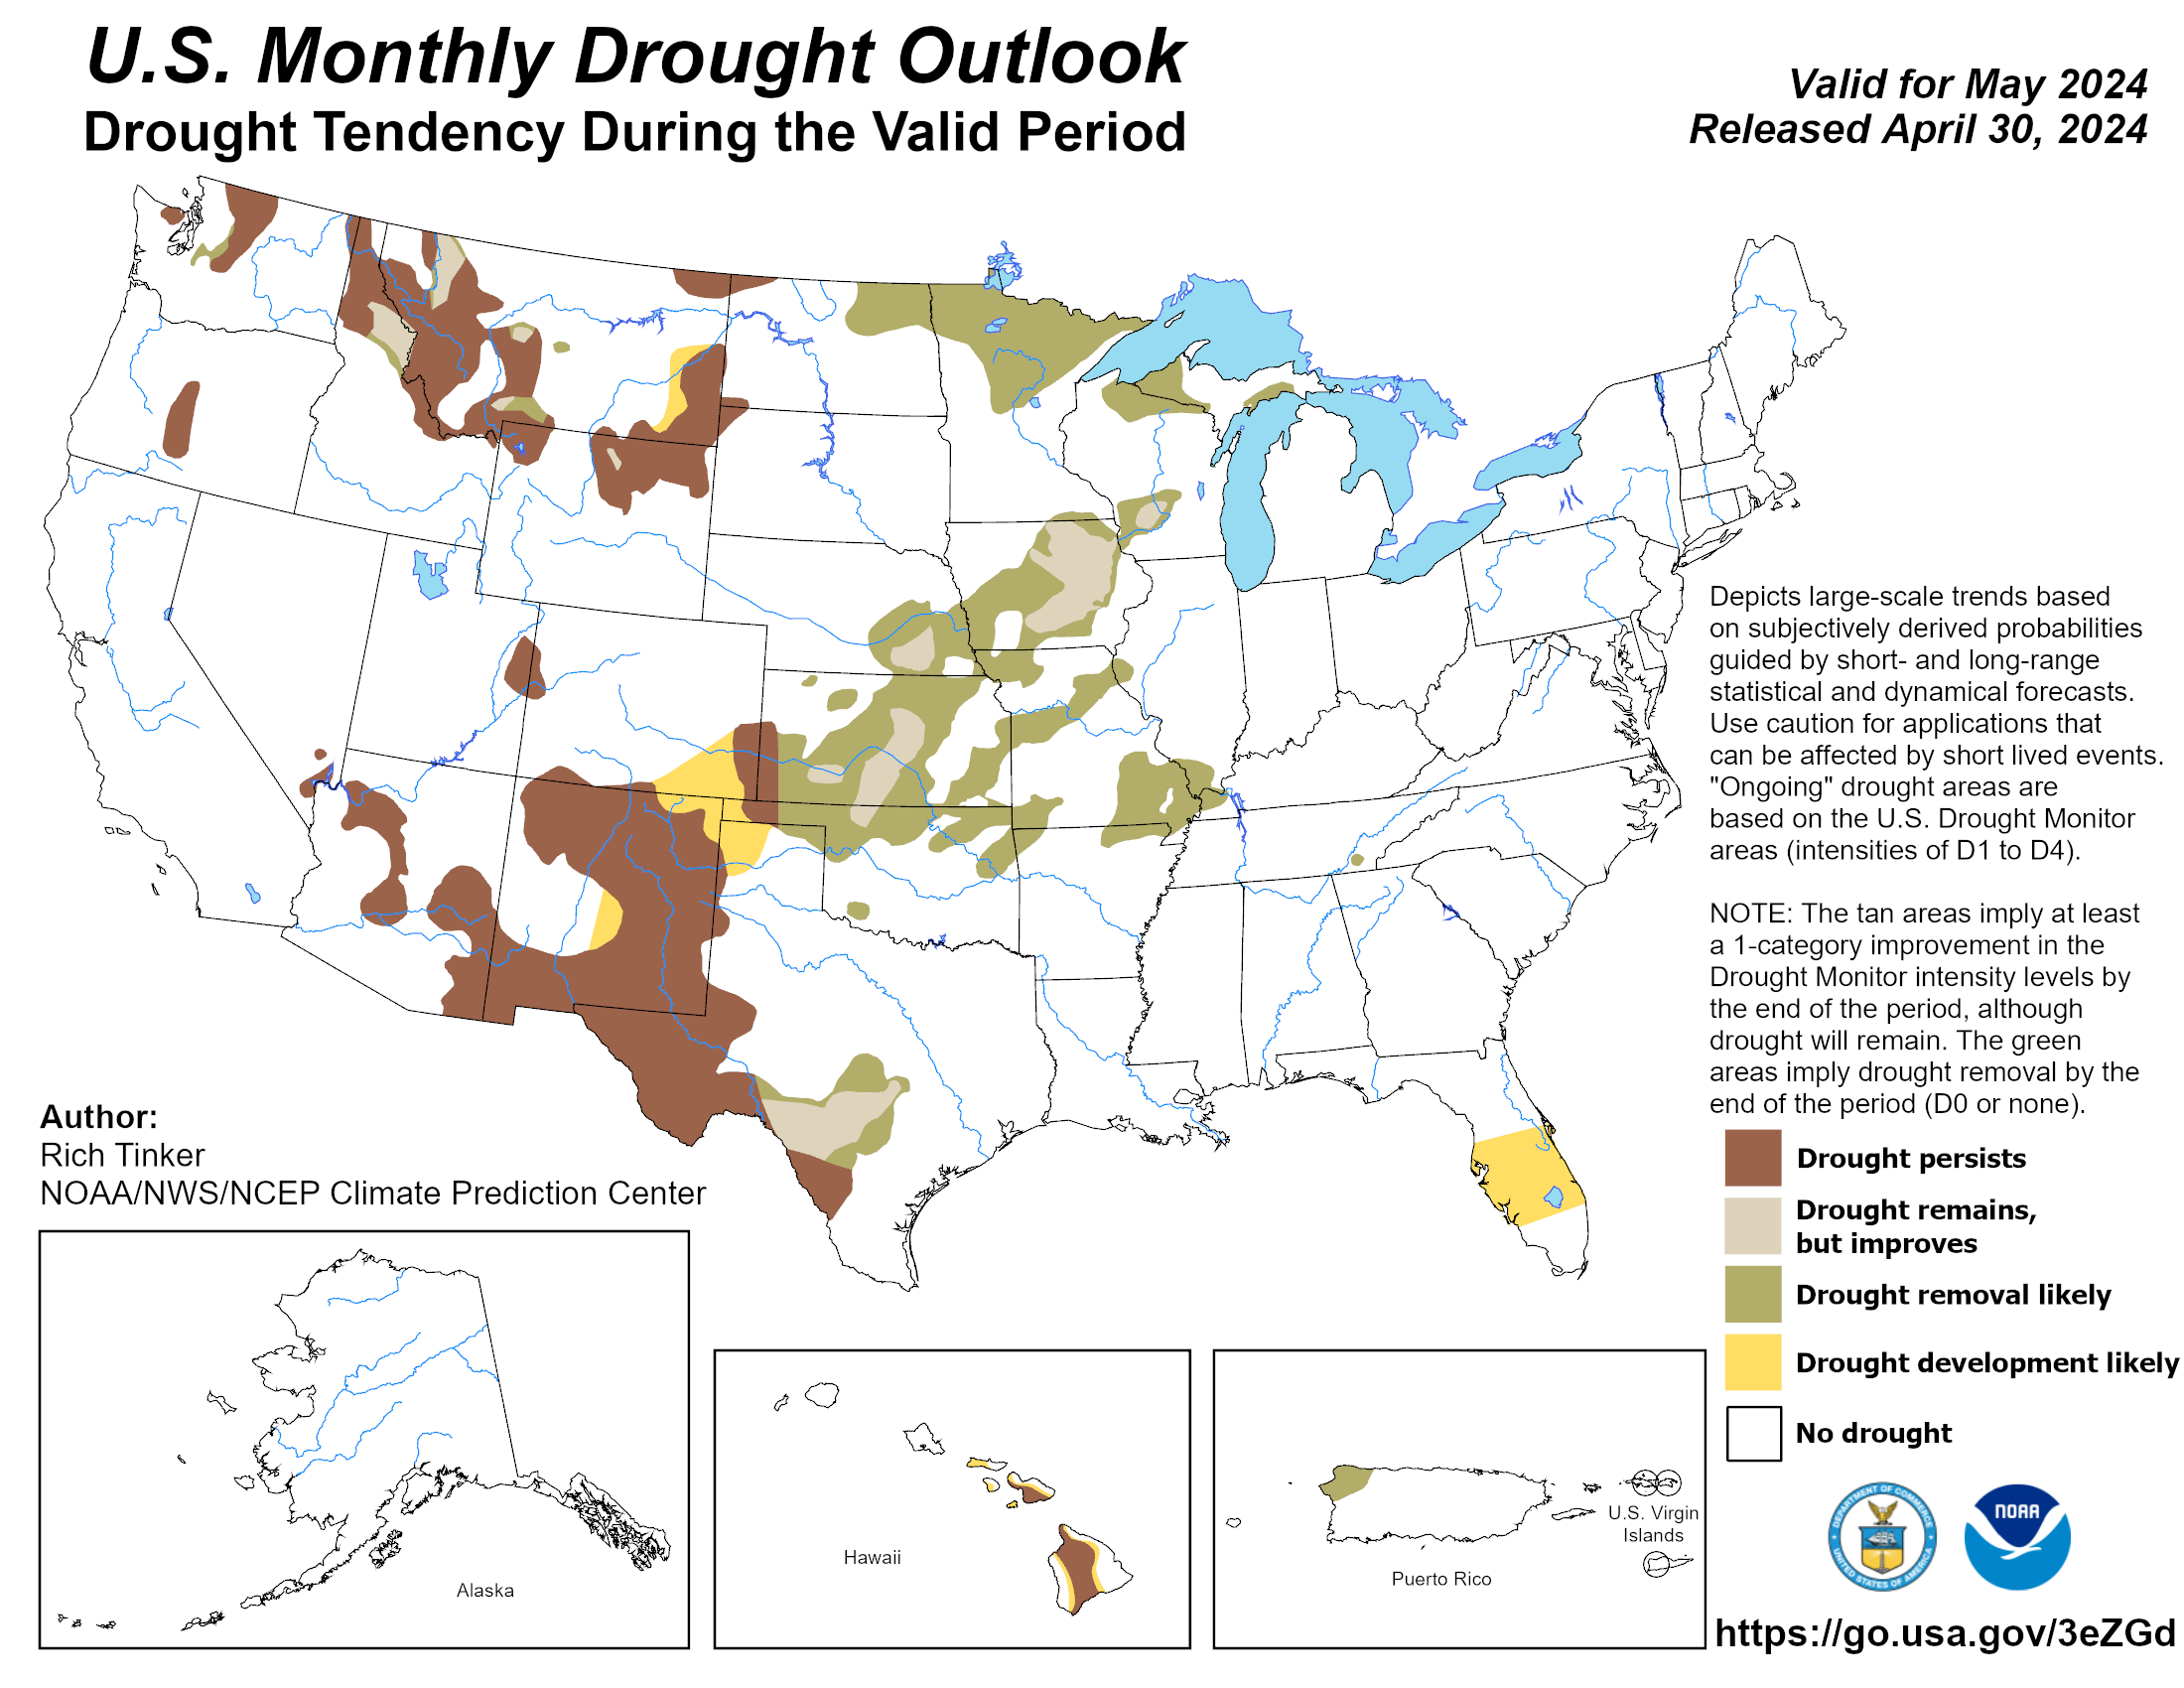
The above map is produced by the Climate Prediction CenterClimate Prediction Center.
Descriptive monthly assessment with this product
U.S. Seasonal Drought Outlook
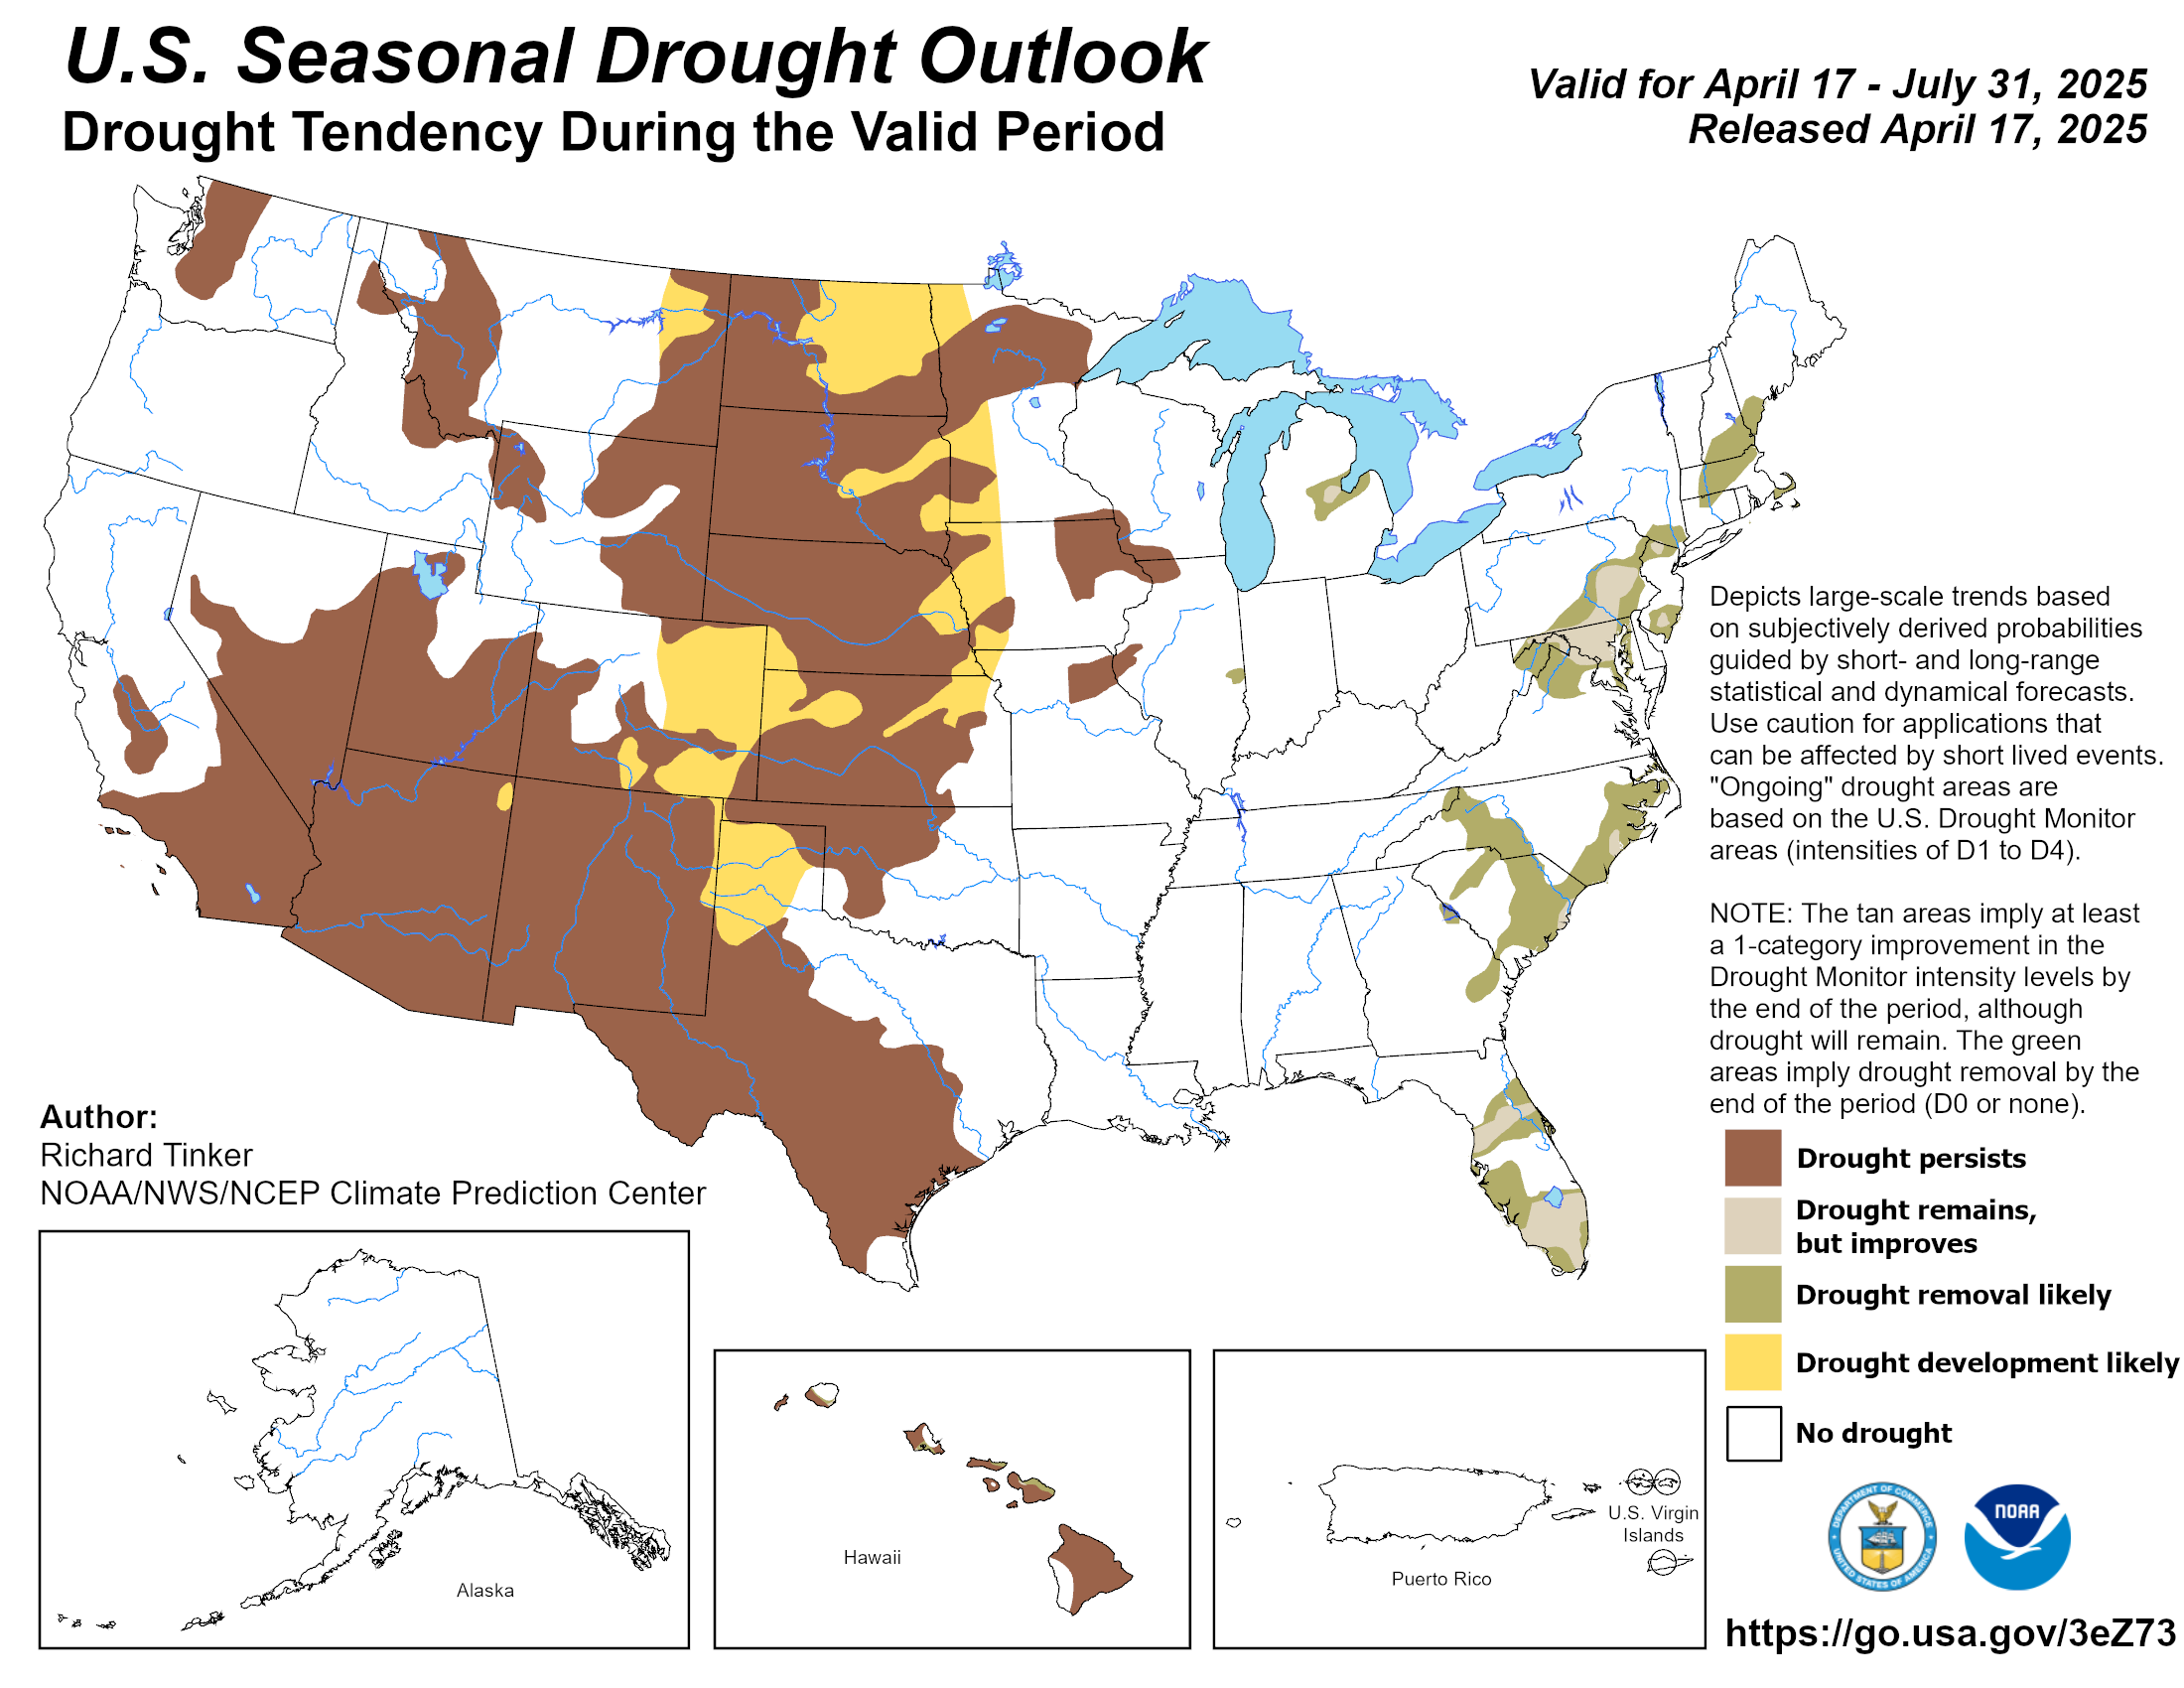
The above map is produced by the Climate Prediction Center.
Descriptive seasonal assessment with this product
Additional Links:
National Integrated Drought Information System
Drought Impact Reporter
Keetch-Byram Drought Index
Climate Prediction Center Drought Information
Texas Agricultural Drought Task Force
Statewide List of Public Water Systems Limiting Water Use to Avoid Shortages (from Texas Commission on Environmental Quality)
Palmer Drought Index
The U.S. Drought Monitor is a weekly collaborative effort among the following partners:
National Oceanic and Atmospheric Administration (NOAA),
U.S. Department of Agriculture (USDA) and
National Drought Mitigation Center (NDMC)
The National Weather Service Precipitation Analysis page graphically shows the short-term observed and climatic trends of precipitation across the lower 48 United States (CONUS) and Puerto Rico. Click on the image above to access the map. Various time spans are available from 24 hours to a year. Durations beyond 1 day also have Normal, Departure from Normal, and Percent of Normal available for viewing. Once the page is loaded, click on the map to zoom into states or select a Weather Forecast Office (WFO) from a list.
One-Month Temperature and Precipitation Outlook


Three-Month Temperature and Precipitation Outlook
The Texas Forest Service (TFS) displays the Texas Outdoor Burn Bans and Local Disaster Declarations Map as a public service. The county burn bans are established by County Judges and or County Commissioner's Courts. Click on the image below to see the current outdoor burn ban map.

|
The Texas Interagency Coordination Center (TICC) website provides the fire community with easily accessible information for daily operations. Texas Forest Service Current Situation for Wildfires NWS San Angelo has a Fire Weather Page with detailed information on fire conditions.
. |
The Climate Prediction Center's U.S. Soil Moisture Monitoring web site provides most recent day, monthly and 12 months calculated soil moisture, anomalies and percentiles. Click on the image below to go to the series of soil moisture maps.
The Climate Prediction Center also provides Topsoil Moisture Monitoring Maps and a Crop Moisture Index Map.
The United States Department of Agriculture (USDA) provides assistance for losses that result from drought. USDA's Farm Service Agency (FSA) administers and manages farm commodity, credit, conservation, disaster and loan programs as laid out by Congress through a network of federal, state and county offices.
The National Drought Mitigation Center (NDMC) produces a Vegetation Drought Response Index (VegDRI) every two weeks during the growing seasons. The VegDRI calculations integrate satellite-based observations of vegetation conditions, climate data, and other biophysical information such as land cover/land use type, soil characteristics, and ecological setting.
The NDMC also produces a new experimental tool call the Vegetation Outlook (VegOut) that provides future outlooks of general vegetation conditions. VegOut integrates climate information and satellite-based observations of current vegetation conditions with oceanic index data and other biophysical information about the environment (i.e., land cover type, irrigation status, soils, and ecological setting) to produce 1-km2 resolution maps of projected general vegetation conditions into the future.
The AgriLIFE Research & Extension Center at San Angelo provides resources to west central Texas farmers and ranchers to make agriculture more productive.
The United States Geological Survey (USGS) provides a Water Watch map of Texas to show current water resources conditions. Click on the image below to go to the USGS Texas Water Watch web page.
|
The Texas Water Development Board (TWDB) maintains a list of all major reservoirs in Texas that shows percentage full, the conservation pool elevation, the most current, and past levels extending back to 1 year ago. Texas reservoir lake levels. The Texas Commission on Environmental Quality (TCEQ) provides information on drought and impacts to water supply systems.
|
The NWS San Angelo website has a Daily River and Reservoir Summary which is updated daily. (Gage heights and pool elevations are courtesy of USGS).
|
If you have any questions or comments about this drought information web page, please contact:
National Weather Service
7654 Knickerbocker Road
San Angelo, Texas 76904
Phone: 325-944-9445
Email:nws.sanangelo@noaa.gov

