
Tropical Depression Two is expected to gradually strengthen and could bring tropical storm conditions to the Florida Panhandle beginning late Monday. Areas of flash flooding will be possible through Thursday along the eastern and central Gulf Coast. Severe thunderstorms will develop and move along a cold front crossing the Upper Midwest Monday, and through the Ohio Valley/Mid-Atlantic on Tuesday. Read More >
Weather and Climate Summary for May 2016
Temperatures averaged below normal for the month. Table 1 summarizes May 2016 temperature, precipitation, and departure from normal for Abilene and San Angelo.
.PNG)
Table 1: May Climate Data for Abilene and San Angelo.
* This was the 5th wettest May on record for Abilene, and the 7th wettest May for San Angelo. *
Additional temperature and precipitation data for Abilene and San Angelo is summarized in Table 2.
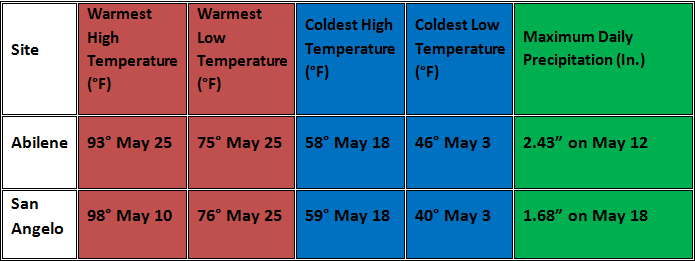
Table 2: Additional May Climate Data for Abilene and San Angelo.
The maximum daily precipitation for Abilene and San Angelo both occurred on May 17. The amounts for both locations set new respective records for maximum daily precipitation for that date. The monthly precipitation for March (Figure 1) and percent of normal precipitation for the month (Figure 2) are shown below.
Total precipitation for May ranged from 2-3 inches in patchy areas across the southern part of west-central Texas, to more than 8 inches at a few locations between Abilene, San Angelo and Brownwood.
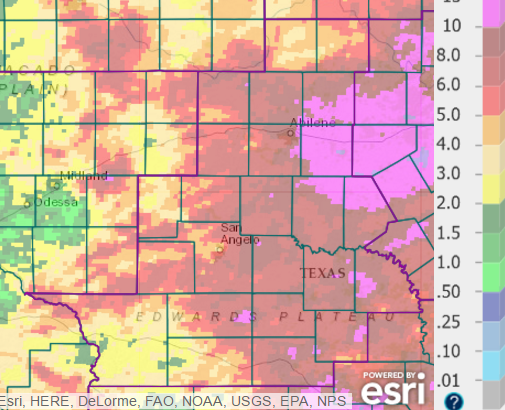
Figure 1: Total Precipitation for May.
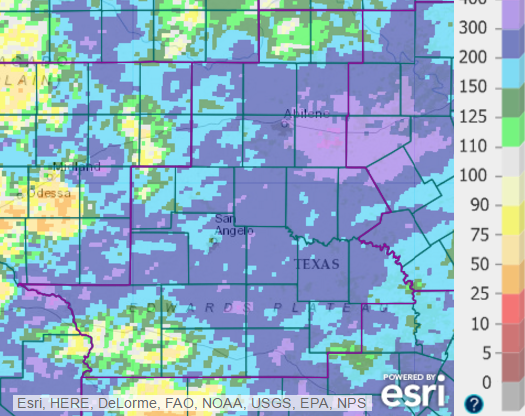
Figure 2: Percentage of Normal Precipitation for May.
The monthly precipitation was well-above normal for most of west-central Texas.
The weather pattern was rather active in May, with numerous severe weather events. Numerous thunderstorms and thunderstorm complexes produced heavy rainfall.

