Geocolor is a multispectral product composed of True Color (using a simulated green component) during the daytime, and an Infrared product that uses bands 7 and 13 at night. During the day, the imagery looks approximately as it would appear when viewed with human eyes from space. At night, the blue colors represent liquid water clouds such as fog and stratus, while gray to white indicate higher ice clouds, and the city lights come from a static database that was derived from the VIIRS Day Night Band.
View Loop (opens in new window) | More GOES East Images (opens in new window)

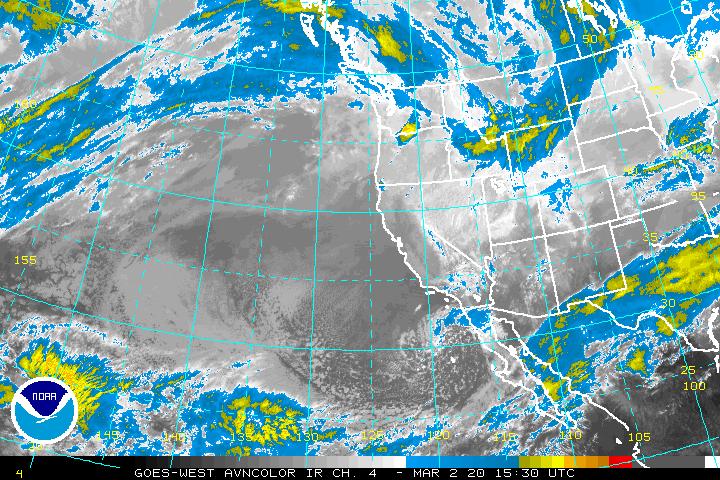
This image is taken in the infrared band of light and show relative warmth of objects. Colder objects are brighter and warmer objects are darker. Lower layers of clouds, generally warmer and lower in altitude, are colored gray. Colder and generally higher clouds tops are highlighted in colors. Infrared imagery is useful for determining cloud features both at day and night.
View Loop (opens in new window) | More GOES West Images (opens in new window)

This image is taken in the infrared band of light and show relative warmth of objects. Colder objects are brighter and warmer objects are darker. Lower layers of clouds, generally warmer and lower in altitude, are colored gray. Colder and generally higher clouds tops are highlighted in colors. Infrared imagery is useful for determining cloud features both at day and night.
View Loop (opens in new window) | More GOES East Images (opens in new window)

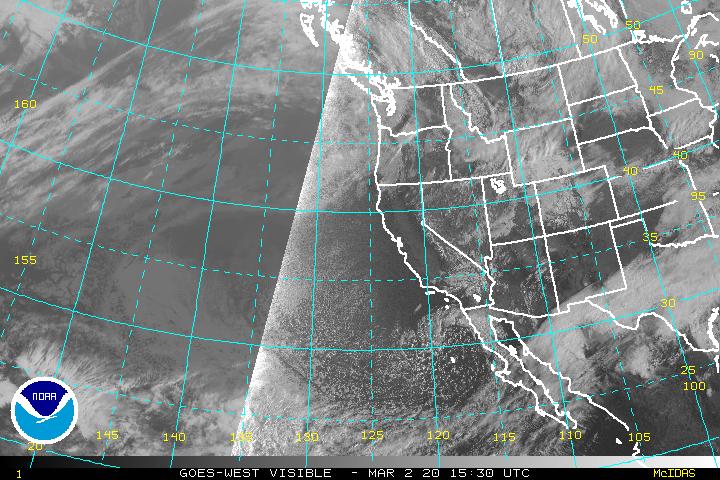
This image is taken in visible light, or how the human eye would see from the satellite. Sunrise and set can be tracked in this image.
View Loop (opens in new window) | More GOES West Images (opens in new window)

This image is taken in visible light, or how the human eye would see from the satellite. Sunrise and set can be tracked in this image.
View Loop (opens in new window) | More GOES East Images (opens in new window)

This image is taken using a wavelength sensitive to the content of water vapor in the atmosphere. Bright and colored areas indicate high water vapor (moisture) content (colored and white areas indicate the presence of both high moisture content and/or ice crystals). Black and brown areas indicate little or no moisture present. Water vapor imagery is useful for both determining locations of moisture and atmospheric circulations.
View Loop (opens in new window) | More GOES West Images (opens in new window)

This image is taken using a wavelength sensitive to the content of water vapor in the atmosphere. White and and cool-colored areas indicate high water vapor (moisture) content (green areas indicate the presence of both high moisture content and/or ice crystals). Red and yellow areas indicate little or no moisture present. Water vapor imagery is useful for both determining locations of moisture and atmospheric circulations.
View Loop (opens in new window) | More GOES East Images (opens in new window)
This infrared image of Alaska is normally updated every 30 minutes.
View Loop (opens in new window) | More Alaska Images (opens in new window)
This infrared image of Hawaii is normally updated every 30 minutes.
View Loop (opens in new window) | More Hawaii Images (opens in new window)
This infrared image of Guam is normally updated every 30 minutes.
View Loop (opens in new window) | More Hawaii Images (opens in new window)

This infrared image of the Caribbean is normally updated every 15 minutes.
View Loop (opens in new window) | More Caribbean Images (opens in new window)
This infrared image of American Samoa is normally updated every 30 minutes.