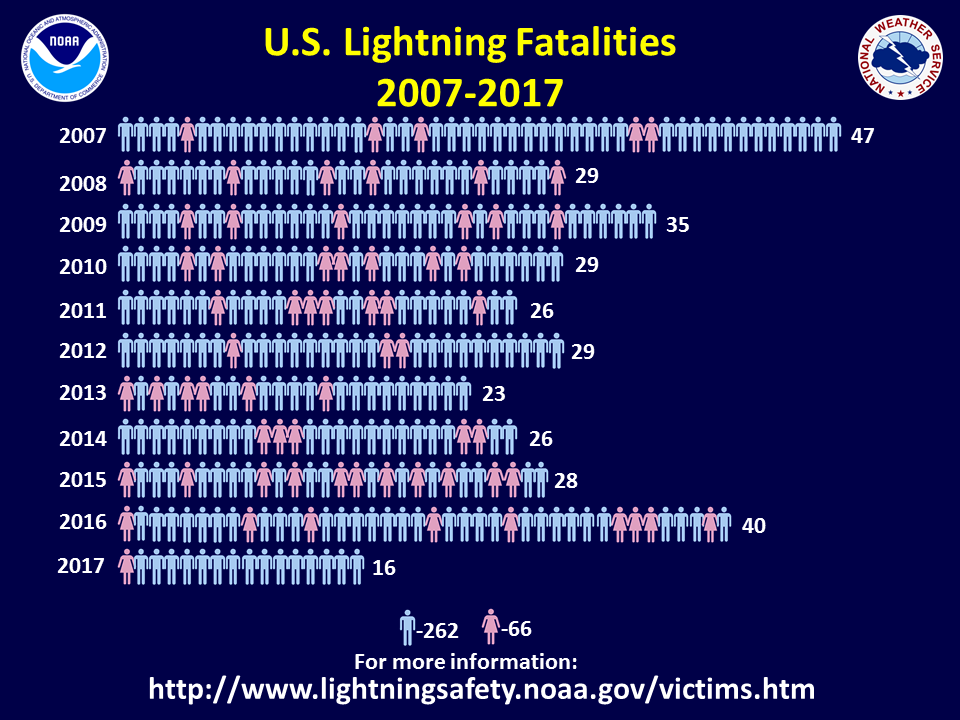
U.S. Lightning Deaths in 2017: 16 |
|||||||||
|
No. |
Date |
Day |
ST |
City |
Age |
Sex |
Location |
Activity |
Victim, linked to media story |
| 1 | 5/7 | Sun | CO | Douglas County | 37 | F | Open Field Near Tree | Riding Horse | Laura Miller |
| 2 | 5/17 | Wed | FL | Jensen Beach | 46 | M | Near pool area | Construction | Guadalupe Salinas |
| 3 | 6/27 | Tue | FL | Pembroke Pines | 34 | M | Construction site | Construction | Edwin Ramos Jarquin Armas |
| 4 | 6/29 | Thu | FL | Ft. Myers | 0 | M | Outside home | Mother walking | Owen Davidson |
| 5 | 7/3 | Mon | TX | Midland | 43 | M | Outside home | Sitting on wall | David Ortiz |
| 6 | 7/10 | Mon | FL | Baker | 35 | M | Under tree | Camping | Jeremy Harper |
| 7 | 7/11 | Tue | NC | Jacksonville, MCAS | 23 | M | Tarmac | Working on aircraft | Sylar James |
| 8 | 7/18 | Tue | NC | Sanford | 39 | M | Sheltering under tree | Walking to store | David Everette |
| 9 | 7/21 | Fri | AL | Lee County, Lake Harding | 34 | M | On lake | Boating | Toby Burrow |
| 10 | 7/26 | Wed | AL | Dothan | 16 | M | On porch under tree | Stepped onto porch | Aron Eugene Dunn |
| 11 | 7/28 | Fri | FL | Satellite Beach | 35 | M | Beach | Walking on beach | Lamar Rayfield |
| 12 | 8/2 | Wed | OH | Brewster | 82 | M | In field outside home | Dumping load of dirt | Richard Lutes |
| 13 | 8/13 | Sun | CO | Telluride | 24 | M | Mountain trail | Biking | John Daniel Huisjen |
| 14 | 8/26 | Sat | AL | Gulf Shores | 24 | M | Beach | Beach Activities | Taylor Harsh |
| 15 | 9/5 | Tue | PR | Juana Diaz | 63 | M | Boat at beach | Fishing | Roberto Collazo Porrata |
| 16 | 9/20 | Wed | TX | Friendswood | 65 | M | Golf Course | Golfing | Michael Ibarguen |
2017 Lightning Fatality Demographics |
||||||||||||||||||||
|
State |
Gender |
Age* |
Day Of Week* |
By Month |
||||||||||||||||
| AL | 3 | F | 1 (6%) | 0-9 | 1 (7%) | Sun | 2 (13%) | 2017 | 16 | 15 | 14 | 13 | 12 | 11 | 10 |
09 |
08 |
07 |
10 Yr Avg |
|
| CO | 2 | M | 15 (94%) | 10-19 | 1 (7%) | Mon | 2 (13%) | Jan |
0 |
0 |
0 |
0 |
0 |
0 |
0 |
0 |
0 |
1 |
0 |
0 |
| FL | 5 | 20-29 | 3 (20%) | Tue | 4 (25%) | Feb |
0 |
0 |
0 |
0 |
0 |
0 |
0 |
0 |
0 |
1 |
0 |
0 |
||
| NC | 2 | 30-39 | 6 (40%) | Wed | 4 (25%) | Mar |
0 |
2 |
0 |
0 |
0 |
1 |
0 |
0 |
1 |
0 |
1 |
1 |
||
| OH | 1 | 40-49 | 2 (13%) | Thu | 1 (6%) | Apr |
0 |
4 |
2 |
0 |
1 |
2 |
0 |
0 |
1 |
0 |
1 |
1 |
||
| PR | 1 | 50-59 | 0 (0%) | Fri | 2 (13%) | May |
2 |
1 |
4 |
5 |
5 |
0 |
1 |
4 |
2 |
2 |
5 |
3 |
||
| TX | 2 | 60-69 | 2 (13%) | Sat | 1 (6%) | Jun |
2 |
4 |
11 |
3 |
2 |
3 |
5 |
7 |
12 |
10 |
14 |
7 |
||
| 70-79 | 0 (0%) | Jul |
7 |
12 |
5 |
9 |
6 |
13 |
9 |
11 |
11 |
14 |
10 |
10 |
||||||
| 80-89 | 1 (6%) | Aug |
3 |
13 |
4 |
5 |
4 |
7 |
6 |
4 |
3 |
0 |
9 |
5 |
||||||
| Sep |
2 |
3 |
2 |
3 |
5 |
2 |
4 |
2 |
4 |
1 |
5 |
3 |
||||||||
| Oct |
|
0 |
|
1 |
|
1 |
1 |
1 |
1 |
0 |
2 |
1 |
||||||||
| Nov |
|
0 |
|
0 |
|
|
0 |
0 |
0 |
0 |
0 |
0 |
||||||||
| Dec |
|
1 |
|
|
|
|
0 |
0 |
0 |
0 |
0 |
0 |
||||||||
| Year | 16 |
40 |
28 |
26 |
23 |
29 |
26 |
29 |
35 | 29 | 47 |
31* |
||||||||
| *Due to rounding, percentages may not add up to 100 percent. | ** Known Fatalities to date | |||||||||||||||||||
| Note: Monthly averages are based on a 10-year average from 2007 to 2016. Due to rounding, the sum of the monthly averages may not equal the yearly average. | ||||||||||||||||||||