Last Updated: 12/17/2024. This page is updated when new information is received and reviewed for completeness.
| No. | Date | Day | ST | City/County | Age | Sex | Location | Activity |
| 1 | 3/3 | Sun | FL | Tallahassee | 73 | M | Field in park | Walking |
| 2 | 5/3 | Fri | TX | Montgomery County | 39 | M | Residence | Putting Tarp on Vehicle |
| 2 | 5/25 | Sat | CO | Jackson County | 51 | M | Open field | Branding/feeding cattle |
| 3 | 6/23 | Sun | NJ | Seaside Park | 59 | M | Beach | Warning children of storm |
| 4 | 6/27 | Thu | TX | Bryan | 7 | F | Outside home | Unknown |
| 5 | 6/28 | Fri | MO | Holden | 53 | M | Parking lot | At rodeo |
| 6 | 6/30 | Sun | FL | Davie | 19 | M | Under tree in park | Running |
| 7 | 7/20 | Sat | AL | Smiths Station | 67 | M | Flea market | |
| 8 | 7/25 | Thu | FL | St. Petersburg | 16 | F | Under tree | |
| 9 | 8/18 | Sun | UT | Bear River | 24 | M | River | Fishing |
| 10 | 8/31 | Sat | FL | Naples | 24 | M | Beach | Beach activities |
| 11 | 9/18 | Wed | FL | Pembroke Pines | 16 | M | Neighborhood | Riding bike |
(Direct Fatalities Only)
Last Updated: 12/17/2024. This page is updated when new information is received and reviewed for completeness.
|
State
|
Gender
|
Age*
|
Day Of Week*
|
By Month
|
||||||||||||||||
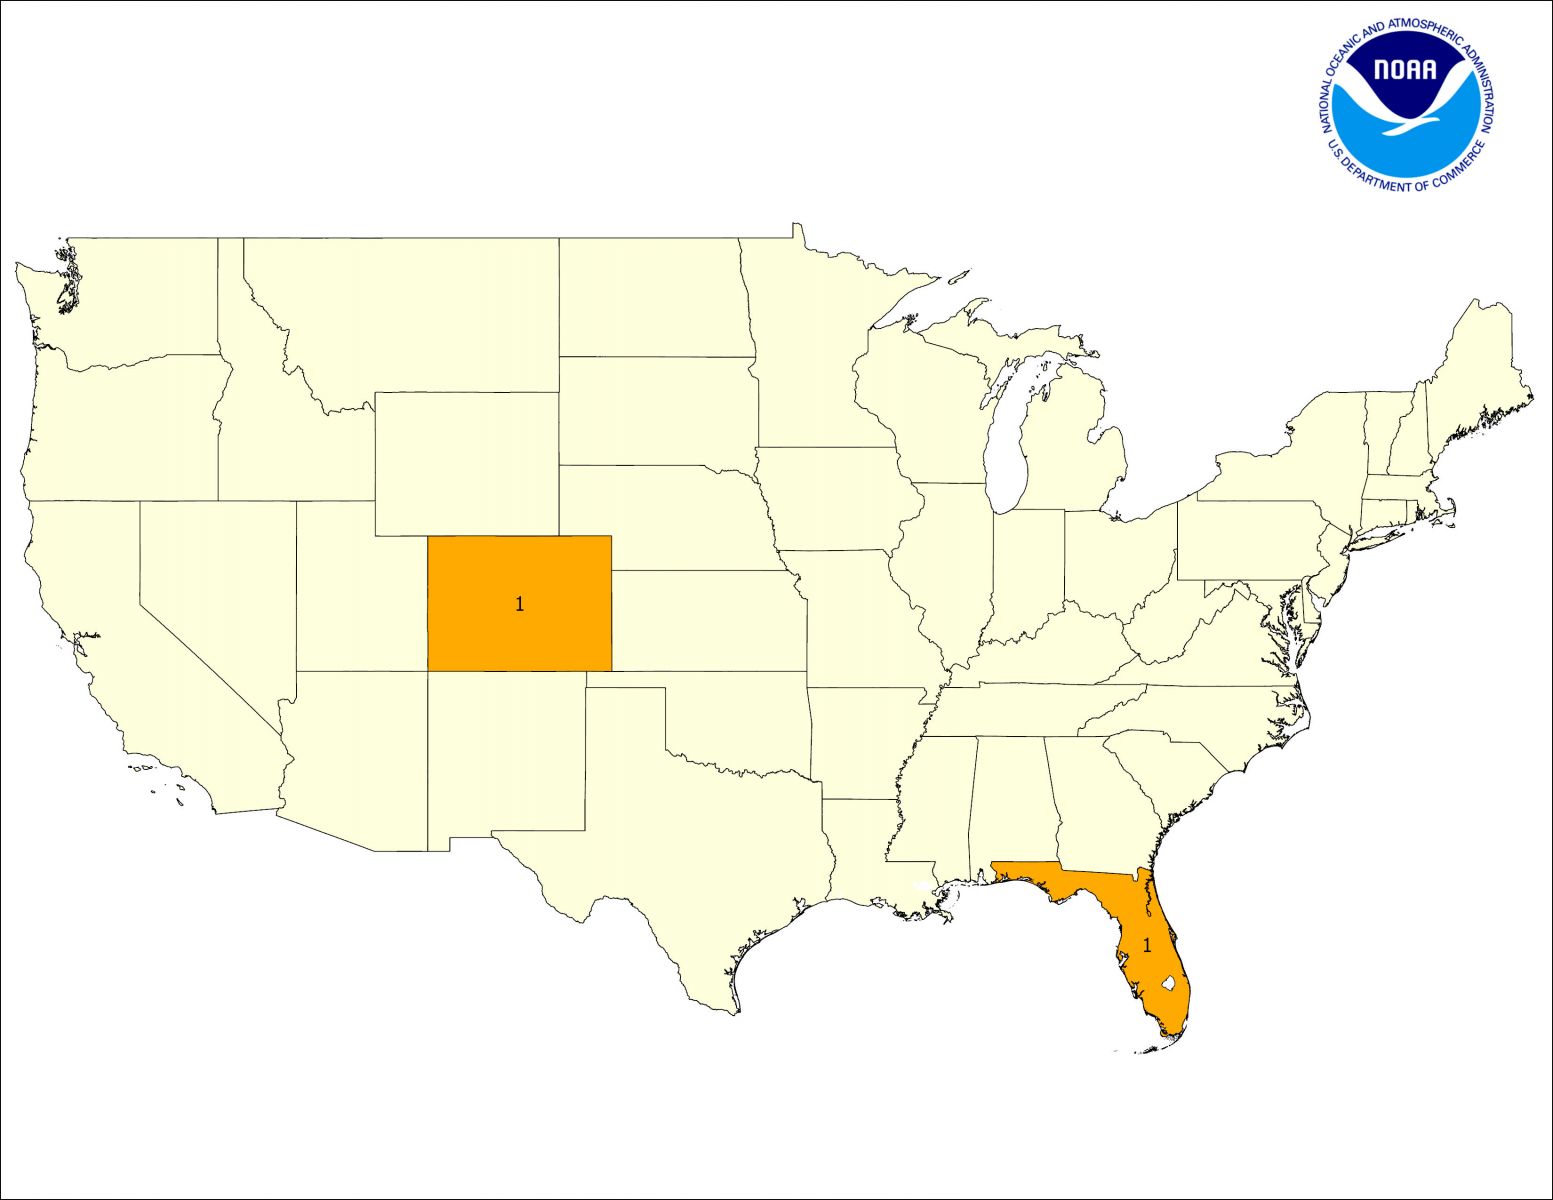
| CO | 1 | M | 10 (83%) | 0-9 | 1 (8%) | Sun | 4 (33%) | 24 | 23 | 22 | 21 | 20 | 19 | 18 | 17 | 16 | 15 | 14 |
10 Yr Avg
|
|
| FL | 5 | F | 2 (17%) | 10-19 | 3 (25%) | Mon | 0 (0%) | Jan | 0 | 0 |
0
|
0
|
0 |
0
|
0
|
0
|
0
|
0
|
0
|
0
|
| NJ | 1 | 20-29 | 2 (17%) | Tue | 0 (0%) | Feb | 0 | 0 |
0
|
0
|
0 |
0
|
1
|
0
|
0
|
0
|
0
|
0
|
||
| TX | 2 | 30-39 | 1 (8%) | Wed | 1 (8%) | Mar | 1 | 0 | 0 | 0 |
0
|
0
|
0
|
0
|
2
|
0
|
0
|
0
|
||
| MO | 1 | 40-49 | 0 (0%) | Thu | 2 (17%) | Apr | 0 | 3 | 0 | 0 |
0
|
0
|
1
|
0
|
4
|
2
|
0
|
1
|
||
| AL | 50-59 | 3 (25%) | Fri | 2 (17%) | May | 2 | 3 | 0 | 0 |
4
|
1
|
2
|
2
|
1
|
4
|
5
|
2
|
|||
| UT | 60-69 | 1 (8%) | Sat | 3 (25%) | Jun | 4 | 1 | 2 | 2 | 2 |
7
|
5
|
2
|
4
|
11
|
3
|
4
|
|||
| 70-79 | 1 (8%) | Jul | 2 | 1 | 7 | 4 | 8 |
5
|
7
|
7
|
12
|
5
|
9
|
7
|
||||||
| 80-89 | 0 (0%) | Aug | 2 | 4 | 6 | 4 | 2 |
5
|
2
|
3
|
13
|
4
|
5
|
5
|
||||||
| Sep | 1 | 1 | 4 | 1 | 1 |
3
|
2
|
2
|
3
|
2
|
3
|
3
|
||||||||
| Oct | - | 0 | 0 | 0 | 0 |
0
|
1
|
0
|
0
|
0
|
0
|
0
|
||||||||
| Nov | - | 0 | 0 |
0
|
0 |
0
|
0
|
0
|
0
|
0
|
0
|
0
|
||||||||
| Dec | - | 0 |
0
|
0 |
0
|
0
|
0
|
0
|
1
|
0
|
0
|
0
|
||||||||
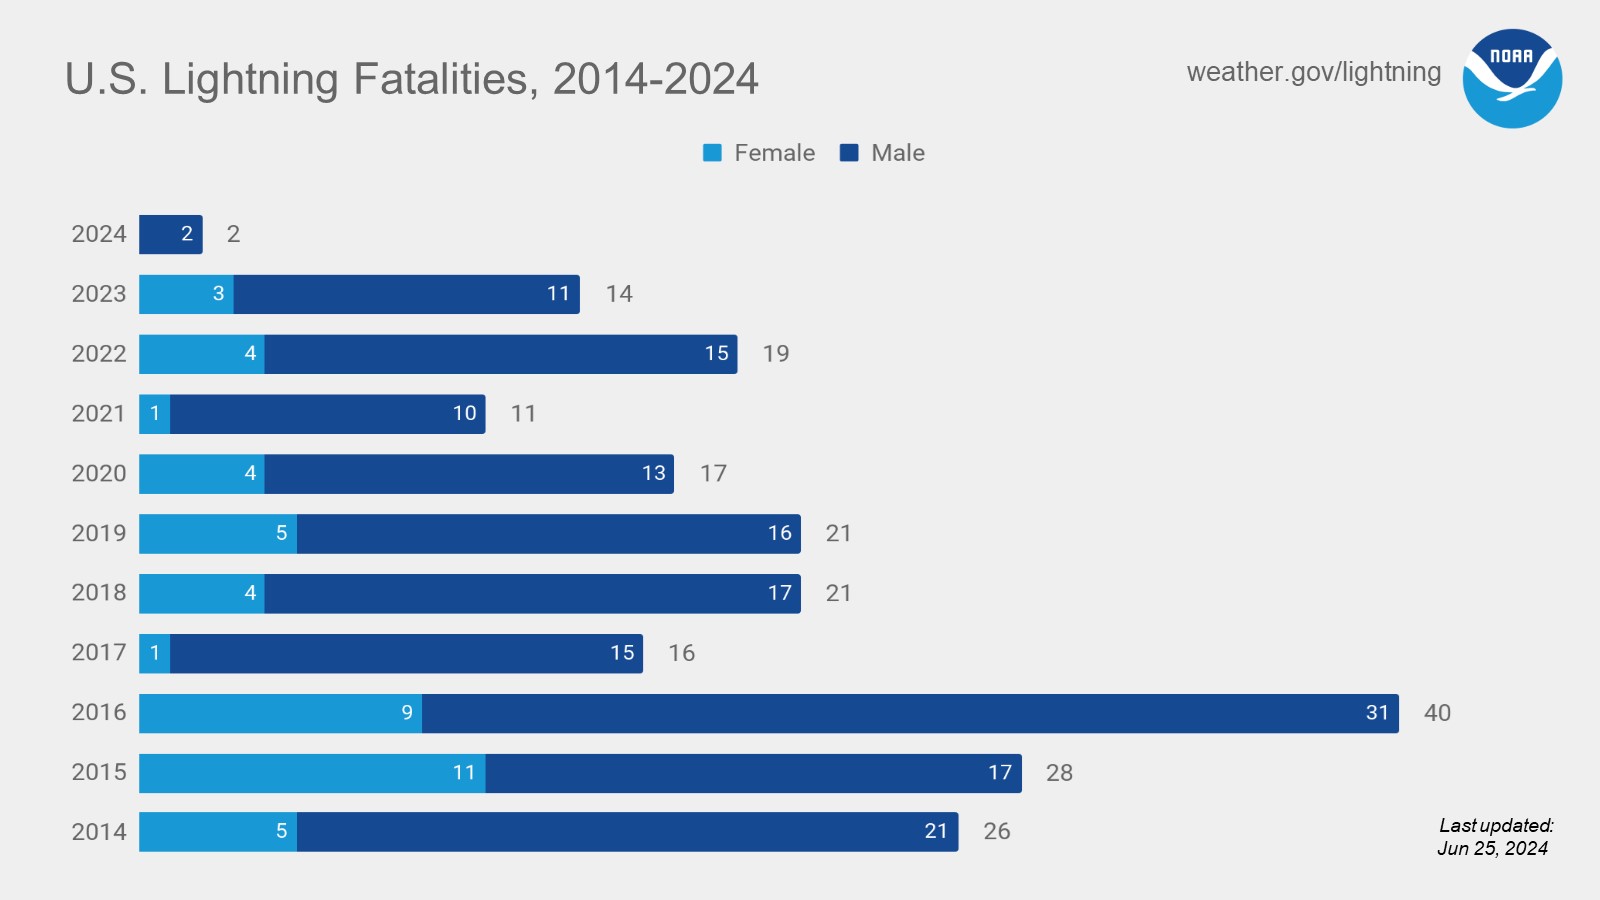
| Year | 11 | 14 | 19 | 11 | 17 |
21
|
21
|
16
|
40
|
28
|
26
|
21**
|
||||||||
| *Due to rounding, percentages may not add up to 100 percent. | ** Note: Data are considered preliminary. Refer to Storm Data for official data. | |||||||||||||||||||
|
Note: Monthly averages are based on a 10-year average from 2013 to 2022. Due to rounding, the sum of the monthly averages may not equal the yearly average. |
||||||||||||||||||||