
On this page you learn what types of flooding are typical in Oklahoma and how do you protect yourself, your family and your home. You will also find out more about significant Oklahoma floods. Finally, you'll find links to NWS offices that provide forecast and safety information for Oklahoma, as well as links to our partners who play a significant role in keeping you safe.
Heavy rains during the last two weeks of September 1986 left the ground across Oklahoma saturated. Then, four main weather features combined to produce heavy rain and flooding during the first four days of October:
Rainfall amounts of 6-10 inches were common, with 15-20 inches falling across the north central and northeast part of Oklahoma. Hardy, in Kay County, recorded 21.79 inches for the maximum amount. This heavy rainfall over previously saturated land caused tremendous runoff, which in turn caused major rivers and all streams and creeks to flood. The Arkansas, Caney, Canadian, South Canadian, Cimarron, Washita, Salt Fork, Neosho, Verdigris Rivers, and the North Fork of the Red River set or nearly set record high crests. This event set new record high flood levels at 7 stream gaging sites.
Approximately 30,000 people had to be evacuated from about 25 towns. Half of these evacuations were in Bartlesville. All residents of Webbers Falls, Jenks, and Bixby were ordered to evacuate. Two lives were lost during this flood. A total of 509 residences were destroyed, and 3,957 were damaged. Many roads and bridges were washed out, including two bridges on Interstate 35. A total of 52 of the 77 counties in Oklahoma suffered some type of flood damage. There were 33 counties, the cities of Norman and Shawnee, and 10 counties in Kansas declared flood disaster areas. Damages were estimated at $350 million ($748 million in 2013), half of which was from agriculture (all damage figures are in 1986 dollars).
In Tulsa, a private westbank levee failed, causing $1.3 million in damages to 64 buildings, including the Garden City neighborhood. Tulsa County damages were estimated at $63.5 million ($32.5 million in Sand Springs; $13.4 million in Bixby). Washington County had $39.7 million in damages ($37.2 million from the Caney River in Bartlesville).
The U.S. Army Corps of Engineers (USACE) has a system of flood control structures throughout the Arkansas River Basin; 7 of the 11 lakes in the system completely filled or exceeded their flood control storage capacity. Hulah Lake, upstream of Bartlesville, exceeded its surcharge. This event was the first serious Arkansas River flood at Tulsa since Keystone Dam was completed in 1964. The USACE had to release 310,000 cubic feet per second (cfs) of water out of Keystone Dam. As of October 2013, this flood remains the highest (25.21 ft. and 307,000 cfs on 10/05/1986) along the Arkansas River at Tulsa. This flood also holds the record along the Caney River at Bartlesville (27.70 ft. and 94,500 cfs on 10/04/1986). In addition, this flood ranks the highest on the Cimarron River near Dover (26.10 ft. and 123,000 cfs on 10/04/1986), near Guthrie (25.71 ft. and 116,000 cfs on 10/04/1986), and near Perkins (26.75 ft. and 162,000 cfs on 10/04/1986).
As of October 2013, this flood ranks as the second highest crest on record for the following locations: Caney River near Ramona and near Collinsville, Arkansas River near Haskell and near Muskogee, Polecat Creek near Jenks, Kingfisher Creek at Kingfisher, Elk Creek near Hobart, the North Canadian River near Watonga, the Salt Fork of the Red River at Mangum, and two sites on the North Fork of the Red River near Headrick and Tipton. At the time, this was the second worst flood in the City of Miami’s history (as of October 2013, the 1986 flood is the 3rd highest).
This event summary includes information from the National Weather Service, City of Tulsa, and U.S. Army Corps of Engineers Tulsa District.
 |
 |
| From the local records of the NWS Norman Forecast Office | Storm total rainfall map of Hurricane Paine during September and October 1986. David Roth, NOAA, NWS, Weather Prediction Center, Camp Springs, Maryland |
 |
| Sandbagging on Riverside Dr. in Tulsa, OK 1986. Image from “From Harm’s Way: Flood-hazard mitigation in Tulsa, Oklahoma” |
Learn More:
May 1943 was the wettest May on record in Oklahoma at the time. The all-time record for the eastern section was broken with an average of 14.26 inches of rain. Miami, OK, had a monthly total of 23.95 inches. The rains resulted in the most severe floods in the history of Oklahoma in the counties along the Arkansas River and in the smaller streams of eastern Oklahoma. Damage estimates were not available, but were heavy.
Heavy rains first occurred from May 7-11, with most of the eastern Oklahoma stations reporting more than 5 inches of rain and many reporting more than 10 inches, such as McAlester, 12.99 inches. A second round of heavy rain occurred over the same area from May 16-20. Most stations in eastern Oklahoma again reported over 5 inches, with several reporting over 10 inches. Ralston’s total was 13.10 inches.
There was considerable infiltration during the first storm, but most of the streams were still running high when the second storm began, resulting in the heaviest flood on record in eastern Oklahoma. There were 26 lives were lost during this event. Considerable erosion was reported in the areas having the heavier rains.
Preliminary aggregate estimate of damage along the North Canadian and Canadian Rivers was $887,000, ($339,600 on the Canadian River and $547,400 on the North Canadian River. All damages in 1943 dollars). For the Canadian River, the damage to tangible property was about $115,000, matured crops $5,000, prospective crops on 21,000 acres about $210,500, livestock, etc., $7,100, and suspension of business, $2,000.
For the North Canadian River, the damage estimated on tangible property was $199,100, matured crops $6,900, prospective crops on 22,200 acres $290,400, livestock, etc., $32,000, and suspended business $19,000.
Most of the damage along the North Canadian and Canadian Rivers, above their intersection with the Arkansas River, was in McIntosh County, where the estimated damage was $653,000, or about 75 percent of the total estimated damage. An estimate of money value of property saved by flood warnings was about $20,500. U.S. Army Corps of Engineer flood control structures were not in place at this time.
The Arkansas River at Fort Smith, AR (at the Oklahoma-Arkansas border) crested at 41.8 ft., the highest stage on record at the time. The river reached flood stage on May 10 and did not go below flood stage at Pine Bluff, AR until June 4. The Official in Charge at the Fort Smith River district, which includes much of Oklahoma, advised that total damage from flood conditions during May in that district "will probably run into twenty to $30 million," and that the report for his district has been delayed because of difficulty in obtaining loss figures from some of the corporations which sustained the greatest losses.
As of October 2013, this event is the flood of record for the following locations:
Polecat Creek near Sapulpa, (33.70 ft. on 5/10/1943)
Deep Fork River near Beggs, (34.55 ft. on 5/11/1943)
Caney River near Collinsville, (39.80 ft. on 5/21/1943)
Caney River near Ramona, (39.80 ft. on 5/21/1943)
Verdigris River near Inola, (54.93 ft. on 5/21/1943)
Arkansas River near Muskogee, (48.20 ft. on 5/21/1943)
As of October 2013, May 1943 is the second highest flood on record for the following locations:
Poteau River near Poteau, (37.00 ft. on 5/11/1943)
Spring River near Quapaw, (43.40 ft. on 5/19/1943)
Black Bear Creek at Pawnee, (28.19 ft. on 5/19/1943)
Bird Creek near Sperry, (31.68 ft. on 5/18/1943)
Bird Creek near Owasso, (31.50 ft. on 5/23/1943)
Verdigris River near Lenapah, (40.44 ft. on 5/20/1943)
 |
 |
| Arkansas River when it flooded Webbers Falls in 1943. Picture posted by Shirley Walters Bryant on July 06 | John Horn standing in the water. Flood of 1943. Picture posted by Webbers Falls on Dec. 12 2010. |
 |
 |
| Webbers Falls bridge Flood of 1943. Picture posted by George Miller on Feb 28 2011 | Arkansas River Historical Society Photographs from the Joseph Howell Collection and other Museum archives. |
 |
| From Harm’s Way: Flood-hazard mitigation in Tulsa, Oklahoma |
Learn More:
The 1984 Memorial Day Flood was the worst flood event in the city’s history. It was caused by a 6-15 inches deluge from a stalled cold front, affecting the Tulsa metropolitan area and centered near McClure Park. All of this rain fell during an 8-hour period from 8:30 pm May 26 to 4:30 am May 27, 1984. The entire Mingo Creek basin received at least 9 inches of rain during this event. There were 14 fatalities, 6 of which were auto related, and 288 injuries. More than 5,500 buildings were damaged or destroyed, including more than 20 schools. There were 7,000 vehicles destroyed or severely damaged, and many roads and bridges also were destroyed or heavily damaged. The damages were set at $180 million ($406 million in 2013 dollars). Mingo Creek alone accounted for $125 million of the damages. President Ronald Reagan issued a major-disaster declaration for this event.
Rainfall during this event was recorded by the National Weather Service at the Tulsa International Airport and at 15 rain gages throughout the city operated by the Tulsa City Engineering Department. Rainfall depths from these gages exceeded the 1 percent annual chance recurrence interval for durations of 1 to 8 hours throughout much of the metro area. Peak flood discharges were also greater than the 1 percent annual chance recurrence interval at 7 out of 9 sites measured. The peak unit discharge computed for Mill Creek in McClure Park exceeds any known unit discharge in Oklahoma (as of 1988). Measured rainfall totals ranged from 3.4 inches in southwest Tulsa to more than 12 inches at 3 locations in the east-central section of the city, and several unofficial reports of as much as 15 inches were plausible.
Mingo Creek in its unimproved reaches, particularly its tributaries, sustained the most concentrated devastation. Others creeks recording major flooding included Flatrock Creek and its tributaries Dirty Butter, Coal, Little Joe, and upper Haikey in eastern and southeastern Tulsa County.
In West Tulsa, Blackboy and Harlow Creeks overflowed levees into residential and business areas, and at their confluence and entry to a common structure under the Arkansas River levee, there was major damage to the structure and levee. Bird Creek saw minor flooding above the Sperry gage because it was fed in its Owasso to Catoosa reach primarily from flood inflows beginning with Flatrock Creek. Its major contributor was the Mingo Creek drainage basin. Some 56 homes in Catoosa were flooded by the Bird Creek rise, probably reinforced by Spunky Creek.
This flood came on the heels of numerous floods in Tulsa during the 1960s and 1970s. As a result, the Tulsa mayor and street commissioner assembled the city's first Flood Hazard Mitigation Team, and a new approach to Tulsa flood response and recovery was developed. As ultimately completed, the program included relocation of 300 flooded homes and a 228-pad mobile home park, $10.5 million in flood control works, and $2.1 million for master drainage plans. The total capital program topped $30 million, mostly from local capital sources, flood insurance claim checks, and federal funds.
The work didn't end with the initial flood response and recovery. In fact, it was only the first step in a long and continuing journey to make Tulsa flood safe. The 1984 flood also persuaded Tulsans that a coordinated, comprehensive stormwater management program was needed. In 1985, the Department of Stormwater Management centralized responsibility for all city flood, drainage, and stormwater programs. A stormwater utility fee was established by ordinance in 1986 to operate the program. The utility fee ensures stable funds for maintenance and management. The ordinance allots the entire fee exclusively for floodplain and stormwater management activities. In the early 1990s, FEMA ranked Tulsa first in the nation for its floodplain management program, allowing Tulsans to enjoy the nation's lowest flood insurance rates.
This event summary includes information from the National Weather Service, City of Tulsa, and U.S. Geological Survey.
 |
 |
| Looking east toward downtown: Tulsa’s 1984 flood. From Harm’s Way: Flood-hazard mitigation in Tulsa, Oklahoma | On the Mingo Creek tributary called Cooley, the 1984 flood ripped units from these apartments and tossed cars like toys. In this photo, taken as water recedes the morning after the 1984 Memorial Day flood, neighbors wade toward the cars to check for bodies. This photo was taken upstream from Holiday Mobile Home Park, another center of treacherous problems during the flood. From Harm’s Way: Flood-hazard mitigation in Tulsa, Oklahoma) |
 |
| From Harm’s Way: Flood-hazard mitigation in Tulsa, Oklahoma |
Learn More:
According to the USGS, the May 16-21, 1957, flooding event is among the most widespread and severe to be documented in Oklahoma during the 20th century. Heavy to severe thunderstorms and rainfall occurred over southern Kansas, Oklahoma, and Arkansas during the latter half of May 1957, and caused severe to record flooding in along many streams, creeks and rivers within the region. Record flooding occurred along parts of the Cimarron, Arkansas, and Canadian Rivers.
The flooding produced a total of $20 million in losses to agriculture. Heavy runoff into Lake Texoma produced extreme rises in the elevation of the lake, and caused the emergency spillway to be opened for first time since the reservoir's completion in 1943. In the lower Washita River basin, nearly 80,000 acres of agricultural land were inundated. In the Red River basin downstream from Denison Dam at Lake Texoma, nearly 200,000 acres were inundated by the. The floods also marked the end of persistent drought in Oklahoma that had begun in 1952.
A predominant feature of the mid-May 1957 storms was the unusual recurrence of flood-producing precipitation over a 2-week period. Precipitation fell almost every day over much of Oklahoma. The mid-May event was part of an extremely wet period from April-June 1957 when multiple rounds of rainfall and flooding occurred.
In Oklahoma, monthly precipitation for May exceeded the long-term means with many rainfall reporting stations receiving more than twice the mean. Precipitation at Hennessey, OK was 5 times the long-term monthly mean! In general, this month was the wettest May of record at the time for many stations.
 |
 |
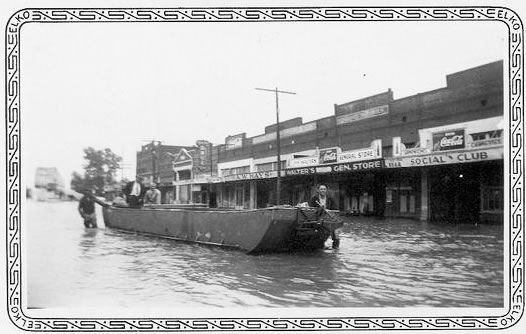
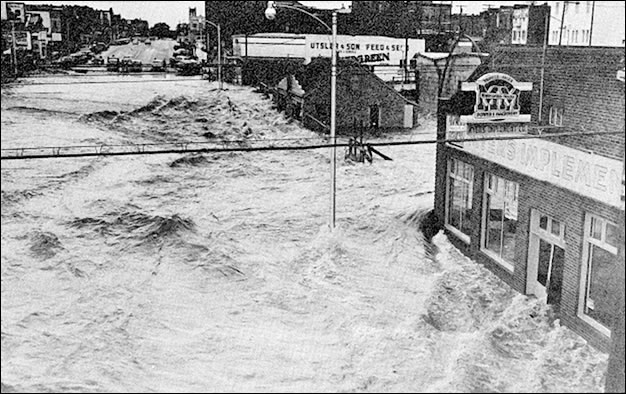
| Flooding on the Boggy Creek at Enid, OK (East Main Street) on May 16, 1957. (Photo was provided courtesy of the Enid Publishing Co. and is from USWB Technical Paper No. 3, p. 63.) | Flooding on the Turkey Creek at Dover, OK on May 16, 1957. Town inundated except for a small area to which the population was evacuated. (Photo was provided courtesy of the Oklahoma Times and is from USWB Technical Paper No. 3, p. 64.) |
 |
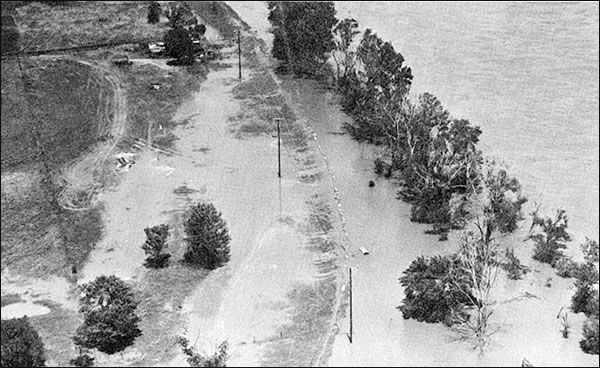 |
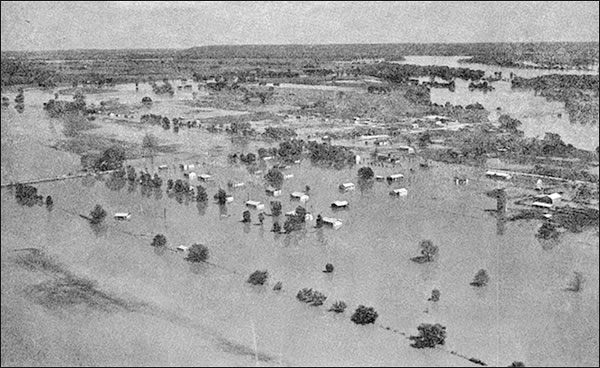
| Flooding on the Arkansas River at Bixby, OK on May 20, 1957. (From USWB Technical Paper No. 3, p. 65.) | Flooding on the Arkansas River at Tulsa, OK, near 41st Street on May 21, 1957. Note the floodwaters over low levee on west side of the Arkansas River near Garden City. (From USWB Technical Paper No. 3, p. 65.) |
 |
| Location map for precipitation stations in Oklahoma with isohyets of total precipitation for May 1957. (From USWB Technical Paper No. 3, p. 192.) |
Learn More:
|
||||||


