Lake effect snow will impact the Great Lakes region through the day. Gusty winds will pick up across the Midwest, Northeast and Mid-Atlantic beginning this afternoon following a cold front. Elevated fire weather conditions will persist across the Desert Southwest today, with critical fire weather conditions developing Wednesday and Thursday in the Southern Plains. Read More >
Central and Western Wyoming Climate Summaries
| 2022 Annual |
2021 Annual |
|
2023 Climate Summaries
Top 5 Events of 2023 (video presentations):
| Number 5: The Thanksgiving Weekend Snowstorm | Number 4: June 23rd Severe Weather Outbreak |
And the numbers One through Three events of 2023 was...
| Number 1: A Winter to Remember |

...Highlights of 2023...

| Element | Jan | Feb | Mar | Apr | May | Jun | Jul | Aug | Sep | Oct | Nov | Dec | Year |
| Average High | 22.9 | 38.2 | 49.8 | 59.8 | 65.7 | 84.8 | 88.7 | 86.2 | 81.0 | 66.2 | 44.8 | 41.8 | 60.8 |
| Mean High (1991-2020 Normals) | 28.7 | 35.5 | 49.2 | 58 | 67.4 | 78.9 | 87.9 | 85.7 | 74.4 | 59.2 | 42.7 | 29.6 | 58.1 |
| Average Low | 0.7 | 15.6 | 24.8 | 32.8 | 38.0 | 51.4 | 53.7 | 53.0 | 44.9 | 35.1 | 19.3 | 5.7 | 31.3 |
| Mean Low (1991-2020 Normals) | 4.2 | 9.6 | 22.2 | 30.5 | 40.3 | 48.5 | 54.8 | 52.2 | 42.5 | 30.4 | 17.1 | 5.7 | 29.8 |
| Average Temperature | 11.8 | 26.9 | 37.3 | 46.3 | 51.9 | 68.1 | 71.2 | 69.6 | 63.0 | 50.6 | 32.0 | 28.4 | 46.4 |
| Mean Average Temperature (1991-2020 Normals) | 16.4 | 22.5 | 35.7 | 44.2 | 53.8 | 63.7 | 71.3 | 69 | 58.4 | 44.8 | 29.9 | 17.6 | 43.9 |
| Departure from Normal | -4.6 | 4.4 | 1.6 | 2.1 | -1.9 | 4.4 | -0.1 | 0.6 | 4.6 | 5.8 | 2.1 | 10.8 | 2.5 |
| Rank: Coldest to Warmest 106 years of record (P.O.R 12/1918-2024) |
30 | 78 | 85 | 77 | 28 | 95 | 62 | 75 | 102 | 102 | 76 | 100 | 96 |
| Highest Daily Maximum | 40 | 55 | 64 | 77 | 83 | 96 | 100 | 98 | 92 | 94 | 62 | 53 | 100 |
| Date of Occurrence | 30 | 26 | 19 | 15 | 29 | 24 | 12 | 4 | 3 | 5 | 12 | 23 | 7/12 |
| Lowest Daily Minimum | -30 | -12 | 13 | 22 | 25 | 38 | 44 | 41 | 35 | 18 | 7 | 7 | -30 |
| Date of Occurrence | 16 | 17 | 5 | 21 | 2 | 19 | 4 | 30 | 22 | 31 | 29 | 10,16 | 1/16 |
| Number of Days with: | |||||||||||||
| Maximum >= 90° | 0 | 0 | 0 | 0 | 0 | 9 | 15 | 11 | 4 | 0 | 0 | 0 | 39 |
| Maximum <= 32° | 23 | 7 | 0 | 0 | 0 | 0 | 0 | 0 | 0 | 0 | 1 | 1 | 32 |
| Minimum <= 32° | 31 | 29 | 31 | 15 | 7 | 0 | 0 | 0 | 0 | 13 | 30 | 31 | 187 |
| Minimum <= 0° | 8 | 2 | 0 | 0 | 0 | 0 | 0 | 0 | 0 | 0 | 0 | 0 | 10 |
| Record Highs Set or Tied | 0 | 0 | 0 | 0 | 0 | 0 | 0 | 0 | 2 | 0 | 0 | 0 | 2 |
| Record Lows Set or Tied | 1 | 0 | 0 | 0 | 1 | 0 | 0 | 0 | 0 | 0 | 0 | 0 | 2 |
| * Multiple day occurrence | |||||||||||||
Temperature Ranks and Records:
Daily Records:
Max:
September: 91 on the 29th and 91 on the 30th.
Min:
January: -35 on the 30th
May: 29 on the 24th (tie)
| Top Ten Warmest June's on Record | |||||||
| Rank | Year | Average Temperature °F | |||||
| 1 | 1988 | 72.2 | |||||
| 2 | 2021 | 70.2 | |||||
| 3 | 1977 | 69.3 | |||||
| 4 | 2016 | 68.9 | |||||
| 5 | 2006 | 68.8 | |||||
| 6 | 2012 | 68.5 | |||||
| 7 | 2015 | 68.4 | |||||
| 8 | 1933 | 68.2 | |||||
| 9 | 2024 | 68.1 | |||||
| 10 | 2013 | 67.6 | |||||
| Top Ten Warmest September's on Record | |||||||
| Rank | Year | Average Temperature °F | |||||
| 1 | 2015 | 63.6 | |||||
| 2 | 1998 | 63.5 | |||||
| 3 | 1990 | 63.4 | |||||
| 4 | 2024 | 63.0 | |||||
| 5 | 2022 | 62.9 | |||||
| 6 | 2009/2001 | 62.3 | |||||
| 8 | 1938 | 62.2 | |||||
| 9 | 1948 | 62.1 | |||||
| 10 | 1940 | 62.0 | |||||
| Top Ten Warmest October's on Record | |||||||
| Rank | Year | Average Temperature °F | |||||
| 1 | 1963 | 52.0 | |||||
| 2 | 2015 | 51.7 | |||||
| 3 | 2010 | 50.9 | |||||
| 4 | 2003 | 50.7 | |||||
| 5 | 2024 | 50.6 | |||||
| 6 | 2014 | 50.4 | |||||
| 7 | 1988 | 50.0 | |||||
| 8 | 1934 | 49.6 | |||||
| 9 | 1933 | 49.4 | |||||
| 10 | 2011 | 49.2 | |||||
| Top Ten Warmest December's on Record | |||||||
| Rank | Year | Average Temperature °F | |||||
| 1 | 1933 | 31.8 | |||||
| 2 | 2021 | 30.4 | |||||
| 3 | 1950 | 29.2 | |||||
| 4 | 1980 | 29.0 | |||||
| 5 | 2024 | 28.4 | |||||
| 6 | 1957/1946 | 27.7 | |||||
| 8 | 1999 | 27.3 | |||||
| 9 | 1939 | 27.2 | |||||
| 10 | 1929 | 26.5 | |||||
| Warmest Years on Record (100 Years) | |||||||
| Rank | Year | Average Temperature °F | |||||
| 1 | 2012 | 48.5 | |||||
| 2 | 2021 | 47.1 | |||||
| 3 | 2006, 1999 | 47.0 | |||||
| 5 | 1934 | 46.9 | |||||
| 6 | 2007 | 46.5 | |||||
| 7 | 2024 | 46.4 | |||||
| 7 | 2005, 1981 | 46.3 | |||||
| 9 | 1954 | 46.2 | |||||
| 10 | 2015 | 45.9 | |||||
| Top Ten Coldest Years on Record | |||||||
| Rank | Year | Average Temperature °F | |||||
| 1 | 1993 | 38.8 | |||||
| 2 | 1924 | 39.5 | |||||
| 3 | 1984, 1944 | 39.7 | |||||
| 5 | 1978 | 40.1 | |||||
| 6 | 1985 | 40.3 | |||||
| 7 | 1968, 1929 | 40.5 | |||||
| 9 | 1975 | 40.8 | |||||
| 10 | 1986, 1932 | 41.0 | |||||
| 96 | 2024 | 46.4 | |||||
 |
 |
| Average Annual Temperature for Period of Record - Click on Graph to Enlarge | |
 |
Learn more about the National Weather Service's efforts to build a Weather-Ready Nation! |

| Element | Jan | Feb | Mar | Apr | May | Jun | Jul | Aug | Sep | Oct | Nov | Dec | Year |
| Total (inches) | 0.35 | 1.07 | 0.36 | 0.73 | 1.68 | 0.96 | 0.14 | 0.40 | 0.08 | 0.60 | 0.24 | 0.05 | 6.66 |
| Mean Precipitation (1991-2020 Normals) |
0.35 | 0.43 | 0.71 | 1.31 | 1.98 | 1.09 | 0.70 | 0.45 | 0.80 | 0.93 | 0.44 | 0.31 | 9.5 |
| Departure from Normal | 0 | 0.64 | -0.35 | -0.58 | -0.30 | -0.13 | -0.56 | -0.05 | -0.72 | -0.33 | -0.20 | -0.26 | -2.84 |
| Percent of Normal | 100 | 249 | 51 | 56 | 85 | 88 | 20 | 89 | 10 | 65 | 55 | 16 | 70 |
|
Rank - Driest to Wettest |
81 | 102 | 52 | 37 | 56 | 54 | 21 | 58 | 14 | 52 | 41 | 23 | 19 |
 |
|||||||||||||
| Greatest 24-HR Total | 0.19 | 0.56 | 0.16 | 0.27 | 0.44 | 0.91 | 0.06 | 0.26 | 0.03 | 0.31 | 0.23 | 0.05 | 0.91 |
| Dates of Occurrence | 11 | 4 | 14 | 1 | 6 | 21 | 21 | 27 | 4 | 30 | 13 | 31 | 6/21 |
| Number of Days with: | |||||||||||||
| Precipitation >= 0.01 | 5 | 8 | 6 | 7 | 10 | 3 | 5 | 5 | 3 | 6 | 2 | 1 | 61 |
| Precipitation >= 0.10 | 2 | 3 | 2 | 2 | 5 | 1 | 0 | 1 | 0 | 2 | 1 | 0 | 19 |
| Precipitation >= 1.00 | 0 | 0 | 0 | 0 | 0 | 0 | 0 | 0 | 0 | 0 | 0 | 0 | 0 |
| Daily Precipitation Records Set or Tied | 1 | 0 | 0 | 0 | 0 | 0 | 0 | 0 | 0 | 0 | 0 | 0 | 1 |
One Day Precipitation Records:
January: 0.10." on the 13th.
| Top Ten Wettest Months of February on Record | |||||||
| Rank | Year | Precipitation (inches) | |||||
| 1 | 2004 | 1.33 | |||||
| 2 | 2015 | 1.28 | |||||
| 3 | 2003 | 1.15 | |||||
| 4 | 2024 | 1.07 | |||||
| 5 | 2020 | 0.98 | |||||
| 6 | 1986 | 0.97 | |||||
| 7 | 2017 | 0.96 | |||||
| 8 | 1955 | 0.90 | |||||
| 9 | 1935 | 0.86 | |||||
| 10 | 1920 | 0.80 | |||||
| Top Ten Driest Years on Record | |||||||
| Rank | Year | Precipitation (inches) | |||||
| 1 | 1988 | 3.75 | |||||
| 2 | 2012 | 3.98 | |||||
| 3 | 1974 | 4.12 | |||||
| 4 | 1954 | 4.85 | |||||
| 5 | 2001, 2006 | 5.07 | |||||
| 7 | 2020 | 5.62 | |||||
| 8 | 1966 | 5.66 | |||||
| 9 | 1990 | 5.71 | |||||
| 10 | 1922 | 5.91 | |||||
| 19 | 2 | 15.51 | |||||
| Top Ten Wettest Years on Record | |||||||
| Rank | Year | Precipitation (inches) | |||||
| 1 | 1923 | 18.43 | |||||
| 2 | 2017 | 15.86 | |||||
| 3 | 2023 | 15.51 | |||||
| 4 | 2016 | 15.24 | |||||
| 5 | 1941 | 14.74 | |||||
| 6 | 1912 | 14.73 | |||||
| 7 | 1993 | 13.49 | |||||
| 8 | 1998, 1995 | 13.41 | |||||
| 10 | 1971 | 13.11 | |||||
| 89 | 2024 | 6.66 | |||||
 |
 |
| Annual Precipitation for Period of Record - Click on Graph to Enlarge | |
 |
|
| Click on Graph to Enlarge | |
|
Learn more about the National Weather Service's efforts to build a Weather-Ready Nation! |

| Element | Jan | Feb | Mar | Apr | May | Jun | Jul | Aug | Sep | Oct | Nov | Dec | Year |
| Total (inches) | 5 | 10 | 4.9 | 4.2 | 1.7 | 0 | 0 | 0 | 0 | 3.1 | 0.5 | 1 | 30.4 |
| Mean Snowfall (1991-2020 Normals) | 5.5 | 7.4 | 6.5 | 7.2 | 2.1 | 0.0 | 0.0 | 0.0 | 0.6 | 4.4 | 5.3 | 5.3 | 44.3 |
| Departure from Normal | -0.5 | 2.6 | -1.6 | -3.0 | -0.4 | 0.0 | 0.0 | 0.0 | -0.6 | -1.3 | -4.8 | -4.3 | -13.9 |
| Percent of Normal | 91 | 135 | 75 | 58 | 81 | 0 | 0 | 0 | 0 | 7 | 9 | 19 | 69 |
| Rank - Least to Most 106 years (P.O.R 1918-2024) |
71 | 87 | 52 | 59 | 82 | NA | NA | NA | NA | 66 | 27 | 25 | 46 |
|
|||||||||||||
| Greatest 24-HR Total | 2.3 | 3.2 | 2.3 | 2.8 | 0.9 | 0 | 0 | 0 | 0 | 3.1 | 0.4 | 1.0 | 3.2 |
| Dates of Occurrence | 11 | 10 | 14 | 1 | 3 | 0 | 0 | 0 | 0 | 30 | 13 | 31 | 2/10 |
| Number of Days with: | |||||||||||||
| Snowfall >= 1.0 inch | 2 | 4 | 2 | 1 | 0 | 0 | 0 | 0 | 0 | 1 | 0 | 1 | 11 |
| Daily Snowfall Records Set or Tied | 0 | 0 | 0 | 0 | 0 | 0 | 0 | 0 | 0 | 0 | 0 | 0 | 0 |
|
* 69 months of May on record a trace or 0.0" of snowfall. |
|||||||||||||
One Day Snowfall Records (inches):
There were no daily records in 2024
There were no significant snowy months in 2024.
| Top Ten Snowiest Years on Record | |||||||
| Rank | Year | Snowfall (inches) | |||||
| 1 | 2023 | 92.0 | |||||
| 2 | 1920 | 77.0 | |||||
| 3 | 2017 | 71.1 | |||||
| 4 | 2013 | 70.6 | |||||
| 5 | 2009 | 62.5 | |||||
| 6 | 2022 | 61.7 | |||||
| 7 | 2020 | 61.7 | |||||
| 8 | 2016 | 61.7 | |||||
| 9 | 2010 | 60.1 | |||||
| 10 | 1919 | 58.0 | |||||
| 46 | 2024 | 30.4 | |||||
 |
 |
 |
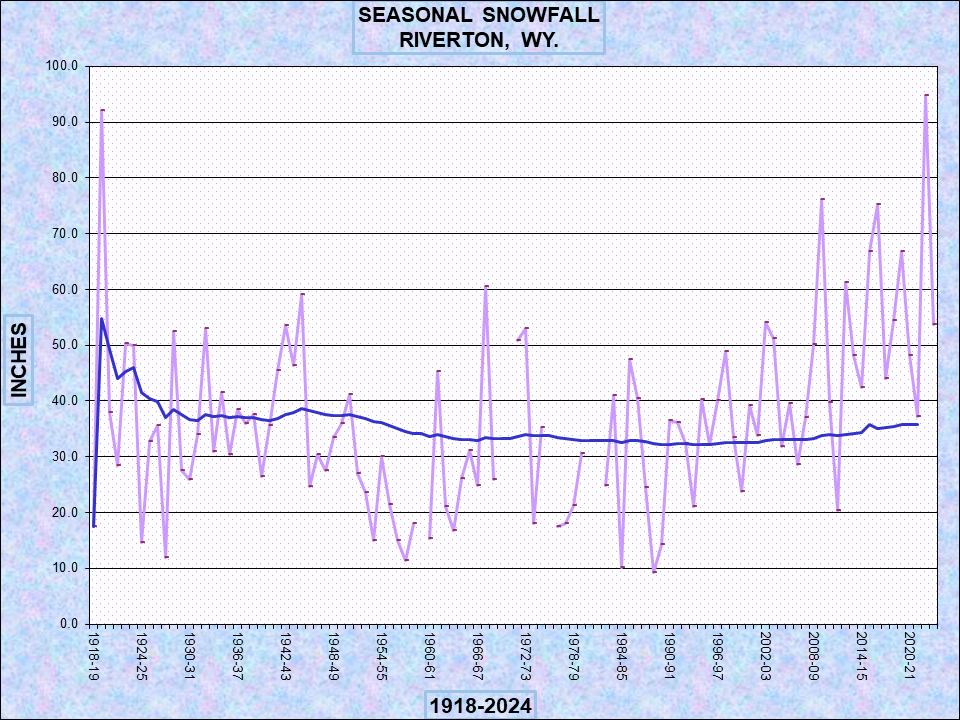 |
| Annual and Seasonal Snowfall for Period of Record - Click on Graph to Enlarge | |
|
Learn more about the National Weather Service's efforts to build a Weather-Ready Nation! |
|
Learn more about the National Weather Service's efforts to build a Weather-Ready Nation! |

Click Here for the complete 2023 summary for Casper
...Highlights of 2023...
| Element | Jan | Feb | Mar | Apr | May | Jun | Jul | Aug | Sep | Oct | Nov | Dec | Year |
| Average High | 27.4 | 29.9 | 37.5 | 51.7 | 70.3 | 73.2 | 88.0 | 84.5 | 78.9 | 59.5 | 47.6 | 42.6 | 57.6 |
| Mean High (1991-2020 Normals) | 35.2 | 37.8 | 48.8 | 56.3 | 66.8 | 79.6 | 89 | 86.7 | 75.6 | 59.7 | 45.9 | 34.7 | 59.7 |
| Average Low | 14.3 | 12.0 | 15.9 | 26.9 | 40.1 | 47.1 | 51.6 | 51.8 | 43.5 | 30.5 | 23.5 | 21.5 | 31.6 |
| Mean Low (1991-2020 Normals) | 15 | 15.4 | 22.7 | 28.2 | 37.1 | 45.4 | 53 | 51.4 | 42.2 | 30.9 | 22 | 14.8 | 31.5 |
| Average Temperature | 20.9 | 20.9 | 26.7 | 39.3 | 55.2 | 60.2 | 69.8 | 68.1 | 61.2 | 45.0 | 35.6 | 32.0 | 44.6 |
| Mean Average Temperature (1991-2020 Normals) | 25.1 | 26.6 | 35.8 | 42.3 | 52 | 62.5 | 71 | 69 | 58.9 | 45.3 | 34 | 24.8 | 45.6 |
| Departure from Normal | -4.2 | -5.7 | -9.1 | -3 | 3.2 | -2.3 | -1.2 | -0.9 | 2.3 | -0.3 | 1.6 | 7.2 | -1.0 |
|
Rank: 84 years of record (P.O.R 12/1939-2023) |
22 | 14 | 8 | 17 | 72 | 18 | 22 | 30 | 65 | 27 | 58 | 82 | 24 |
 |
|||||||||||||
| Highest Daily Maximum | 39 | 43 | 53 | 72 | 81 | 84 | 101 | 95 | 91 | 78 | 65 | 56 | 101 |
| Date of Occurrence | 14,15 | 26 | 30 | 12 | 22,31 | 19 | 17 | 16,17 | 1 | 10 | 5 | 6 | 7/17 |
| Lowest Daily Minimum | -21 | -26 | -6 | 3 | 26 | 38 | 40 | 36 | 33 | 2 | -10 | 0 | -26 |
| Date of Occurrence | 30 | 23 | 8 | 5 | 1 | 17,25 | 7 | 31 | 26 | 27 | 25 | 25 | 2/23 |
| Number of Days with: | Jan | Feb | Mar | Apr | May | Jun | Jul | Aug | Sep | Oct | Nov | Dec | |
| Maximum >= 90° | 0 | 0 | 0 | 0 | 0 | 0 | 16 | 9 | 1 | 0 | 0 | 0 | 48 |
| Maximum <= 32° | 21 | 14 | 9 | 4 | 0 | 0 | 0 | 0 | 0 | 3 | 5 | 3 | 59 |
| Minimum <= 32° | 31 | 28 | 30 | 23 | 4 | 0 | 0 | 0 | 0 | 13 | 22 | 27 | 178 |
| Minimum <= 0° | 4 | 5 | 1 | 0 | 0 | 0 | 0 | 0 | 0 | 0 | 1 | 1 | 12 |
| Record High Temperatures Set or Tied | 0 | 0 | 0 | 0 | 0 | 0 | 1 | 0 | 0 | 0 | 0 | 2 | 3 |
| Record Low Temperatures Set or Tied | 0 | 2 | 1 | 1 | 0 | 1 | 0 | 1 | 0 | 0 | 0 | 0 | 6 |
Daily Records:
Record High Temperatures:
February: -17 on the 22nd and -26 on the 23rd.July: 101 on the 17th.December: 55 on the 19th and 53 on the 21st (tie)Record Low Temperatures:
March: -6 on the 8th (tie)April: 3 on the 5th
June: 38 on the 25th (tie).August: 39 on the 14th.
| Coldest Months of March on Record | |||||||
| Rank | Year | Average Temperature °F | |||||
| 1 | 1965 | 20.4 | |||||
| 2 | 1964 | 25.1 | |||||
| 3 | 1943 | 25.8 | |||||
| 3 | 1944 | 25.8 | |||||
| 3 | 2002 | 25.8 | |||||
| 3 | 1955 | 25.8 | |||||
| 7 | 1954 | 26.2 | |||||
| 8 | 2023 | 26.7 | |||||
| 9 | 1952 | 27.0 | |||||
| 10 | 1958,1969 | 28.4 | |||||
| Warmest Months of December on Record | |||||||
| Rank | Year | Average Temperature °F | |||||
| 1 | 1980 | 34.3 | |||||
| 2 | 1946 | 33.0 | |||||
| 3 | 2023 | 32.0 | |||||
| 4 | 1957/1994 | 31.8 | |||||
| 6 | 1950 | 31.2 | |||||
| 7 | 1962 | 30.4 | |||||
| 8 | 1959 | 30.3 | |||||
| 9 | 2021 | 30.1 | |||||
| 10 | 1999 | 29.9 | |||||
| Top Ten Warmest Years on Record | |||||||
| Rank | Year | Average Temperature °F | |||||
| 1 | 1994 | 49.1 | |||||
| 2 | 2012 | 48.7 | |||||
| 3 | 1954 | 48.3 | |||||
| 4 | 1981 | 48.1 | |||||
| 5 | 1992 | 48.0 | |||||
| 6 | 1940, 1953, 1963 | 47.3 | |||||
| 9 | 2015, 2006, 1999 | 47.1 | |||||
| 61 | 2023 | 44.6 | |||||
| Top Ten Coldest Years on Record | |||||||
| Rank | Year | Average Temperature °F | |||||
| 1 | 1985 | 42.5 | |||||
| 2 | 1951 | 43.1 | |||||
| 3 | 1978 | 43.2 | |||||
| 4 | 1964 | 43.5 | |||||
| 5 | 2019, 1975 | 43.6 | |||||
| 6 | 2009, 1979, 1968, 1949 | 43.8 | |||||
| 10 | 1971 | 43.9 | |||||
| 24 | 2023 | 44.6 | |||||
 |
 |
| Average Annual Temperature for Period of Record - Click on Graph to Enlarge | |
|
Learn more about the National Weather Service's efforts to build a Weather-Ready Nation! |

| Element | Jan | Feb | Mar | Apr | May | Jun | Jul | Aug | Sep | Oct | Nov | Dec | Year |
| Average Speed (MPH) | 15 | 19.1 | 13.2 | 13.4 | 9.5 | 8 | 8.4 | 8.7 | 9.4 | 9.1 |
14.3
|
13.7
|
11.8 |
| Maximum 3-sec Gust | 55 | 58 | 64 | 70 | 51 | 57 | 62 | 64 | 56 | 61 | 52 |
66
|
70 |
| Direction | 210 | 220 | 210 | 350 | 230 | 290 | 290 | 280 | 230 | 260 | 280 |
250
|
350 |
| Date of Occurrence | 9 | 21 | 10 | 27 | 6 | 20 | 3 | 27 | 4 | 10 | 5 | 7 | 4/27 |
| Number of Days with: | |||||||||||||
| 2-Min Wind >50 mph | 0 | 0 | 0 | 1 | 0 | 0 | 0 | 0 | 0 | 0 | 0 | 0 | 1 |
| Peak Wind >50 mph | 2 | 4 | 2 | 4 | 1 | 1 | 6 | 4 | 2 | 1 | 1 | 2 | 30 |
| Peak Wind >70 mph | 0 | 0 | 0 | 1 | 0 | 0 | 0 | 0 | 0 | 0 | 0 | 0 | 1 |
|
Learn more about the National Weather Service's efforts to build a Weather-Ready Nation! |
| Element | Jan | Feb | Mar | Apr | May | Jun | Jul | Aug | Sep | Oct | Nov | Dec | Year |
| Total (inches) | 1.99 | 0.69 | 0.65 | 1.49 | 2.03 | 3.29 | 1.33 | 1.01 | 0.59 | 1.88 | 0.40 | 0.06 | 15.41 |
| Mean Precipitation (1991-2020 Normals) |
0.49 | 0.56 | 0.84 | 1.41 | 2.21 | 1.34 | 1.19 | 0.79 | 0.95 | 1.19 | 0.64 | 0.61 | 12.22 |
| Departure from Normal | 1.50 | 0.13 | -0.19 | 0.08 | -0.18 | 1.95 | 0.14 | 0.22 | -0.36 | 0.69 | -0.24 | -0.55 | 3.19 |
| Percent of Normal | 406 | 123 | 77 | 106 | 92 | 246 | 112 | 128 | 62 | 158 | 63 | 10 | 126 |
|
Rank - |
84 | 60 | 33 | 53 | 47 | 78 | 60 | 67 | 37 | 74 | 24 | 2 | 74 |
|
|||||||||||||
| Greatest 24-HR Total | 0.80 | 0.49 | 0.39 | 0.90 | 0.53 | 0.88 | 0.49 | 0.29 | 0.23 | 1.62 | 0.40 | 0.04 | 1.62 |
| Dates of Occurrence | 10-11 | 21-22 | 22 | 3 | 23-24 | 15-16 | 20 | 8 | 13-14 | 11-12 | 23-24 | 23-24 |
11-12 Oct |
| Number of Days with: | |||||||||||||
| Precipitation >= 0.01 | 11 | 6 | 9 | 9 | 14 | 15 | 11 | 11 | 7 | 7 | 3 | 4 | 107 |
| Precipitation >= 0.10 | 7 | 3 | 1 | 2 | 9 | 9 | 3 | 4 | 2 | 3 | 2 | 0 | 45 |
| Precipitation >= 1.00 | 0 | 0 | 0 | 0 | 0 | 0 | 0 | 0 | 0 | 1 | 0 | 0 | 0 |
| Days with Thunderstorms | 0 | 0 | 0 | 1 | 9 | 23 | 14 | 11 | 6 | 0 | 0 | 0 | 64 |
| Daily Precipitation Records Set or Tied | 5 | 1 | 0 | 2 | 0 | 1 | 0 | 0 | 0 | 1 | 1 | 0 | 11 |
One Day Precipitation Records:
January: 0.27" on the 1st, 0.23" on the 2nd, 0.16" on the 10th, 0.55" on the 11th (all-time high), and 0.17 on the 18th
February: 0.28h." on the 21st
April: 0.90" on the 3rd and 0.37" on the 4th
June: 0.51 on the 4th.
October: 1.34" on the 12th.
November: 0.29 on the 23rd (tie).
|
Top Ten Driest December's on Record |
|||||||
| Rank | Year | Precipitation (inches) | |||||
| 1 | 1952 | 0.03 | |||||
| 2 | 2023 | 0.06 | |||||
| 3 | 2004 | 0.07 | |||||
| 4 | 1998/1999 | 0.10 | |||||
| 6 | 2001 | 0.13 | |||||
| 7 | 1969 | 0.16 | |||||
| 8 | 2002 | 0.19 | |||||
| 9 | 1974 | 0.22 | |||||
| 10 | 1958/1962 | 0.23 | |||||
| Top Ten Wettest January's on Record | |||||||
| Rank | Year | Precipitation (inches) | |||||
| 1 | 2023 | 1.99 | |||||
| 2 | 1987 | 1.42 | |||||
| 3 | 1949 | 1.36 | |||||
| 4 | 1944 | 1.30 | |||||
| 5 | 1984 | 1.19 | |||||
| 6 | 2009 | 1.08 | |||||
| 7 | 2016 | 0.99 | |||||
| 8 | 1972 | 0.99 | |||||
| 9 | 1996 | 0.94 | |||||
| 10 | 2022 | 0.90 | |||||
| Top Ten Wettest June's on Record | |||||||
| Rank | Year | Precipitation (inches) | |||||
| 1 | 2003 | 4.74 | |||||
| 2 | 1982 | 4.15 | |||||
| 3 | 1986 | 4.06 | |||||
| 4 | 1983 | 3.76 | |||||
| 5 | 1967 | 3.75 | |||||
| 6 | 1995 | 3.62 | |||||
| 7 | 2023 | 3.29 | |||||
| 8 | 1947 | 3.11 | |||||
| 9 | 1993 | 279 | |||||
| 10 | 1998 | 2.67 | |||||
| Top Ten Wettest October's on Record | |||||||
| Rank | Year | Precipitation (inches) | |||||
| 1 | 1998 | 4.62 | |||||
| 2 | 1994 | 4.17 | |||||
| 3 | 2013 | 3.03 | |||||
| 4 | 2021 | 2.69 | |||||
| 5 | 1986 | 2.63 | |||||
| 6 | 1962 | 2.49 | |||||
| 7 | 1972 | 2.04 | |||||
| 8 | 1957/1949 | 2.00 | |||||
| 9 | 1942 | 1.95 | |||||
| 10 | 2023 | 1.88 | |||||
| Top Ten Driest Years on Record | |||||||
| Rank | Year | Precipitation (inches) | |||||
| 1 | 2020 | 5.79 | |||||
| 2 | 1988 | 6.56 | |||||
| 3 | 2001 | 6.76 | |||||
| 4 | 2002 | 7.05 | |||||
| 5 | 1960 | 7.34 | |||||
| 6 | 1954 | 7.70 | |||||
| 7 | 2012 | 7.88 | |||||
| 8 | 1963 | 7.90 | |||||
| 9 | 1966 | 8.14 | |||||
| 10 | 1943 | 8.91 | |||||
| 74 | 2023 | 15.41 | |||||
| Top Ten Wettest Years on Record | |||||||
| Rank | Year | Precipitation (inches) | |||||
| 1 | 1982 | 20.48 | |||||
| 2 | 1995 | 18.94 | |||||
| 3 | 1983 | 18.41 | |||||
| 4 | 1978 | 17.64 | |||||
| 5 | 1941 | 16.24 | |||||
| 6 | 1957 | 16.12 | |||||
| 7 | 1986 | 15.92 | |||||
| 8 | 1993 | 15.91 | |||||
| 9 | 2009 | 15.77 | |||||
| 10 | 2016 | 15.57 | |||||
| 11 | 2023 | 15.41 | |||||
 |
 |
| Annual Precipitation for Period of Record - Click on Graph to Enlarge | |
|
Learn more about the National Weather Service's efforts to build a Weather-Ready Nation! |
| Element | Jan | Feb | Mar | Apr | May | Jun | Jul | Aug | Sep | Oct | Nov | Dec | Year |
| Total (inches) | 37 | 16.4 | 9.4 | 39 | 0 | 0 | 0 | 0 | 0 | 2.8 | 10.5 | 1 | 116.1 |
| Mean Snowfall (1991-2020 Normals) | 9 | 10.9 | 10.3 | 10.5 | 2.6 | 0.1 | 0 | 0 | 1.5 | 7 | 8.9 | 11 | 71.8 |
| Departure from Normal | 28 | 5.5 | -0.9 | 28.5 | -2.6 | -0.1 | 0.0 | 0.0 | -1.5 | -4.2 | 1.6 | -10 | 44.3 |
| Percent of Normal | 411 | 150 | 91 | 371 | 0 | 0 | 0 | 0 | 0 | 40 | 118 | 9 | 162 |
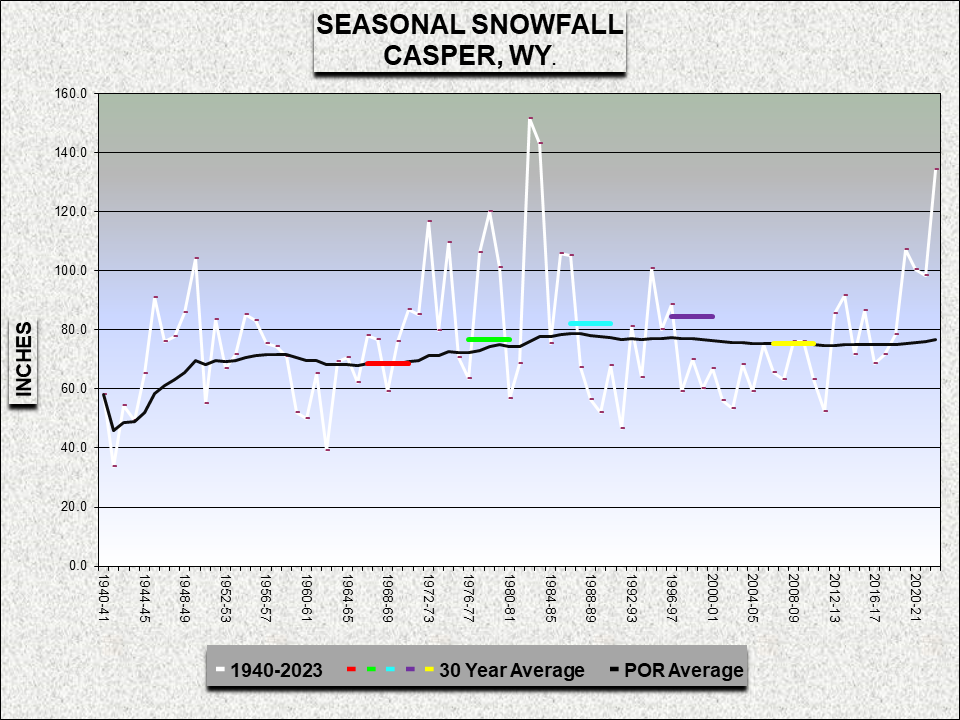
| Rank - Least to Most 84 years (P.O.R 12/1939-2023) |
83 | 75 | 34 | 83 | NA | NA | NA | NA | NA | 26 | 24 | 33 | 82 |
|
|||||||||||||
| Greatest 24-HR Total | 9 | 6.8 | 4.8 | 26.7 | 0 | 0 | 0 | 0 | 0 | 2.2 | 6.4 | 0.6 | 26.7 |
| Dates of Occurrence | 28 | 22 | 22 | 3 | NA | NA | NA | NA | NA | 26 | 23 | 23 | 04-3 |
| Number of Days with: | |||||||||||||
| Snowfall >= 1.0 inch | 9 | 3 | 3 | 4 | 0 | 0 | 0 | 0 | 0 | 1 | 2 | 0 | 22 |
| Daily Snowfall Records Set or Tied | 4 | 2 | 0 | 2 | 0 | 0 | 0 | 0 | 0 | 0 | 1 | 0 | 8 |
| * 50 months of September on record with no snowfall. | |||||||||||||
Snowfall Ranks and Records:
One Day Snowfall Records (inches):
January: 7.3" on the first, 5.9" on the 2nd, 5.8" on the 11th and 9" on the 28thFebruary: 4.6" on the 21st and 6.8" on the 22ndApril: 26.7" on the 3rd (all-time highest) and 9.3 on the 4thNovember: 6.4" on the 23rd
| Snowiest Months of January on Record | |||||||
| Rank | Year | Snowfall (inches) | |||||
| 1 | 1949 | 39.3 | |||||
| 2 | 2023 | 37.1 | |||||
| 3 | 1987 | 24.0 | |||||
| 4 | 1980 | 22.1 | |||||
| 5 | 1984 | 19.4 | |||||
| 6 | 1972 | 19.2 | |||||
| 7 | 1965 | 16.5 | |||||
| 8 | 2009 | 16.4 | |||||
| 9 | 1979 | 16.3 | |||||
| 10 | 1996,1962 | 16.2 | |||||
| Snowiest Months of February on Record | |||||||
| Rank | Year | Snowfall (inches) | |||||
| 1 | 2020 | 28.4 | |||||
| 2 | 1952 | 23.8 | |||||
| 3 | 1987 | 22.7 | |||||
| 4 | 1989,1955 | 21.5 | |||||
| 6 | 2004 | 18.9 | |||||
| 7 | 2018 | 18.6 | |||||
| 8 | 1953 | 18.5 | |||||
| 9 | 1995 | 16.9 | |||||
| 10 | 2023 | 16.4 | |||||
| Snowiest Months of April on Record | |||||||
| Rank | Year | Snowfall (inches) | |||||
| 1 | 1973 | 56.3 | |||||
| 2 | 2023, 2013 | 39.0 | |||||
| 4 | 1984 | 33.6 | |||||
| 5 | 1971 | 24.2 | |||||
| 6 | 1983 | 23.3 | |||||
| 7 | 1964 | 22.8 | |||||
| 8 | 1945 | 21.9 | |||||
| 9 | 1941 | 21.5 | |||||
| 10 | 1957 | 21.2 | |||||
| Top Ten Snowiest Years on Record | |||||||
| Rank | Year | Snowfall (inches) | |||||
| 1 | 1982 | 137.6 | |||||
| 2 | 1975 | 124.0 | |||||
| 3 | 1984 | 121.2 | |||||
| 4 | 1973 | 118.3 | |||||
| 5 | 2023 | 116.1 | |||||
| 6 | 1983 | 114.2 | |||||
| 7 | 1978 | 112.7 | |||||
| 8 | 2021 | 108.1 | |||||
| 9 | 2013 | 107.5 | |||||
| 10 | 1955 | 103.3 | |||||
  |
  |
|
| Annual and Seasonal Snowfall for Period of Record - Click on Graph to Enlarge | ||
|
Learn more about the National Weather Service's efforts to build a Weather-Ready Nation! |
Click Here for the complete 2024 summary for Lander
...Highlights of 2024...
2nd Warmest Year on record at 47.8 degrees F, 2.7 degrees above normal.
15th Driest Year on record with 9.23 inches, 70% of normal precipitation.
12th Least Snowiest year on record with 50.3 inches, 57% of normal.
46th Least Seasonal Snow (July 2023 - June 2024) with 70.9 inches of snow.
The peak wind gust for the year was 74 mph which occurred on August 17th.