• NOAA NCEI is the official source for Climate Normals for U.S. stations.
• Climate Normals are not simple 30-year averages of monthly or daily observations; many stations do not have complete observations for the full 30-year period. For daily and monthly normals in particular, complex estimation and scaling procedures are used with temperature and precipitation normals to ensure they are representing the full 30-year period and are internally consistent.
• The science behind the normals is the same as for the 1981-2010 edition, with only minor calculation technique updates.
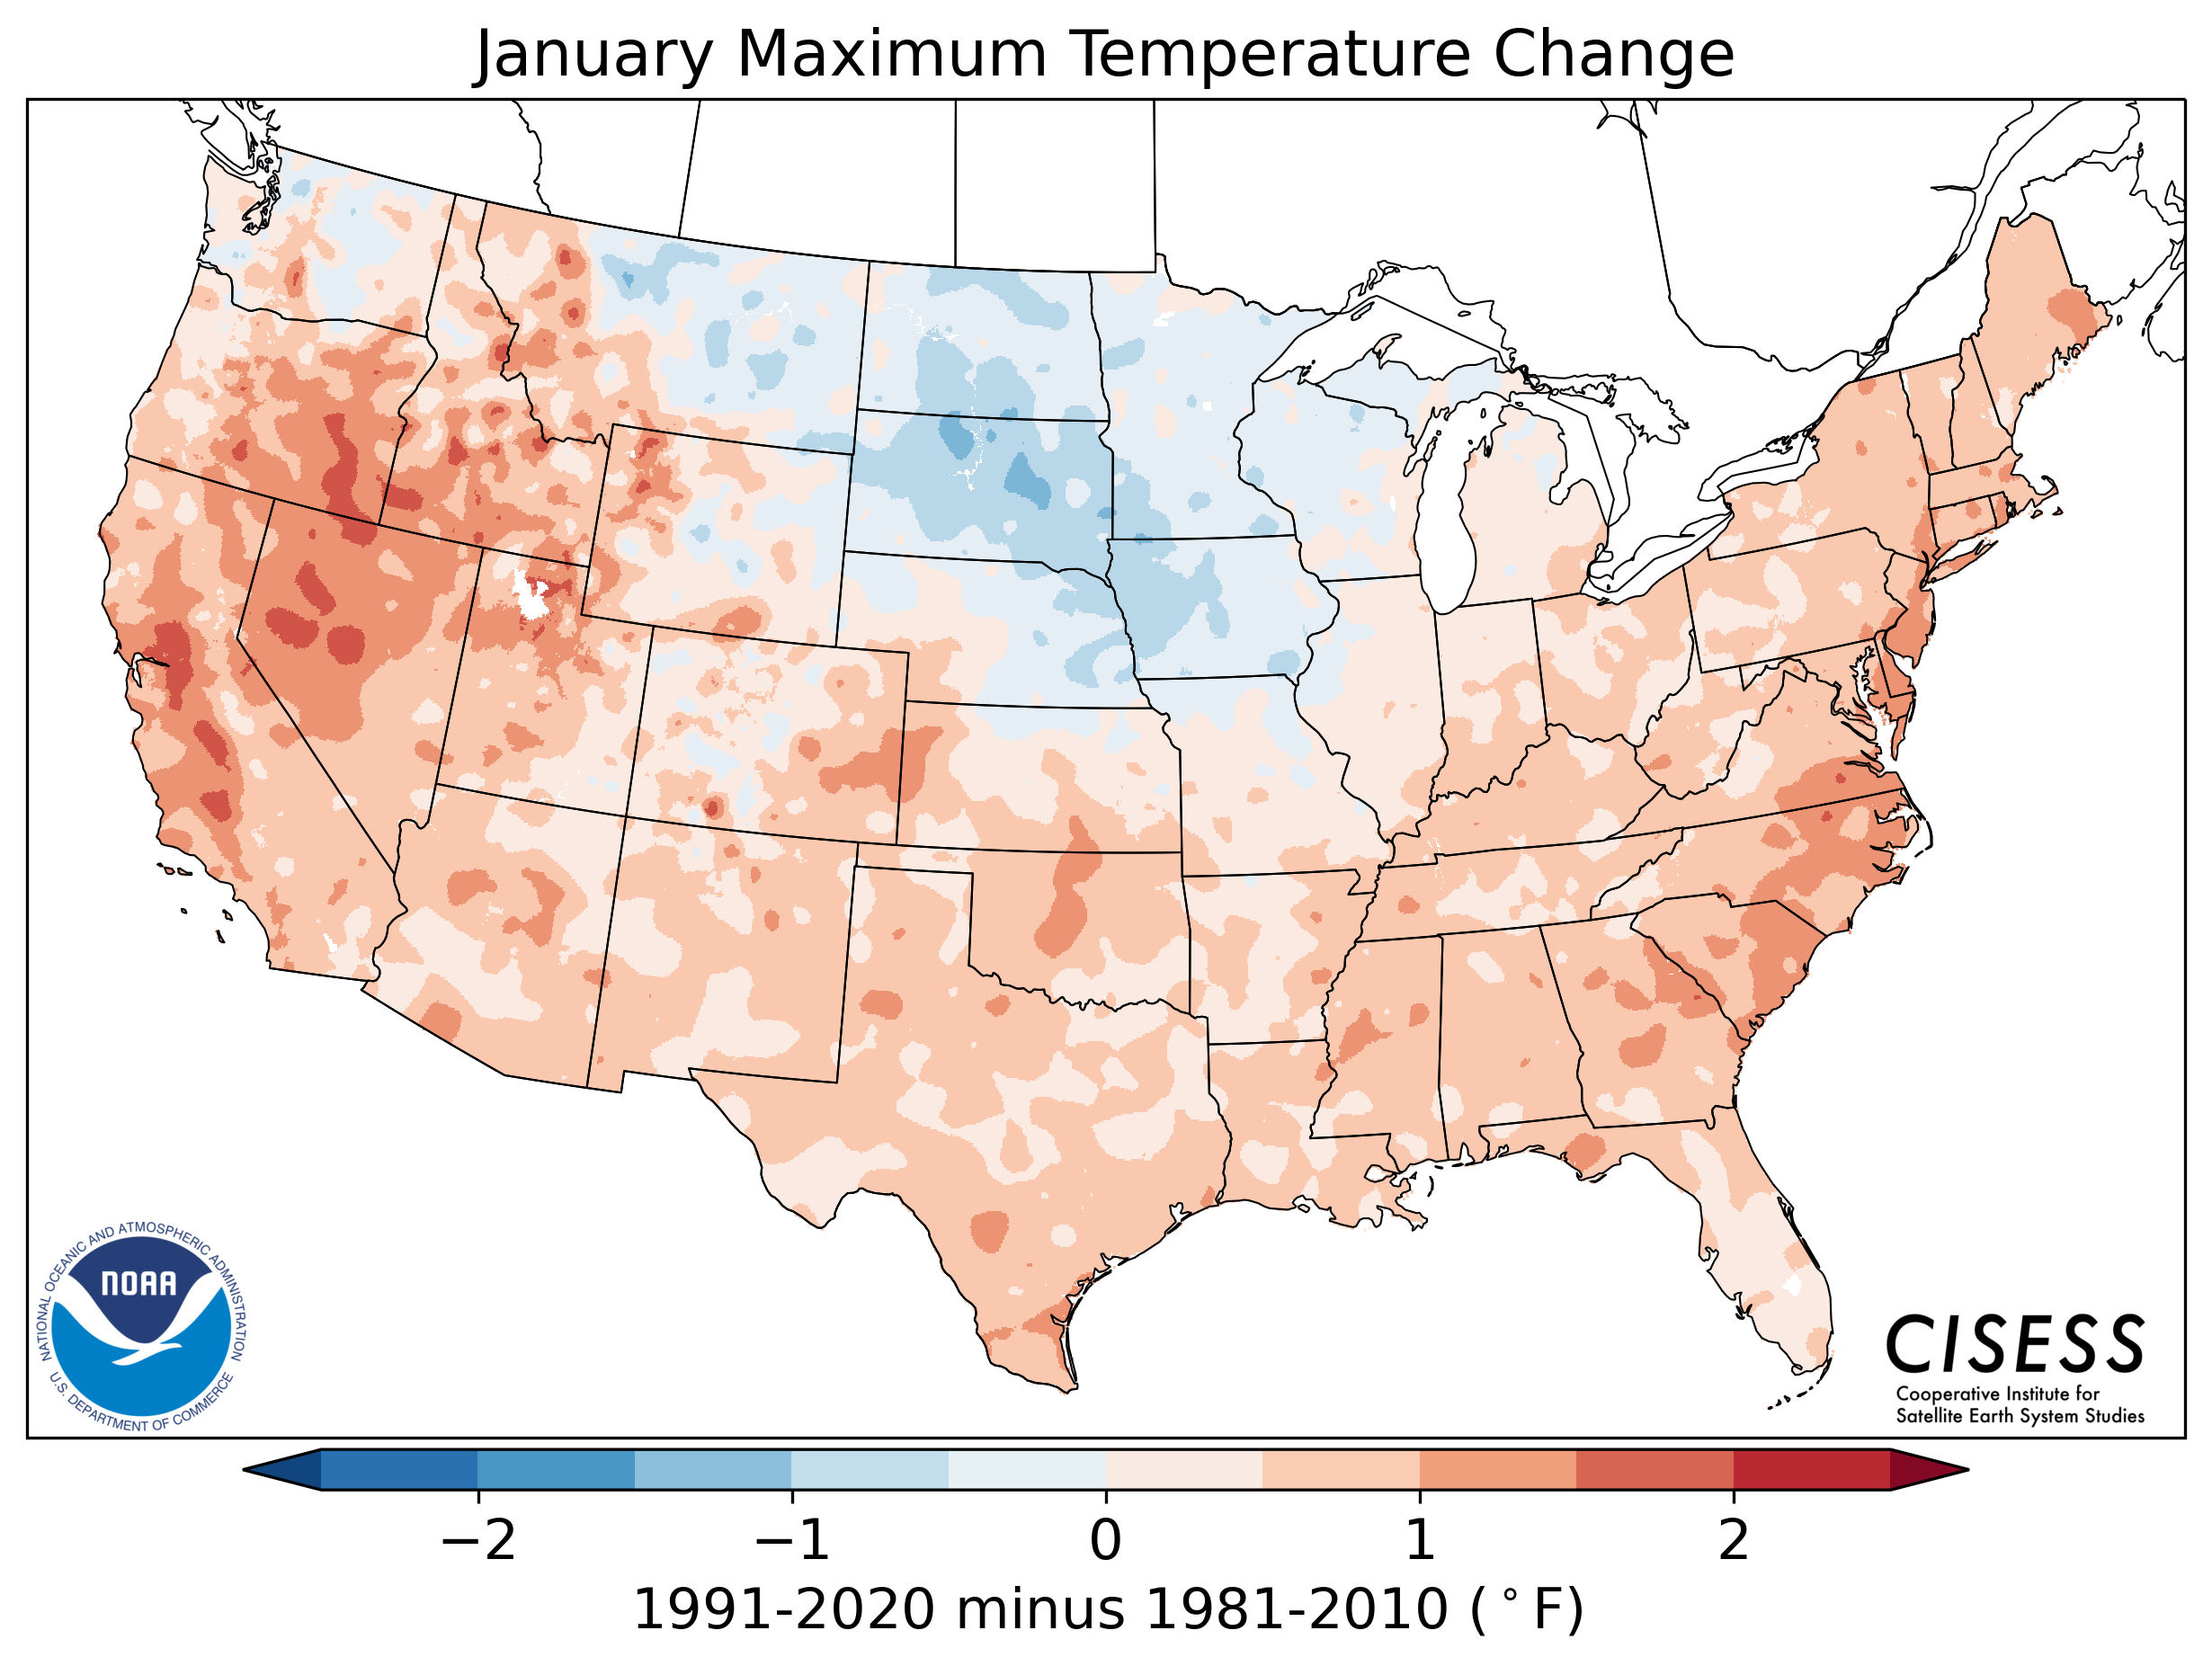
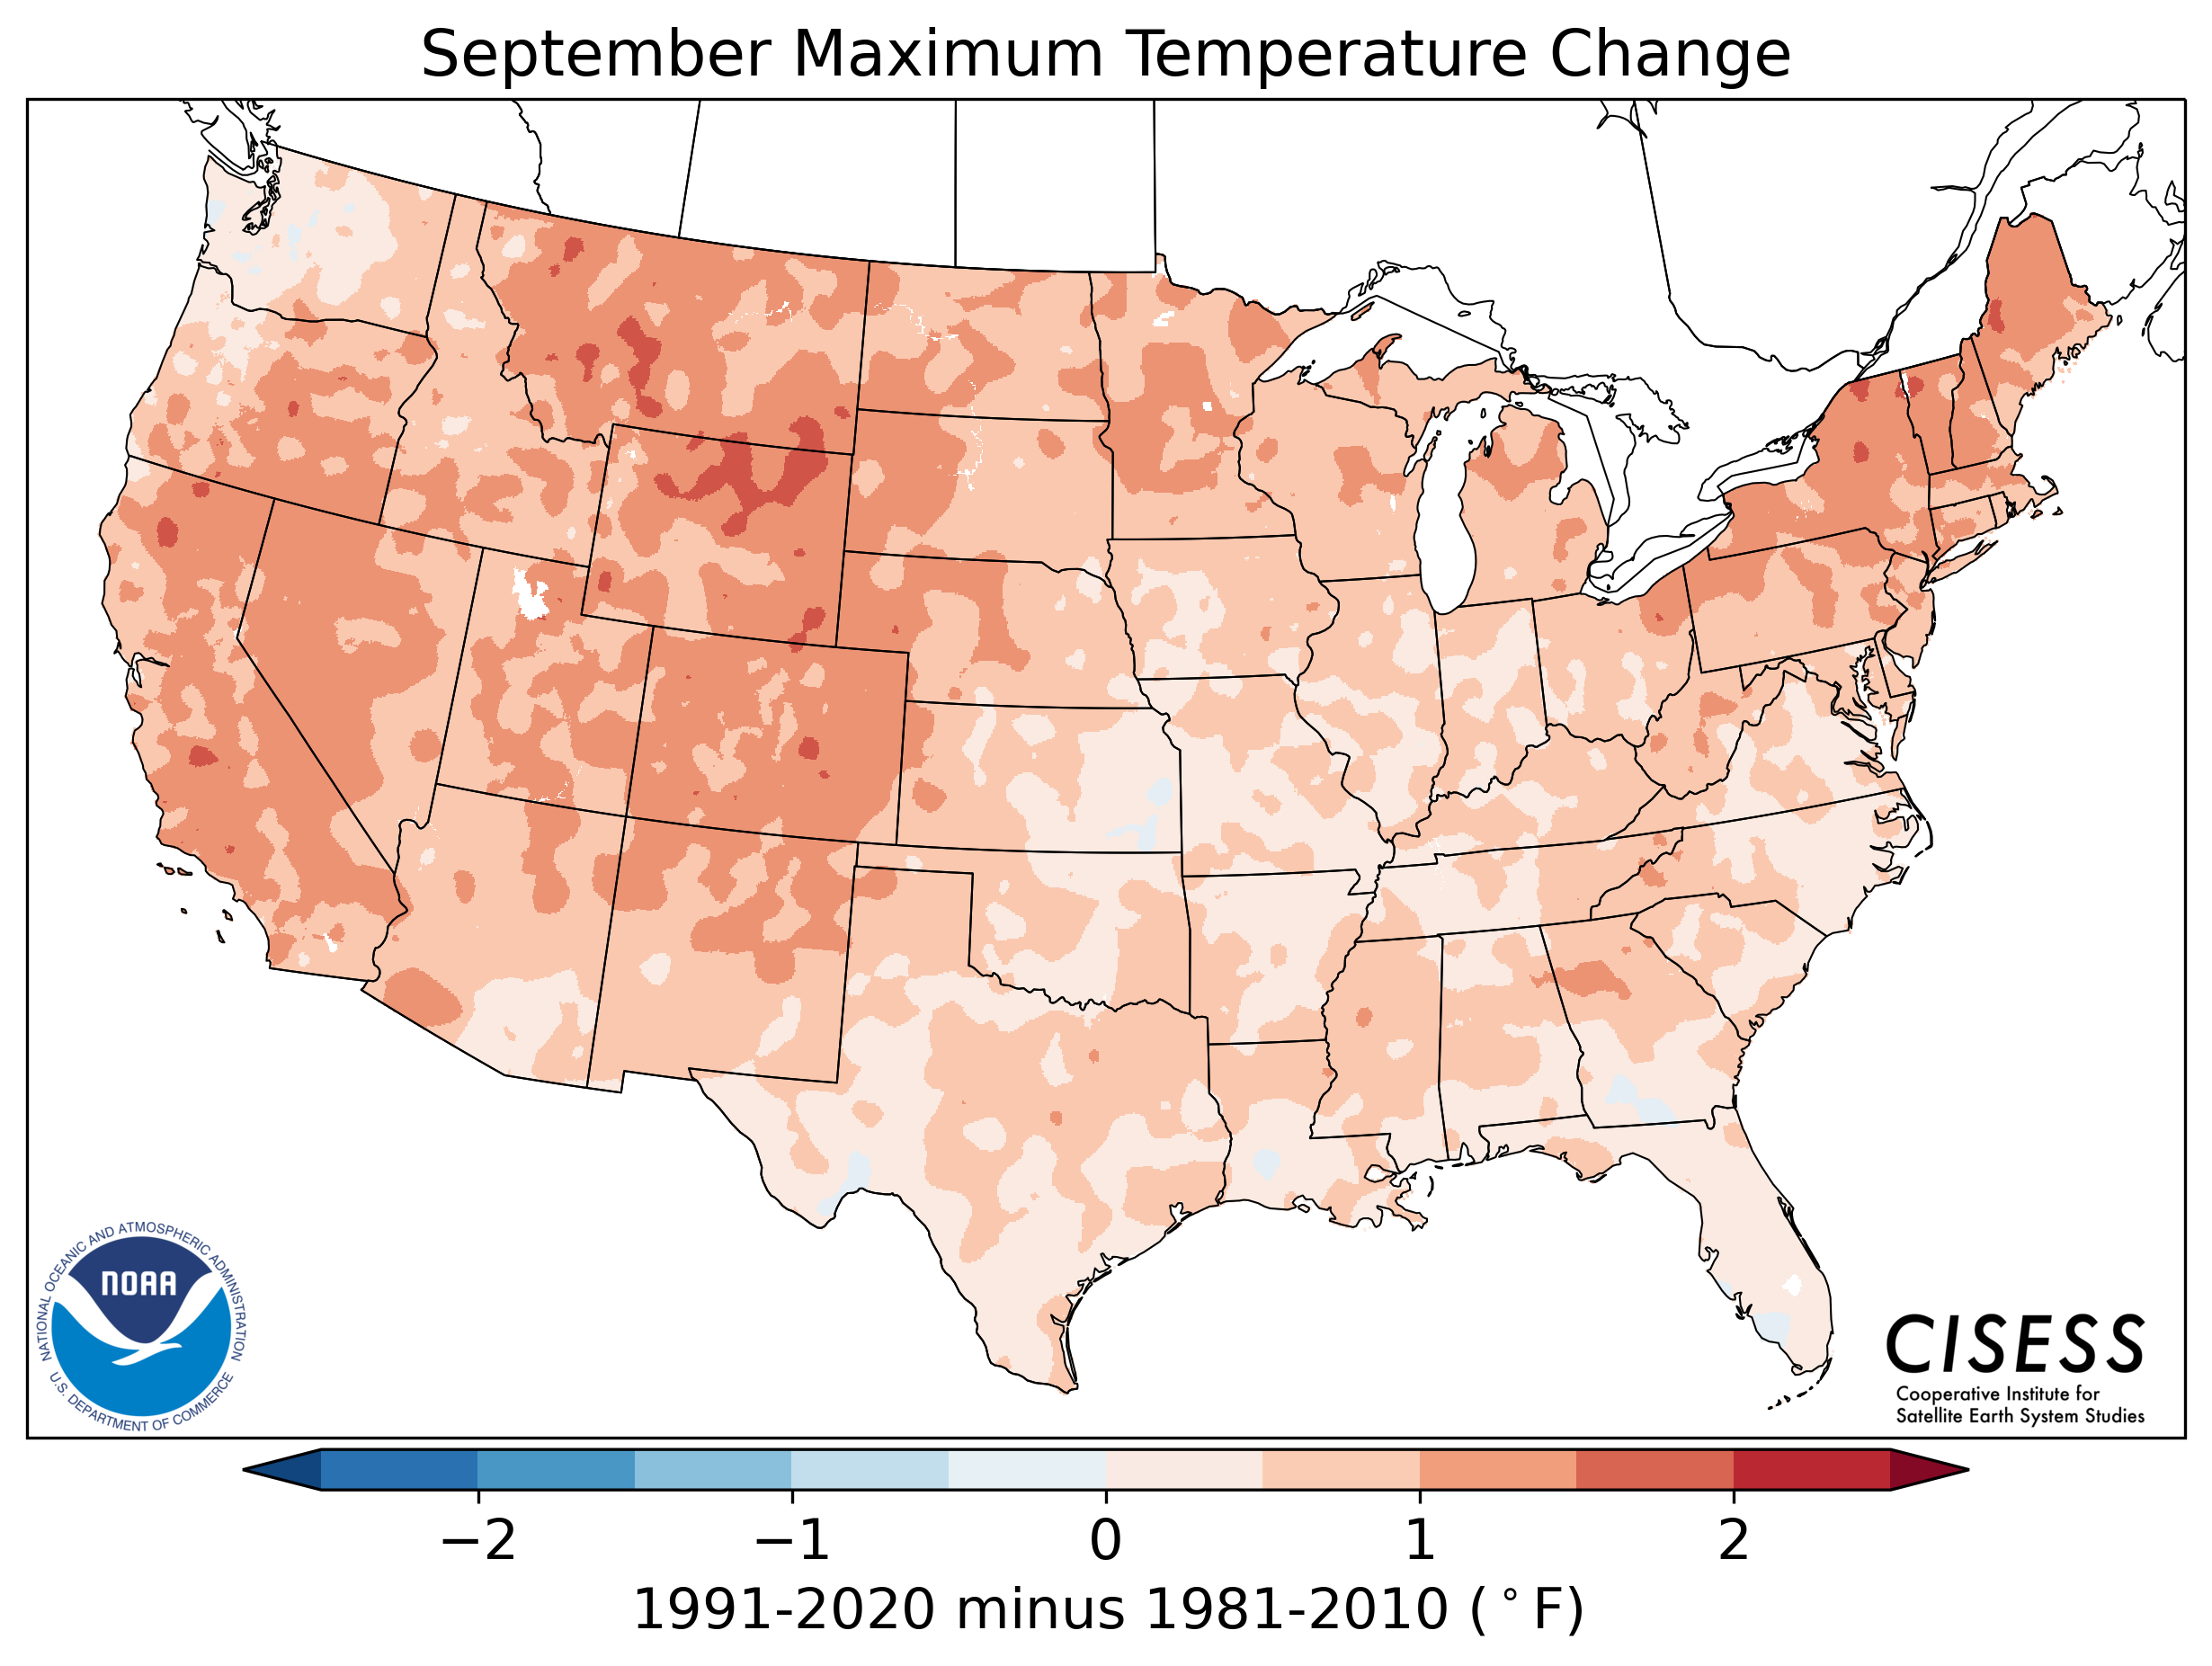
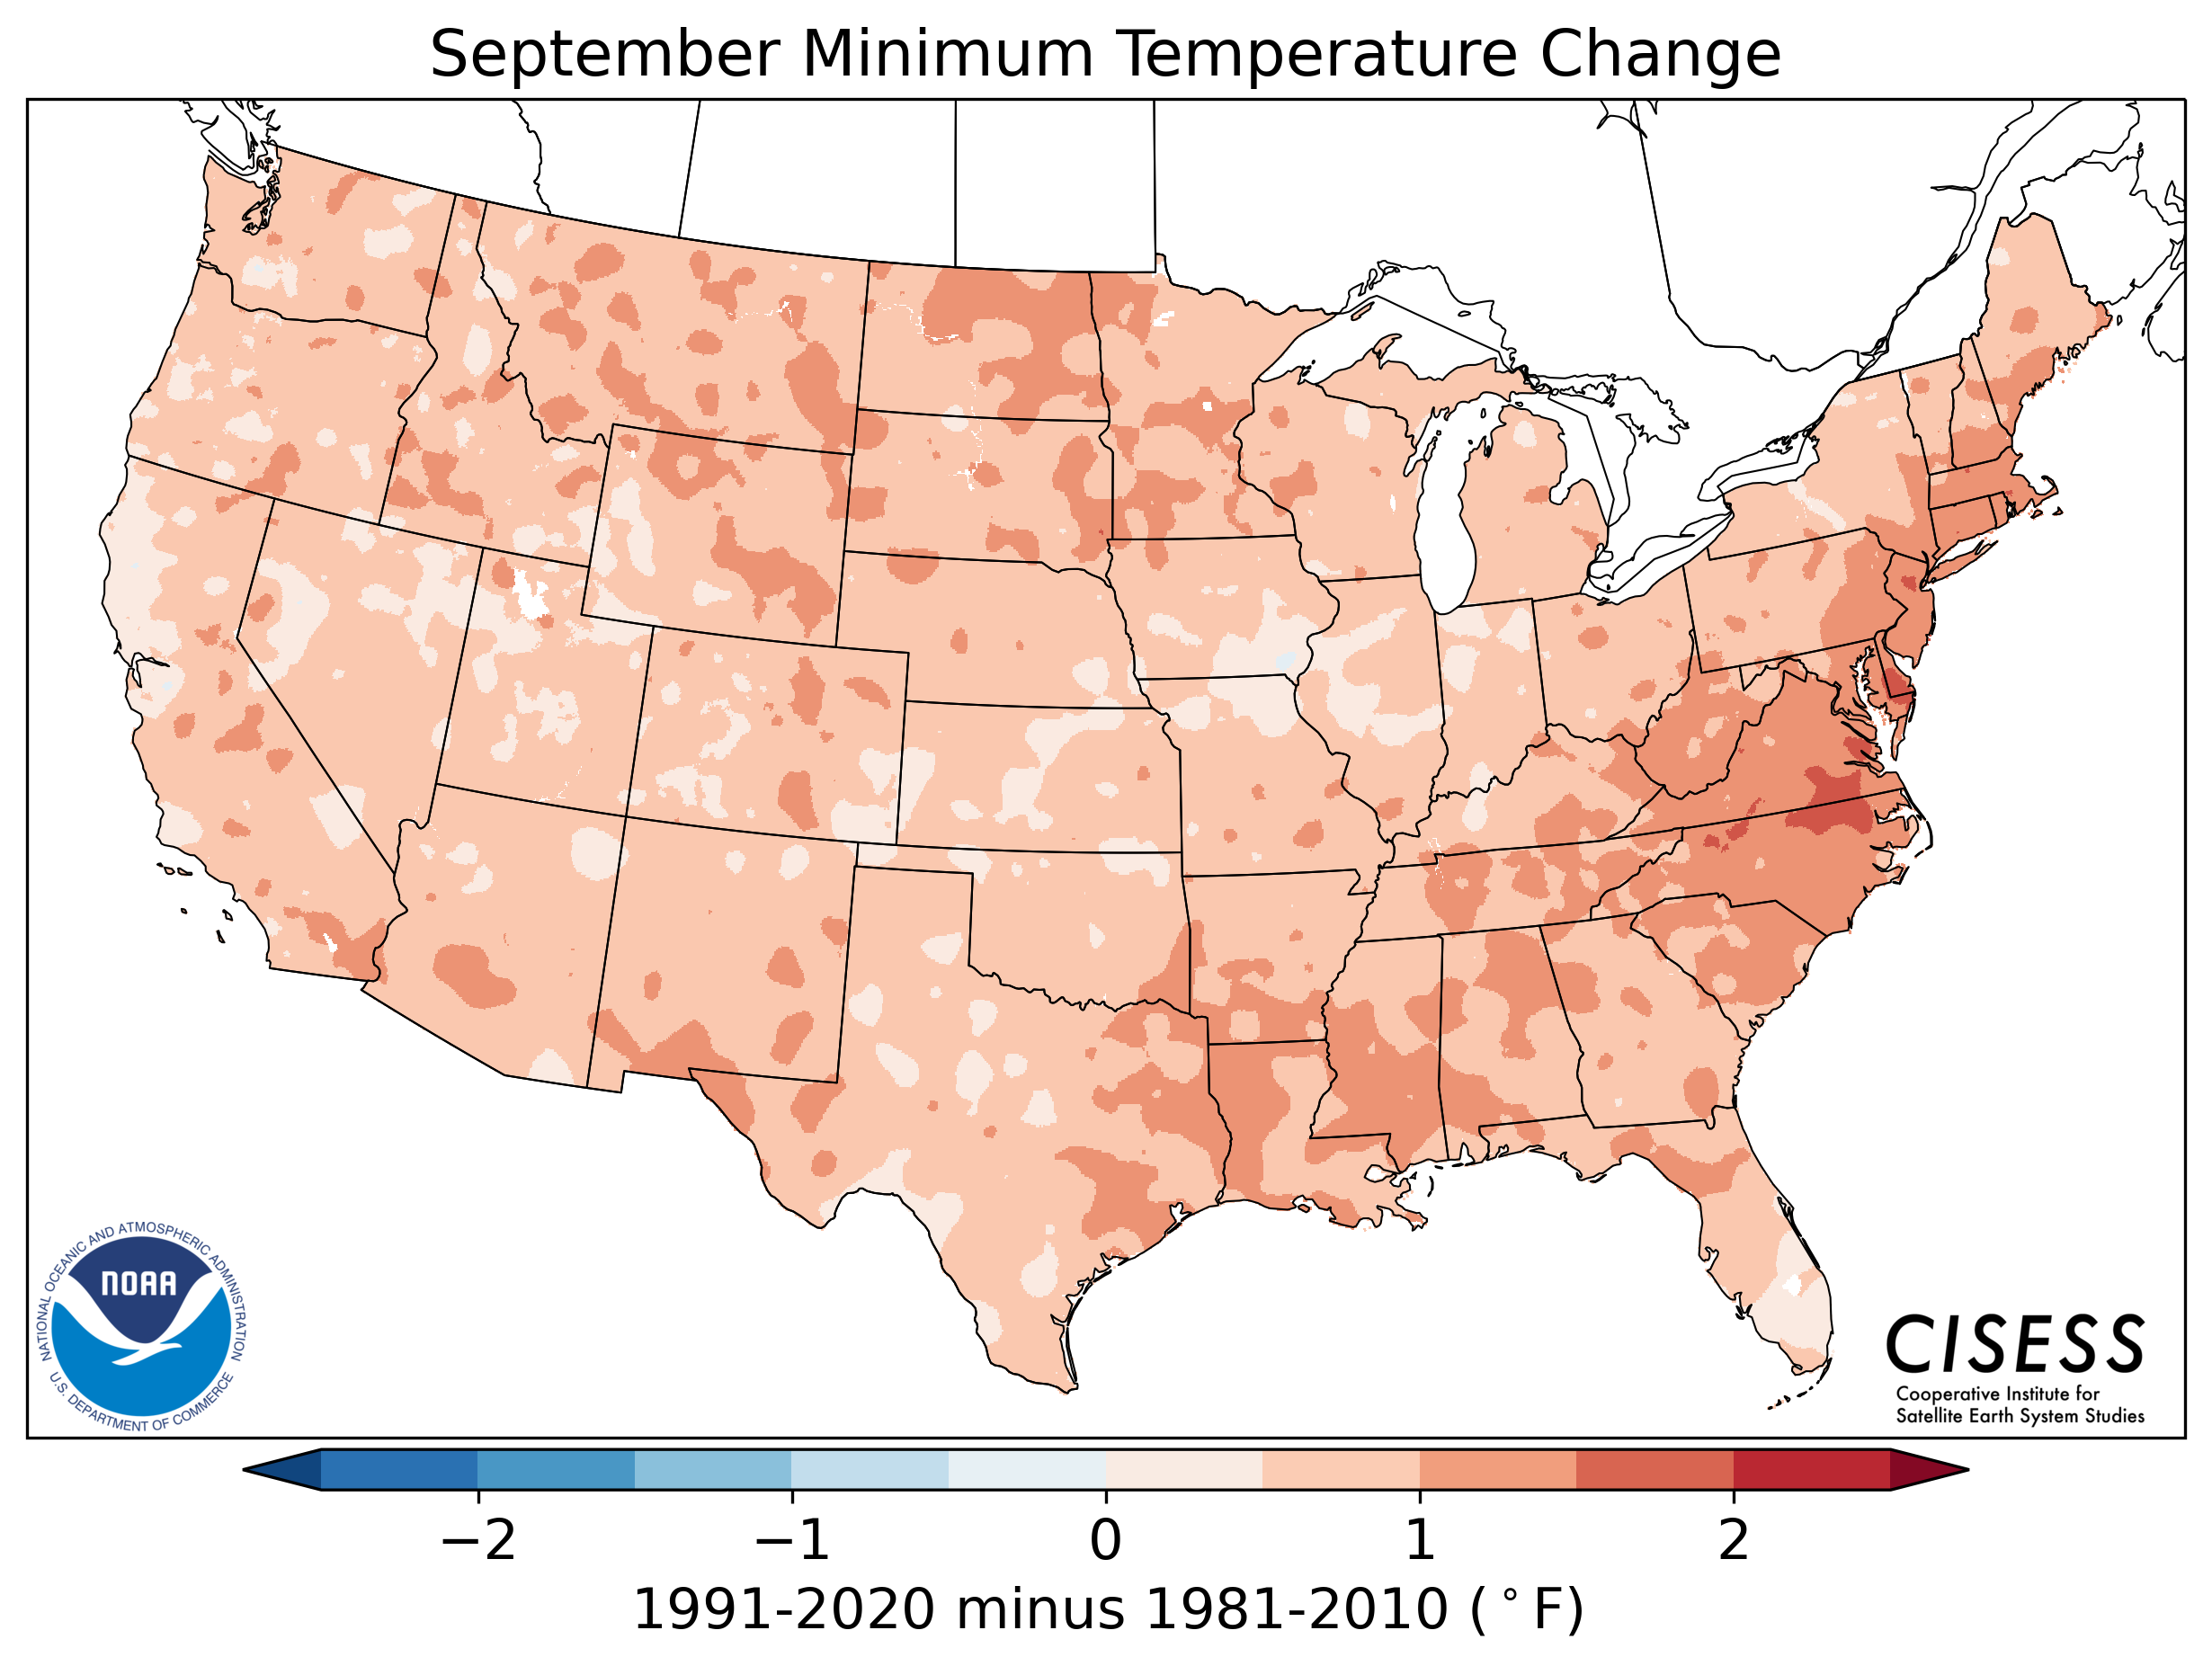
• Normals have changed from the 1981-2010 cycle to the 1991-2020 cycle, but two-thirds of the periods overlap, muting changes considerably.
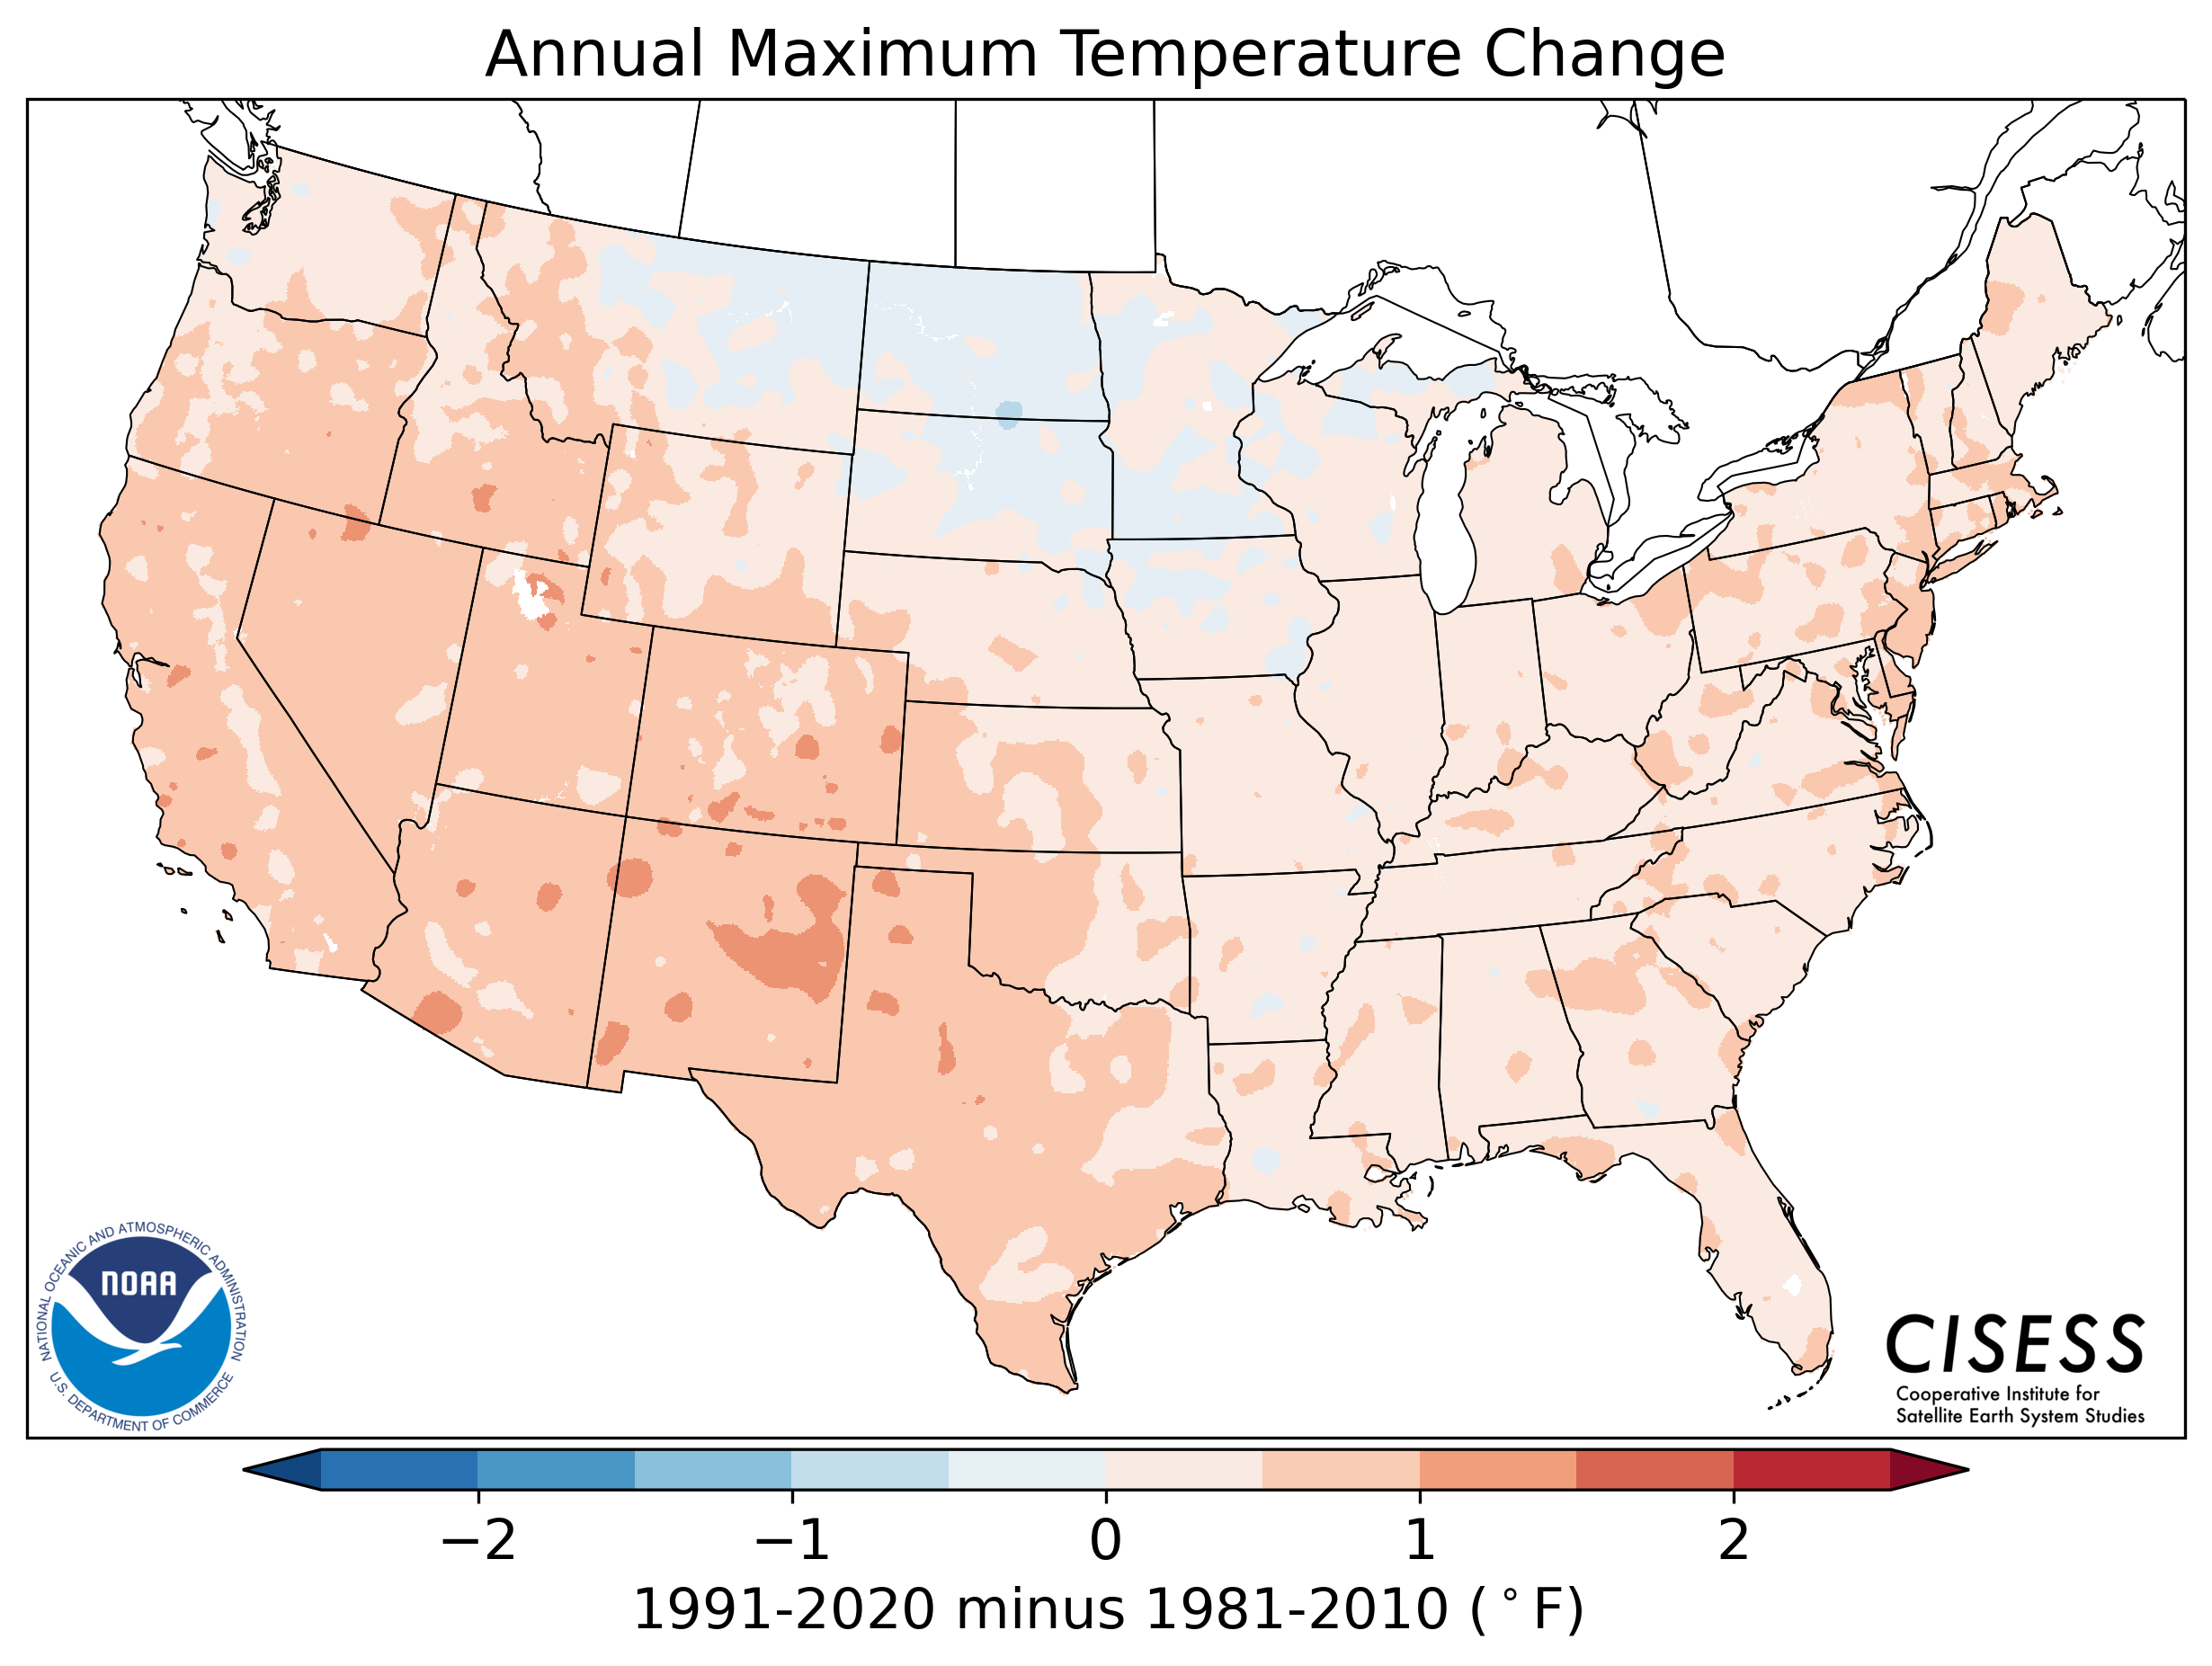
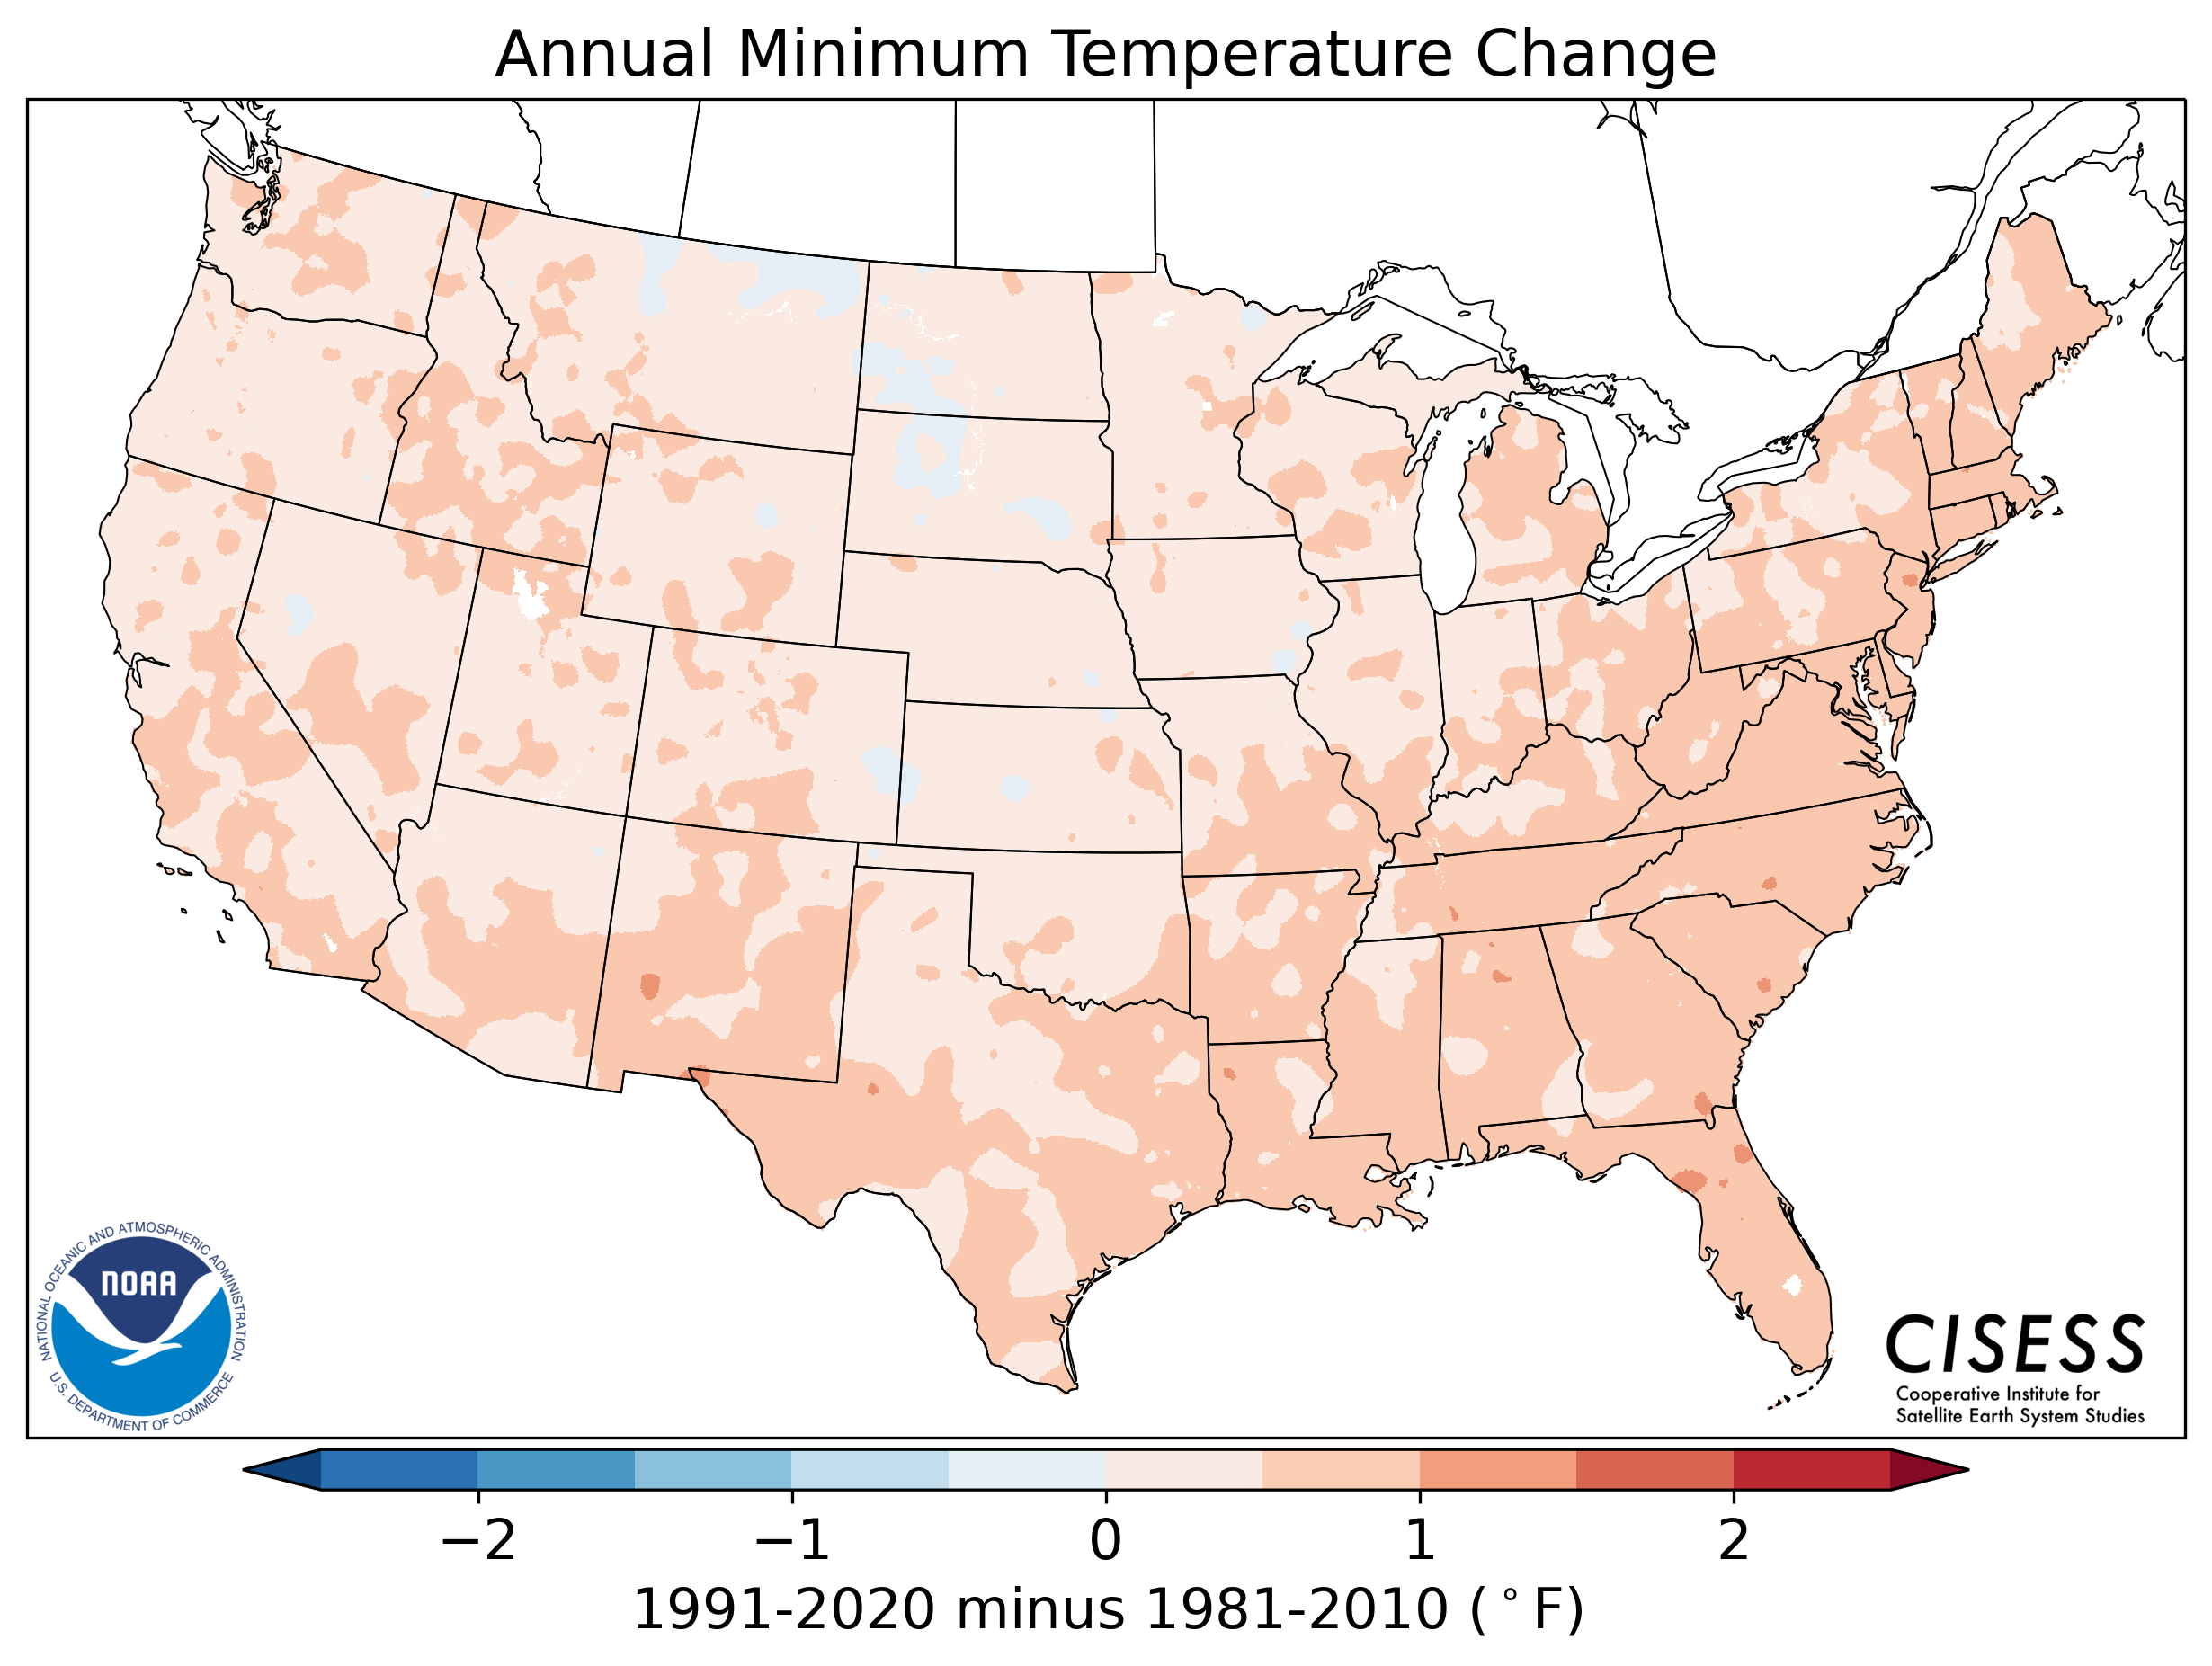
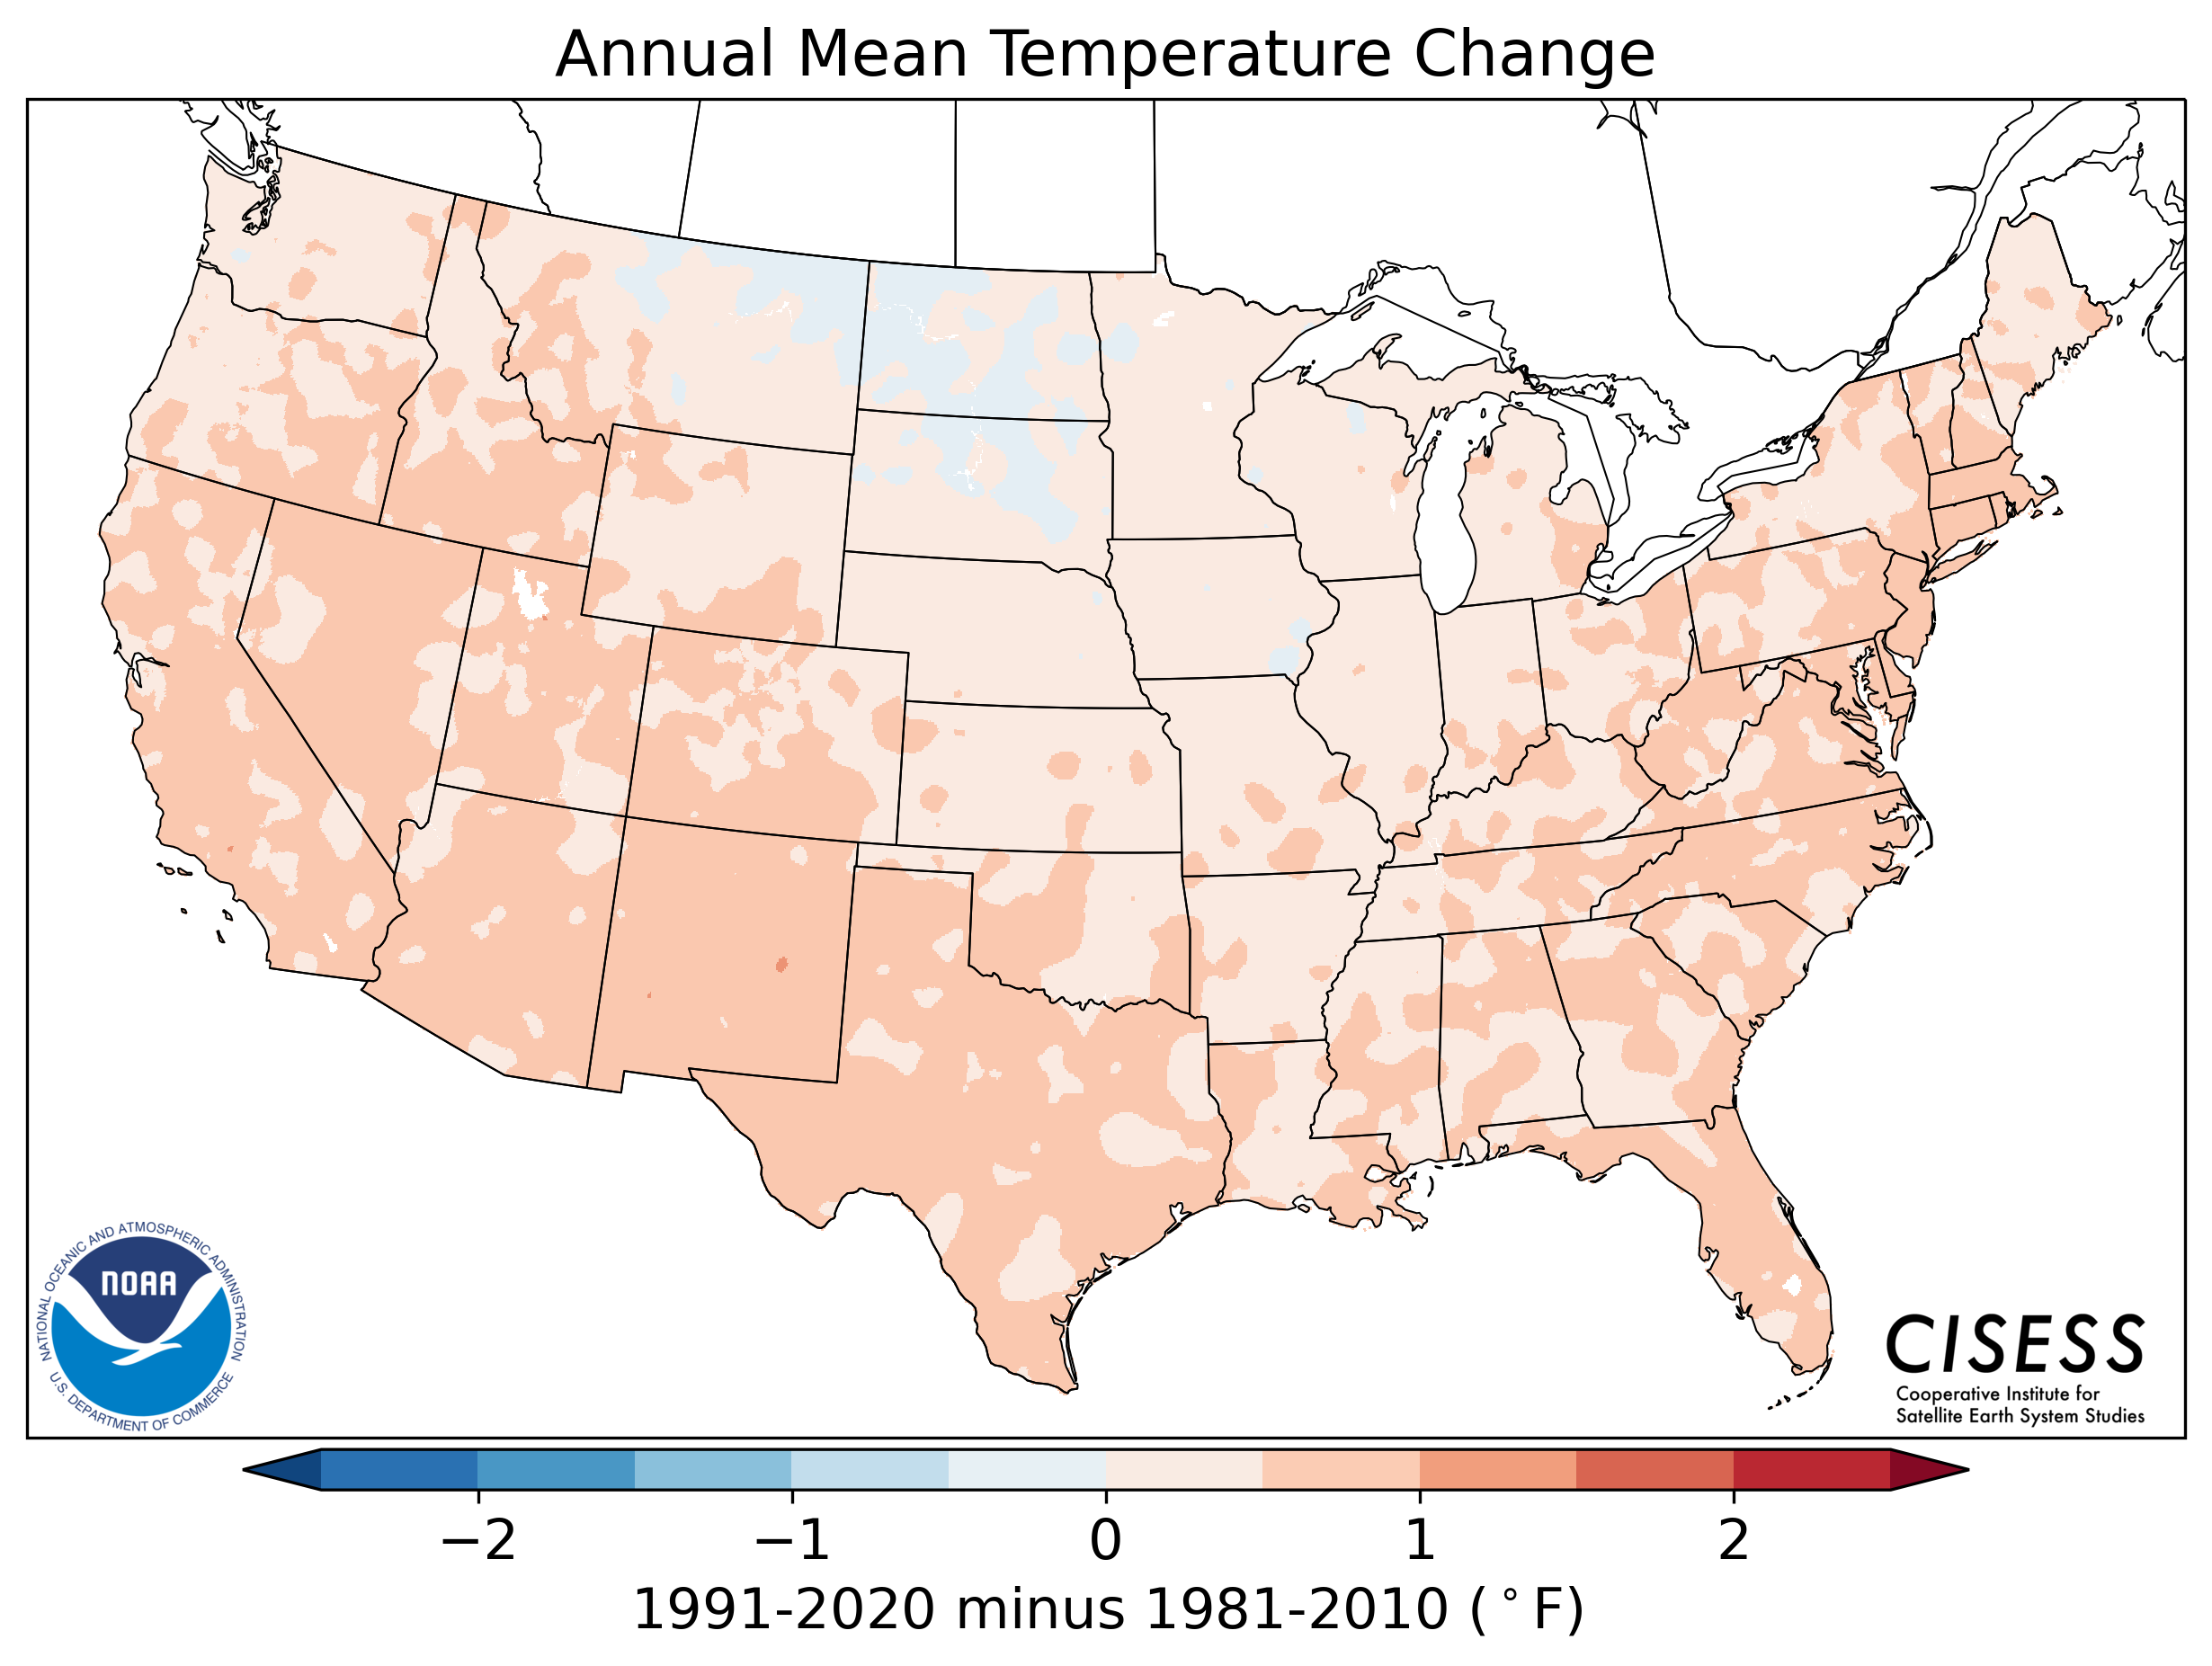
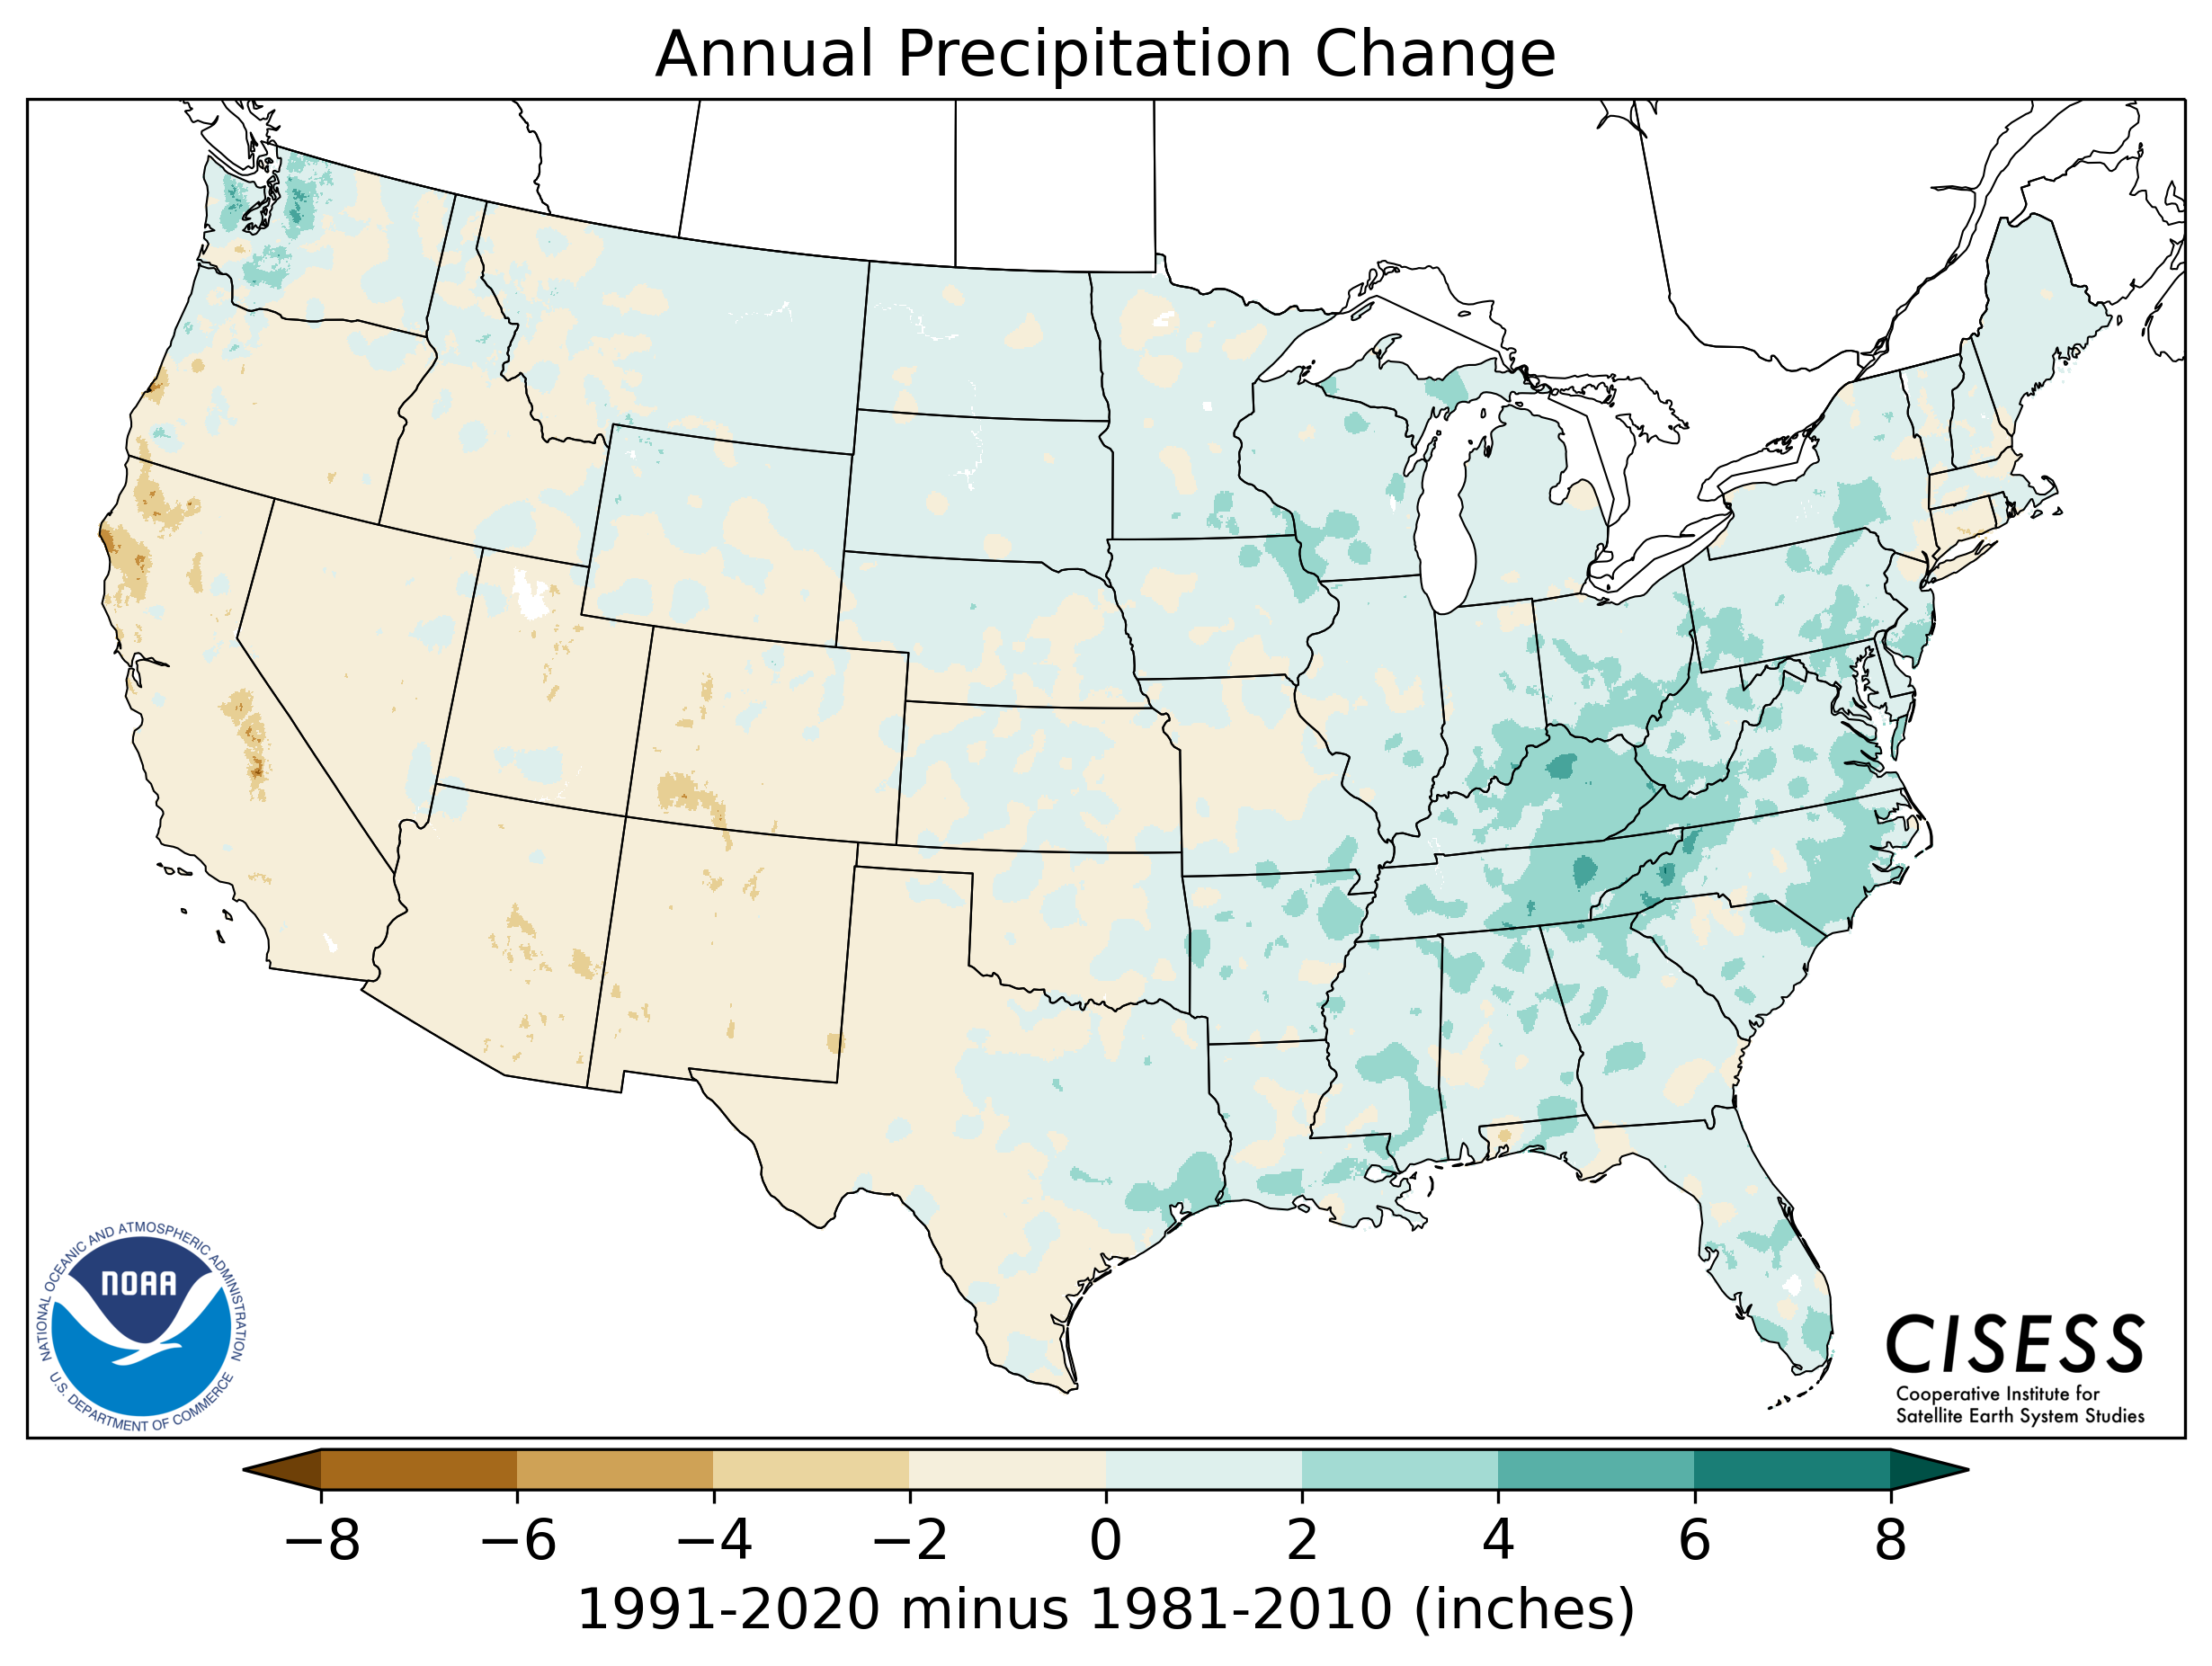
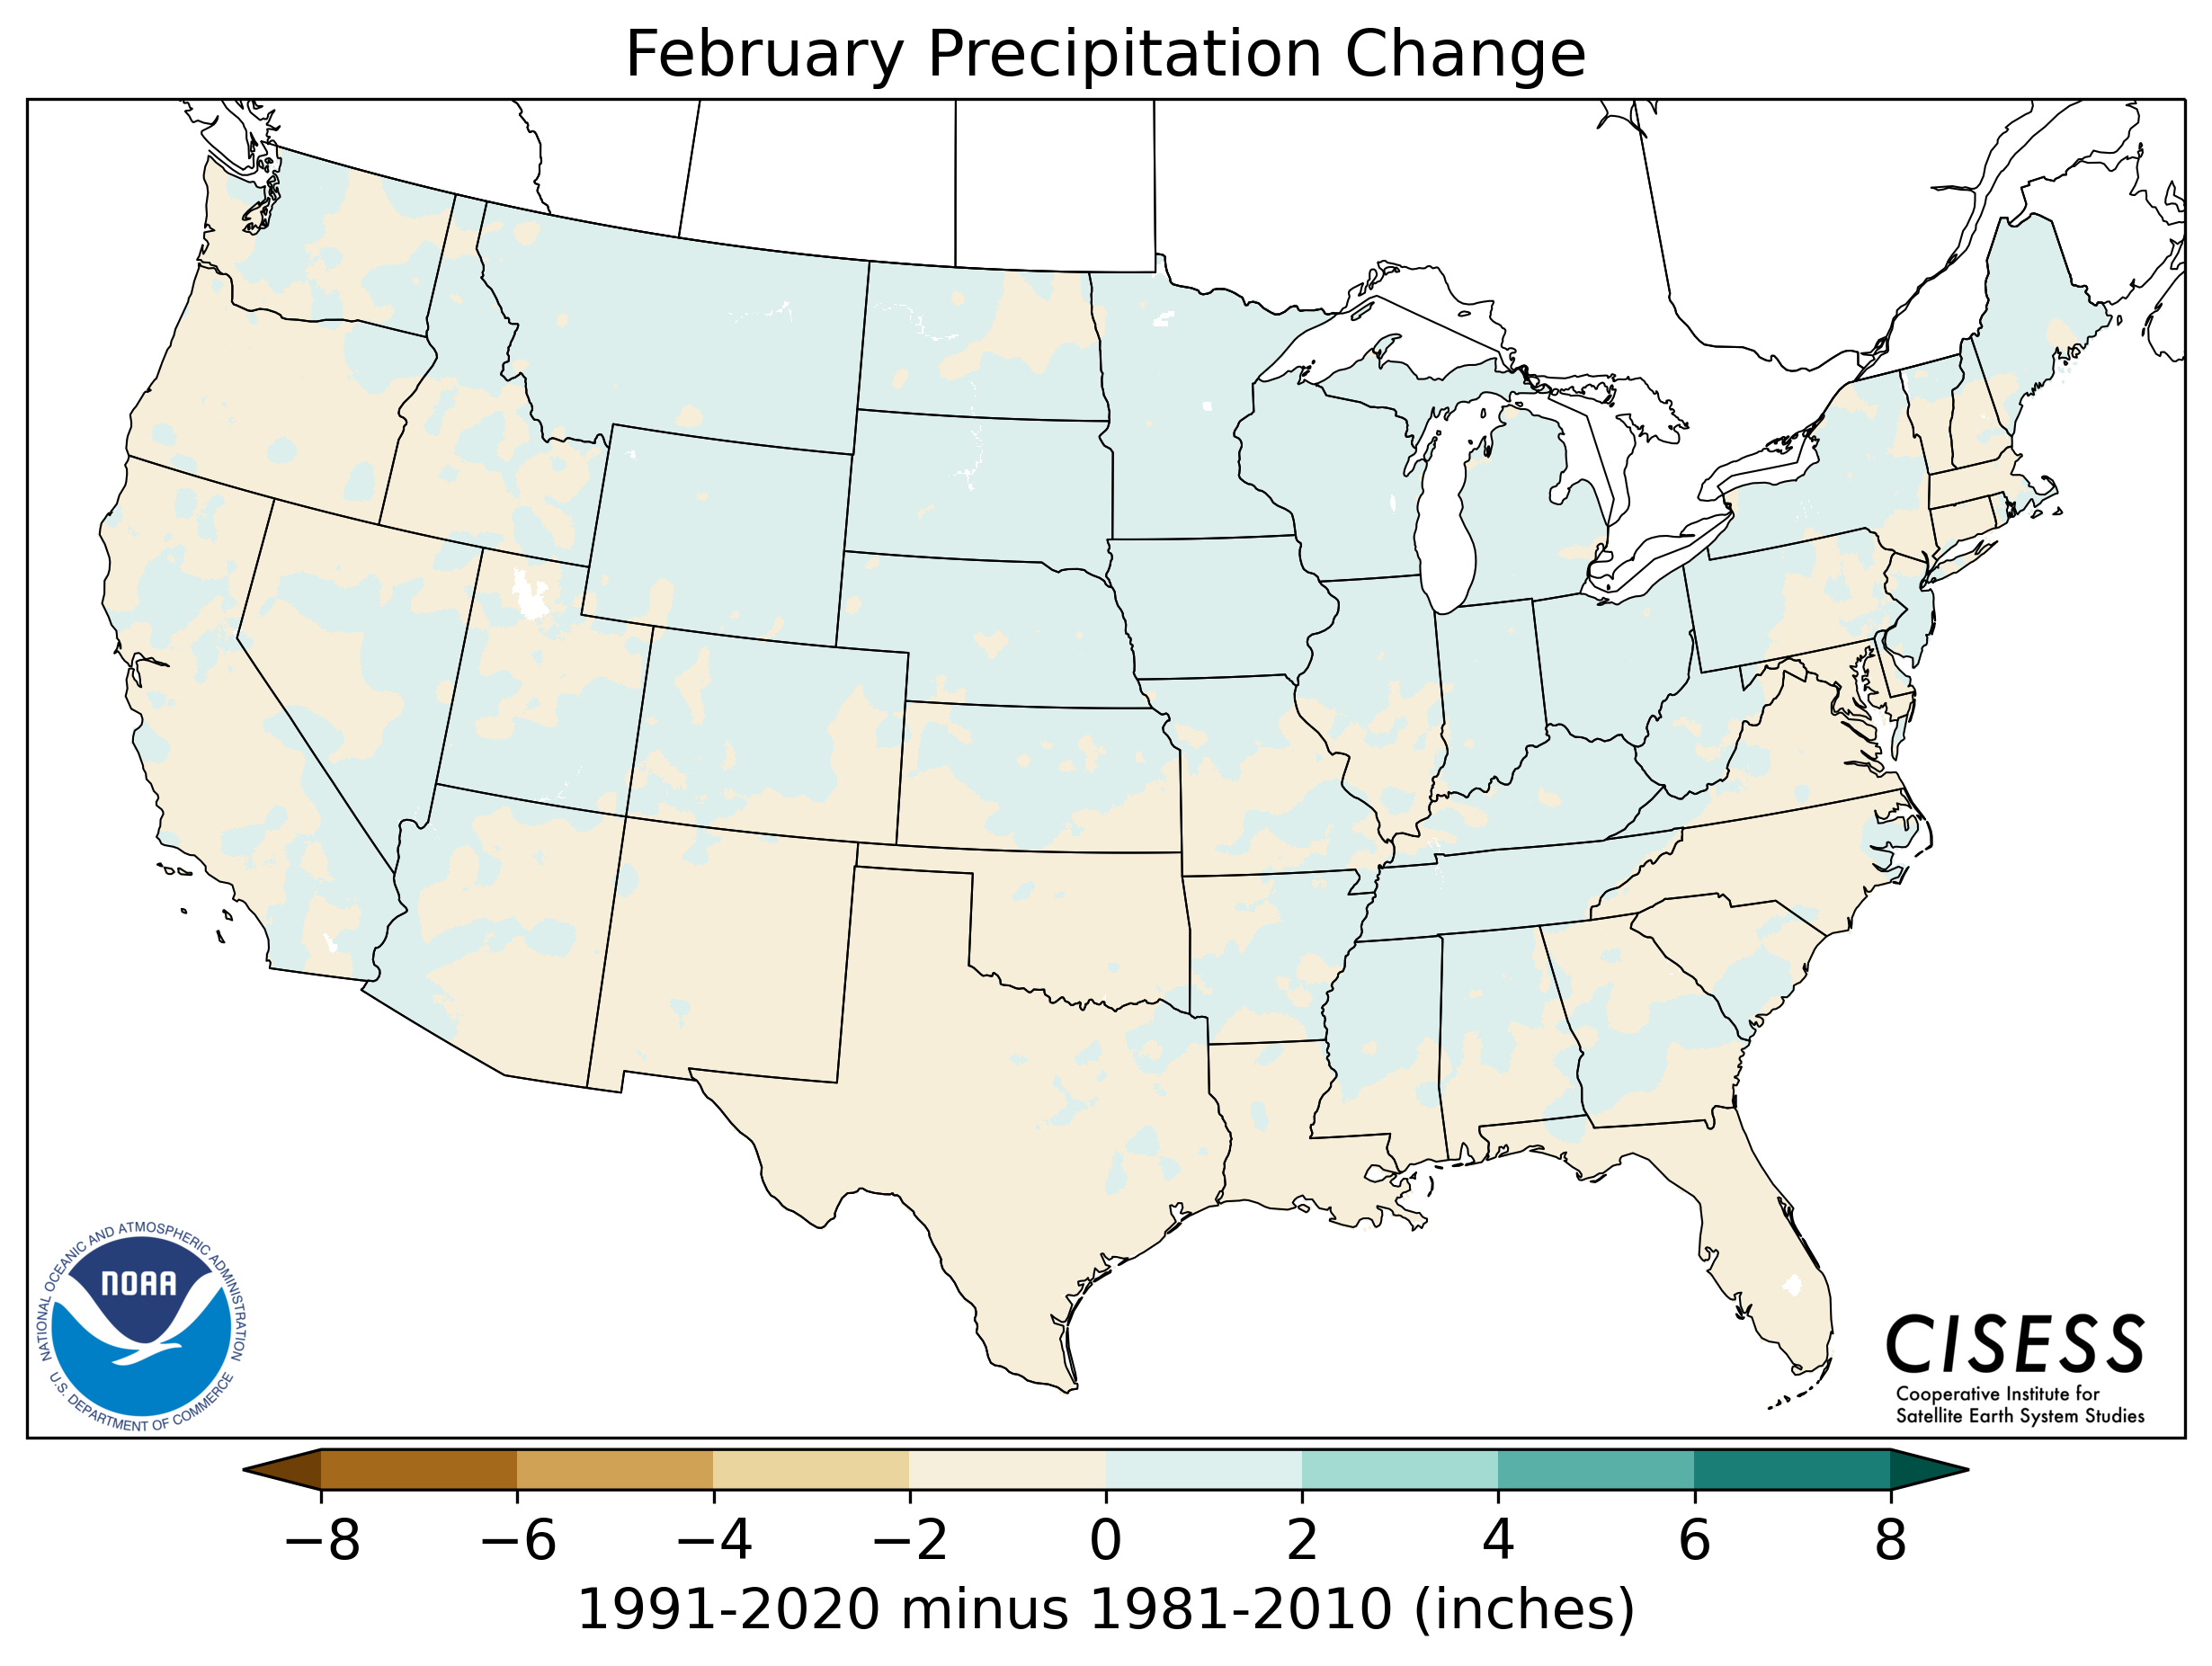
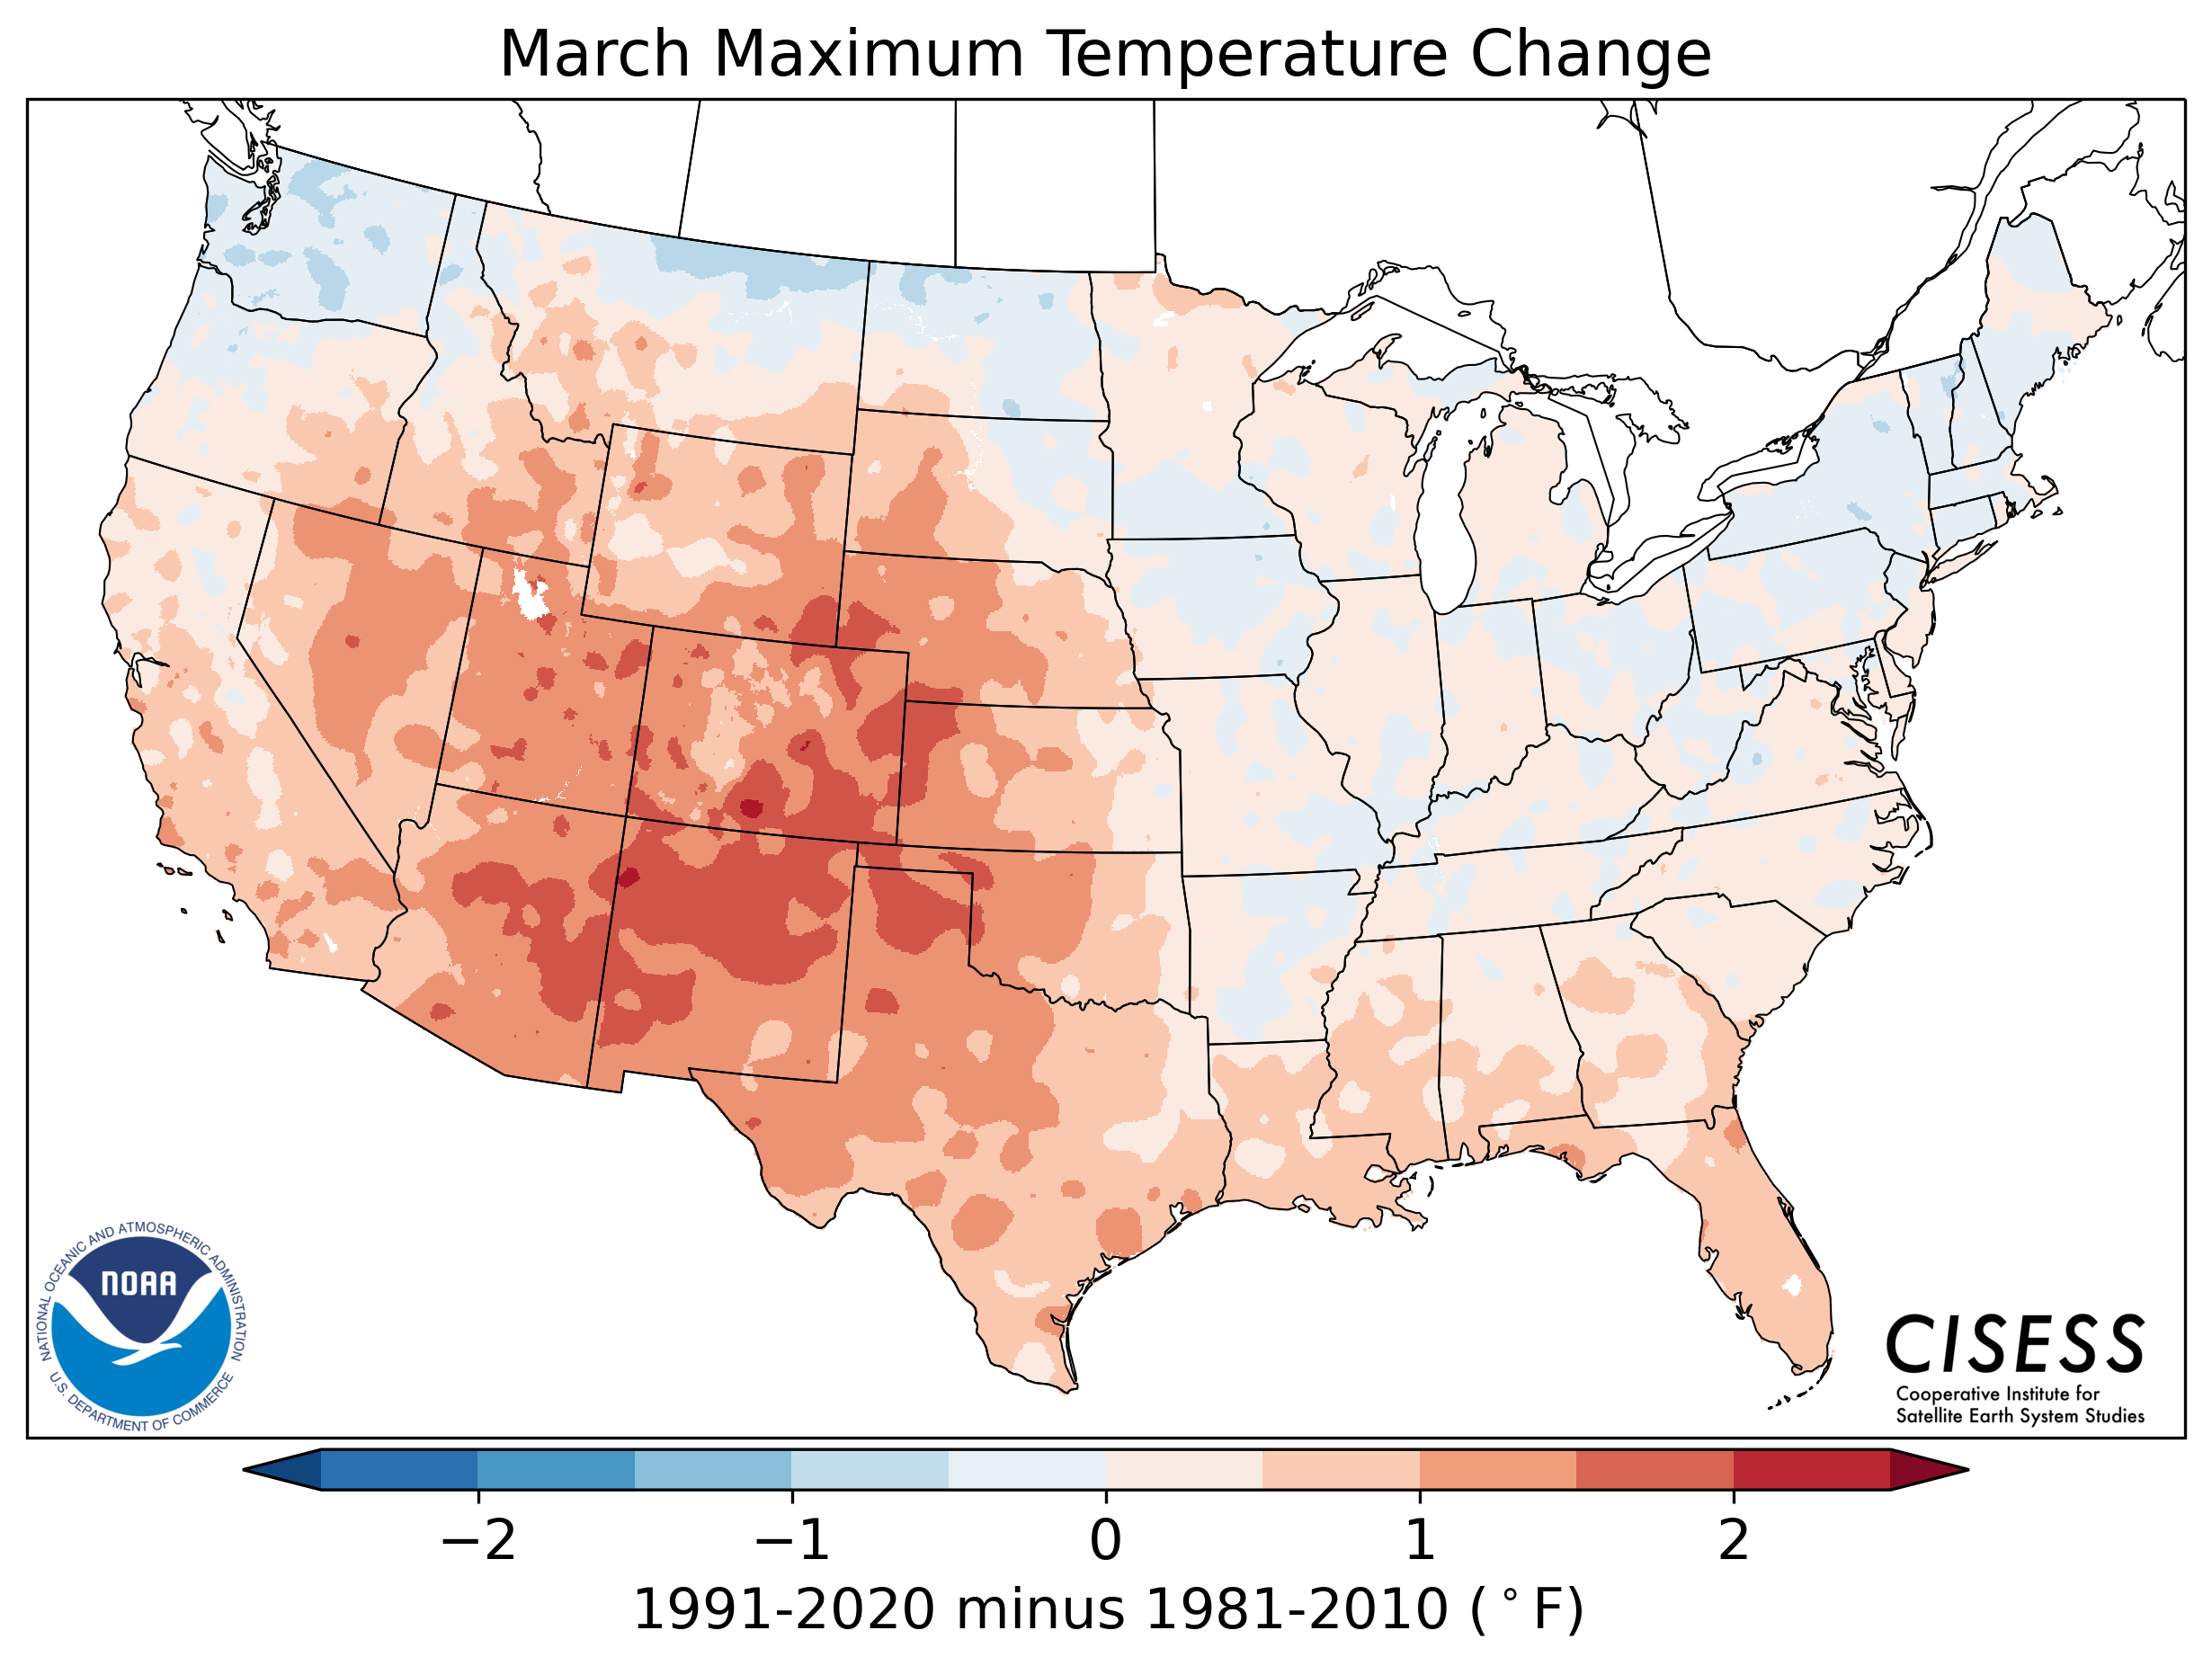
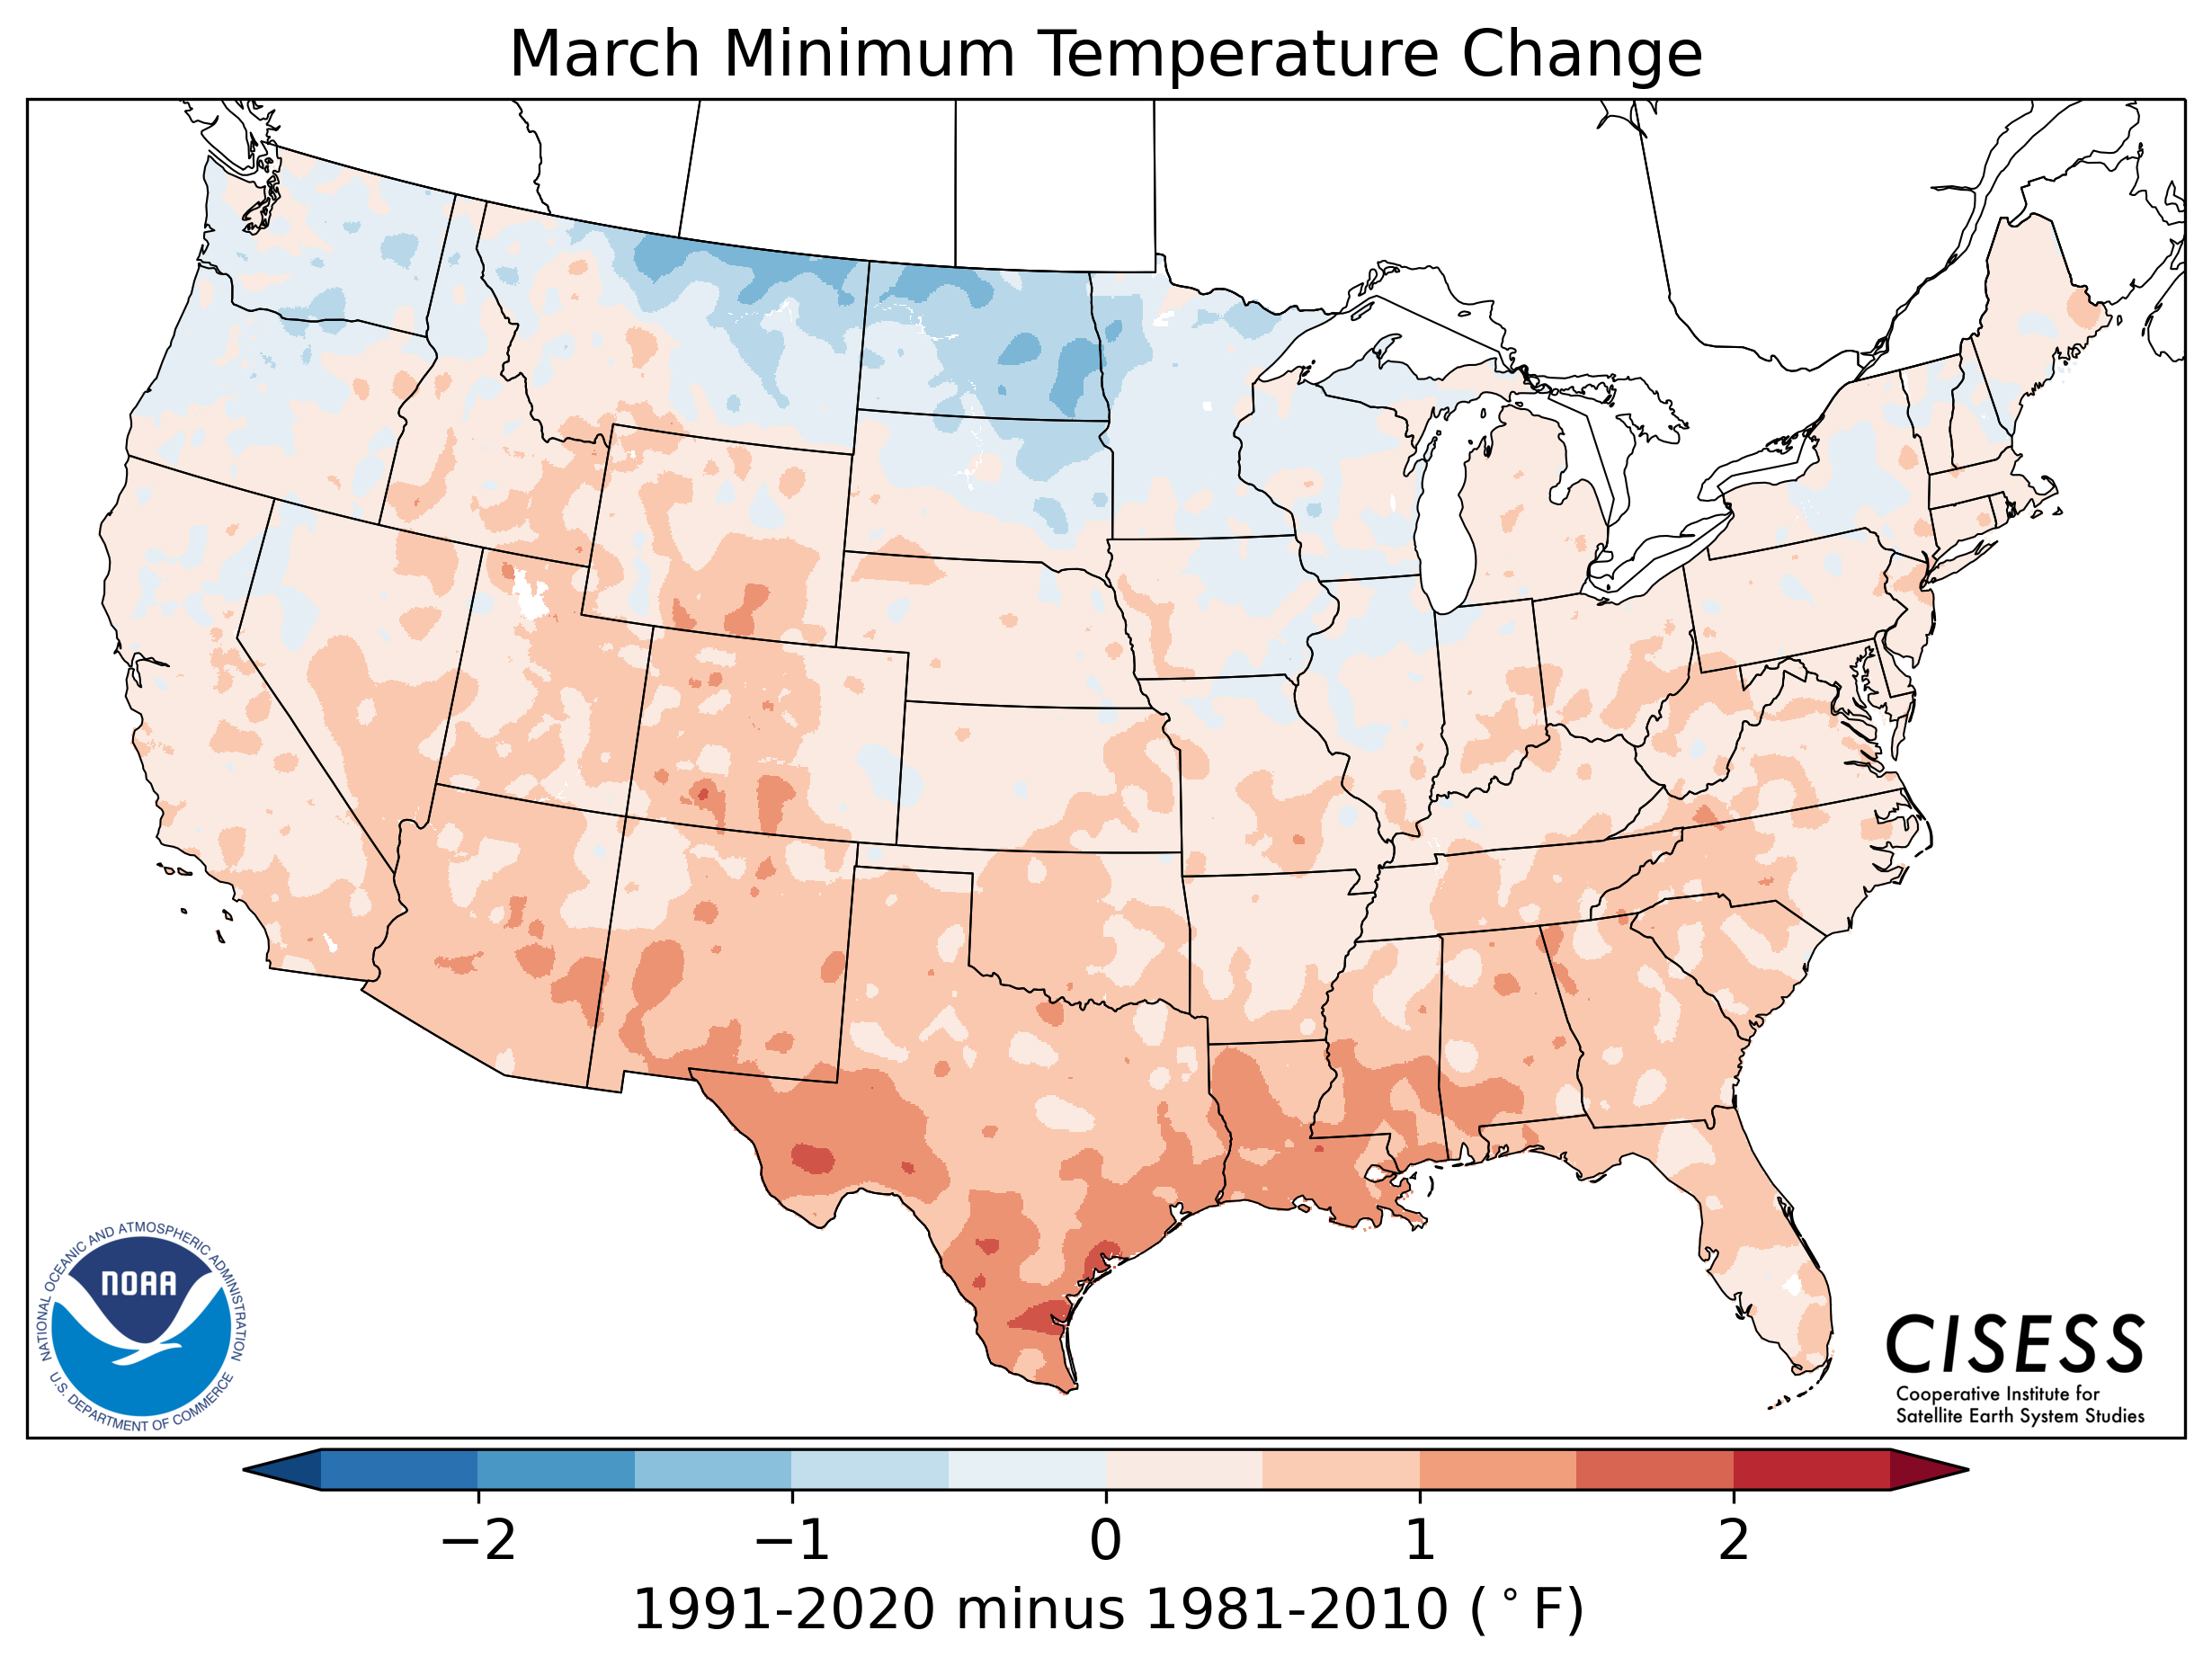
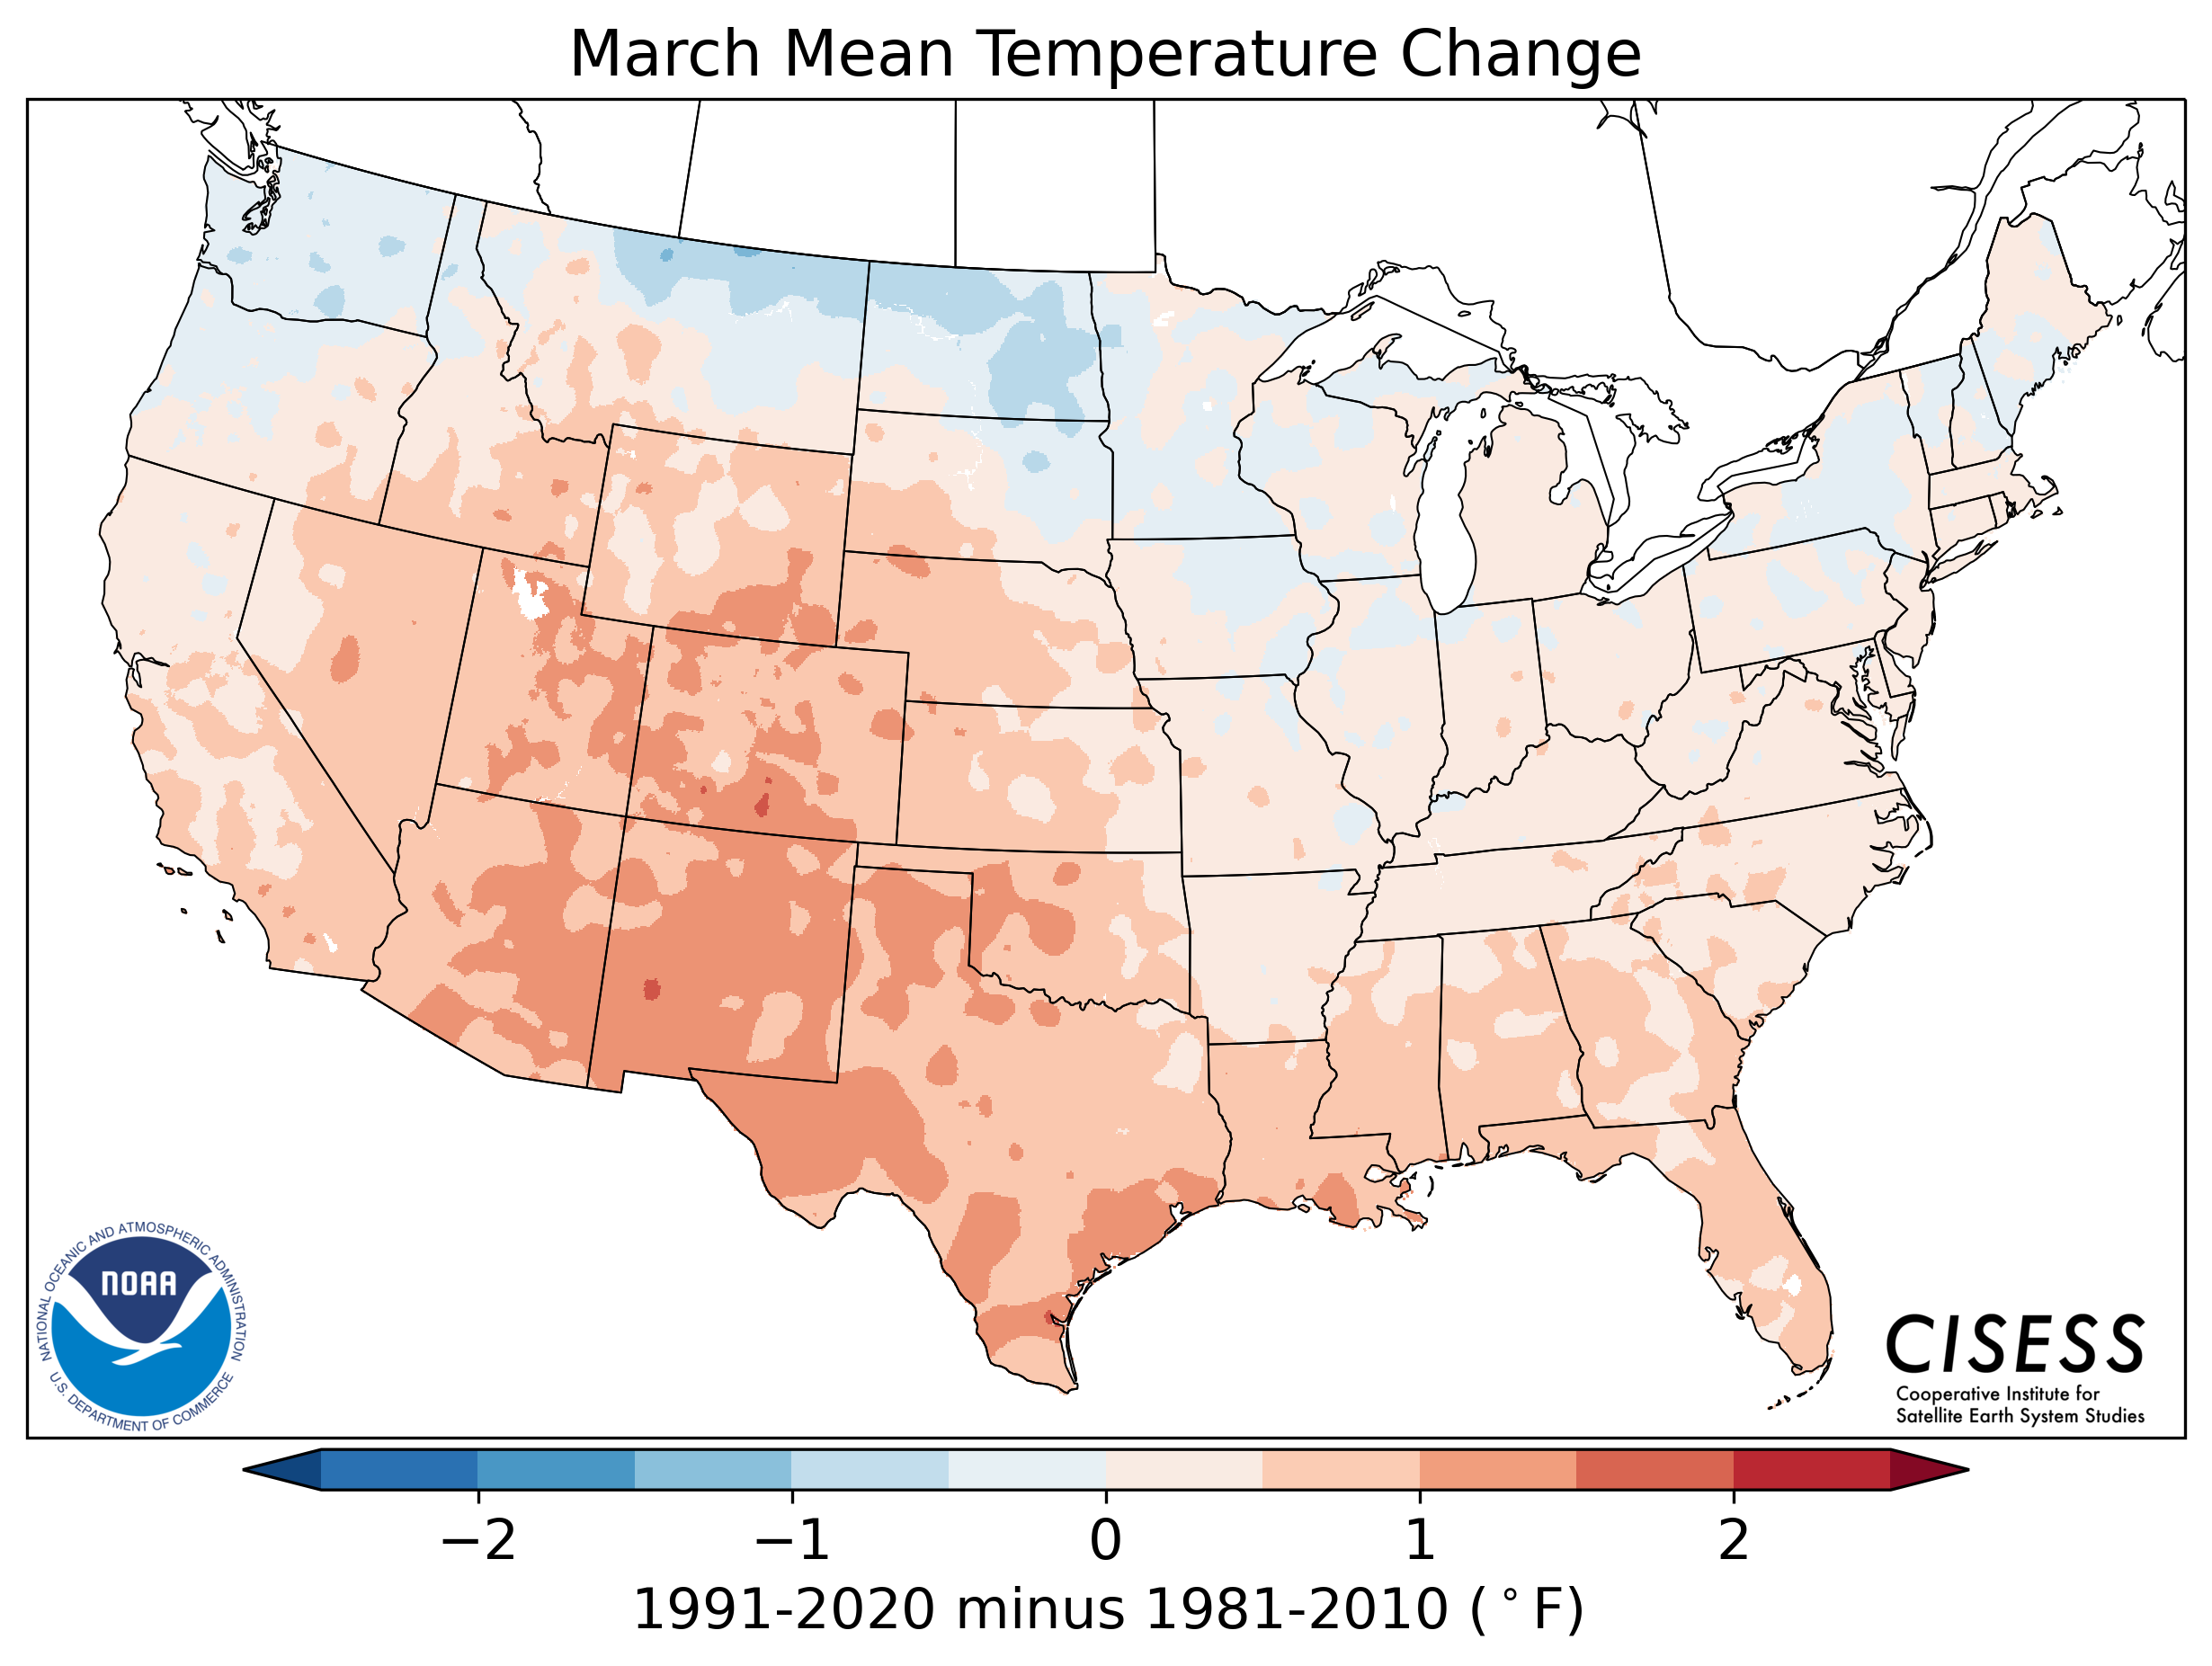
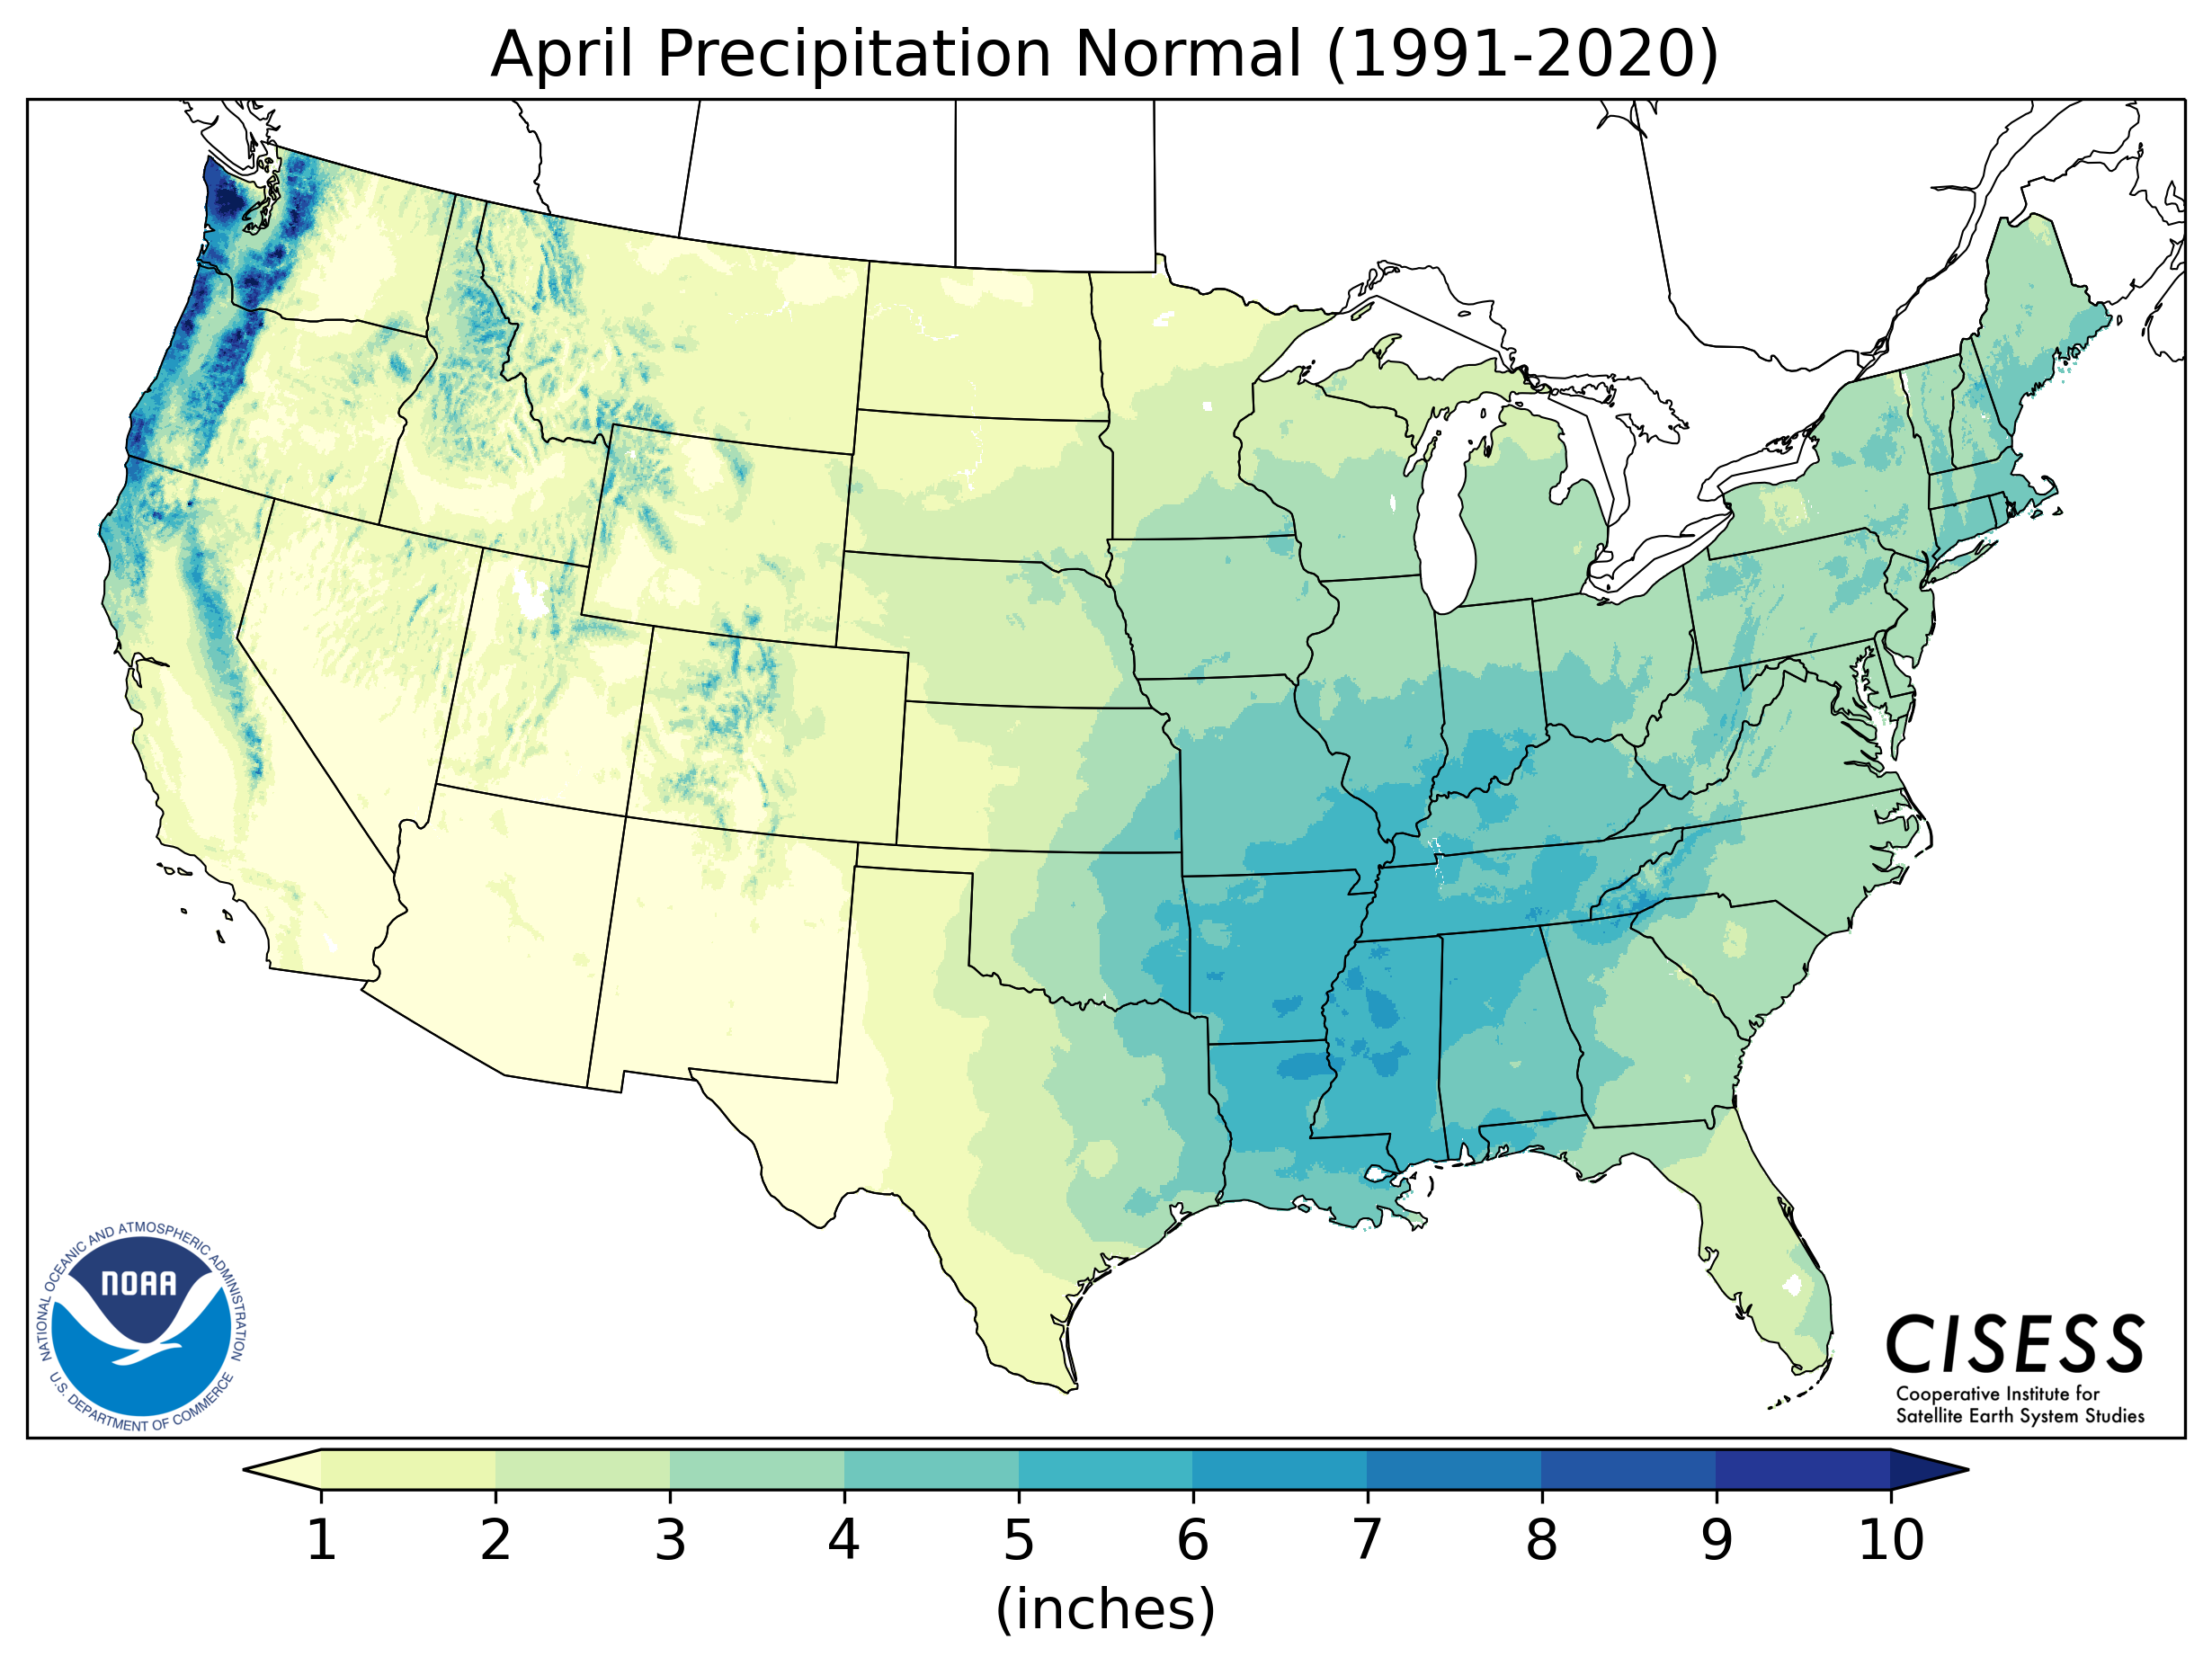
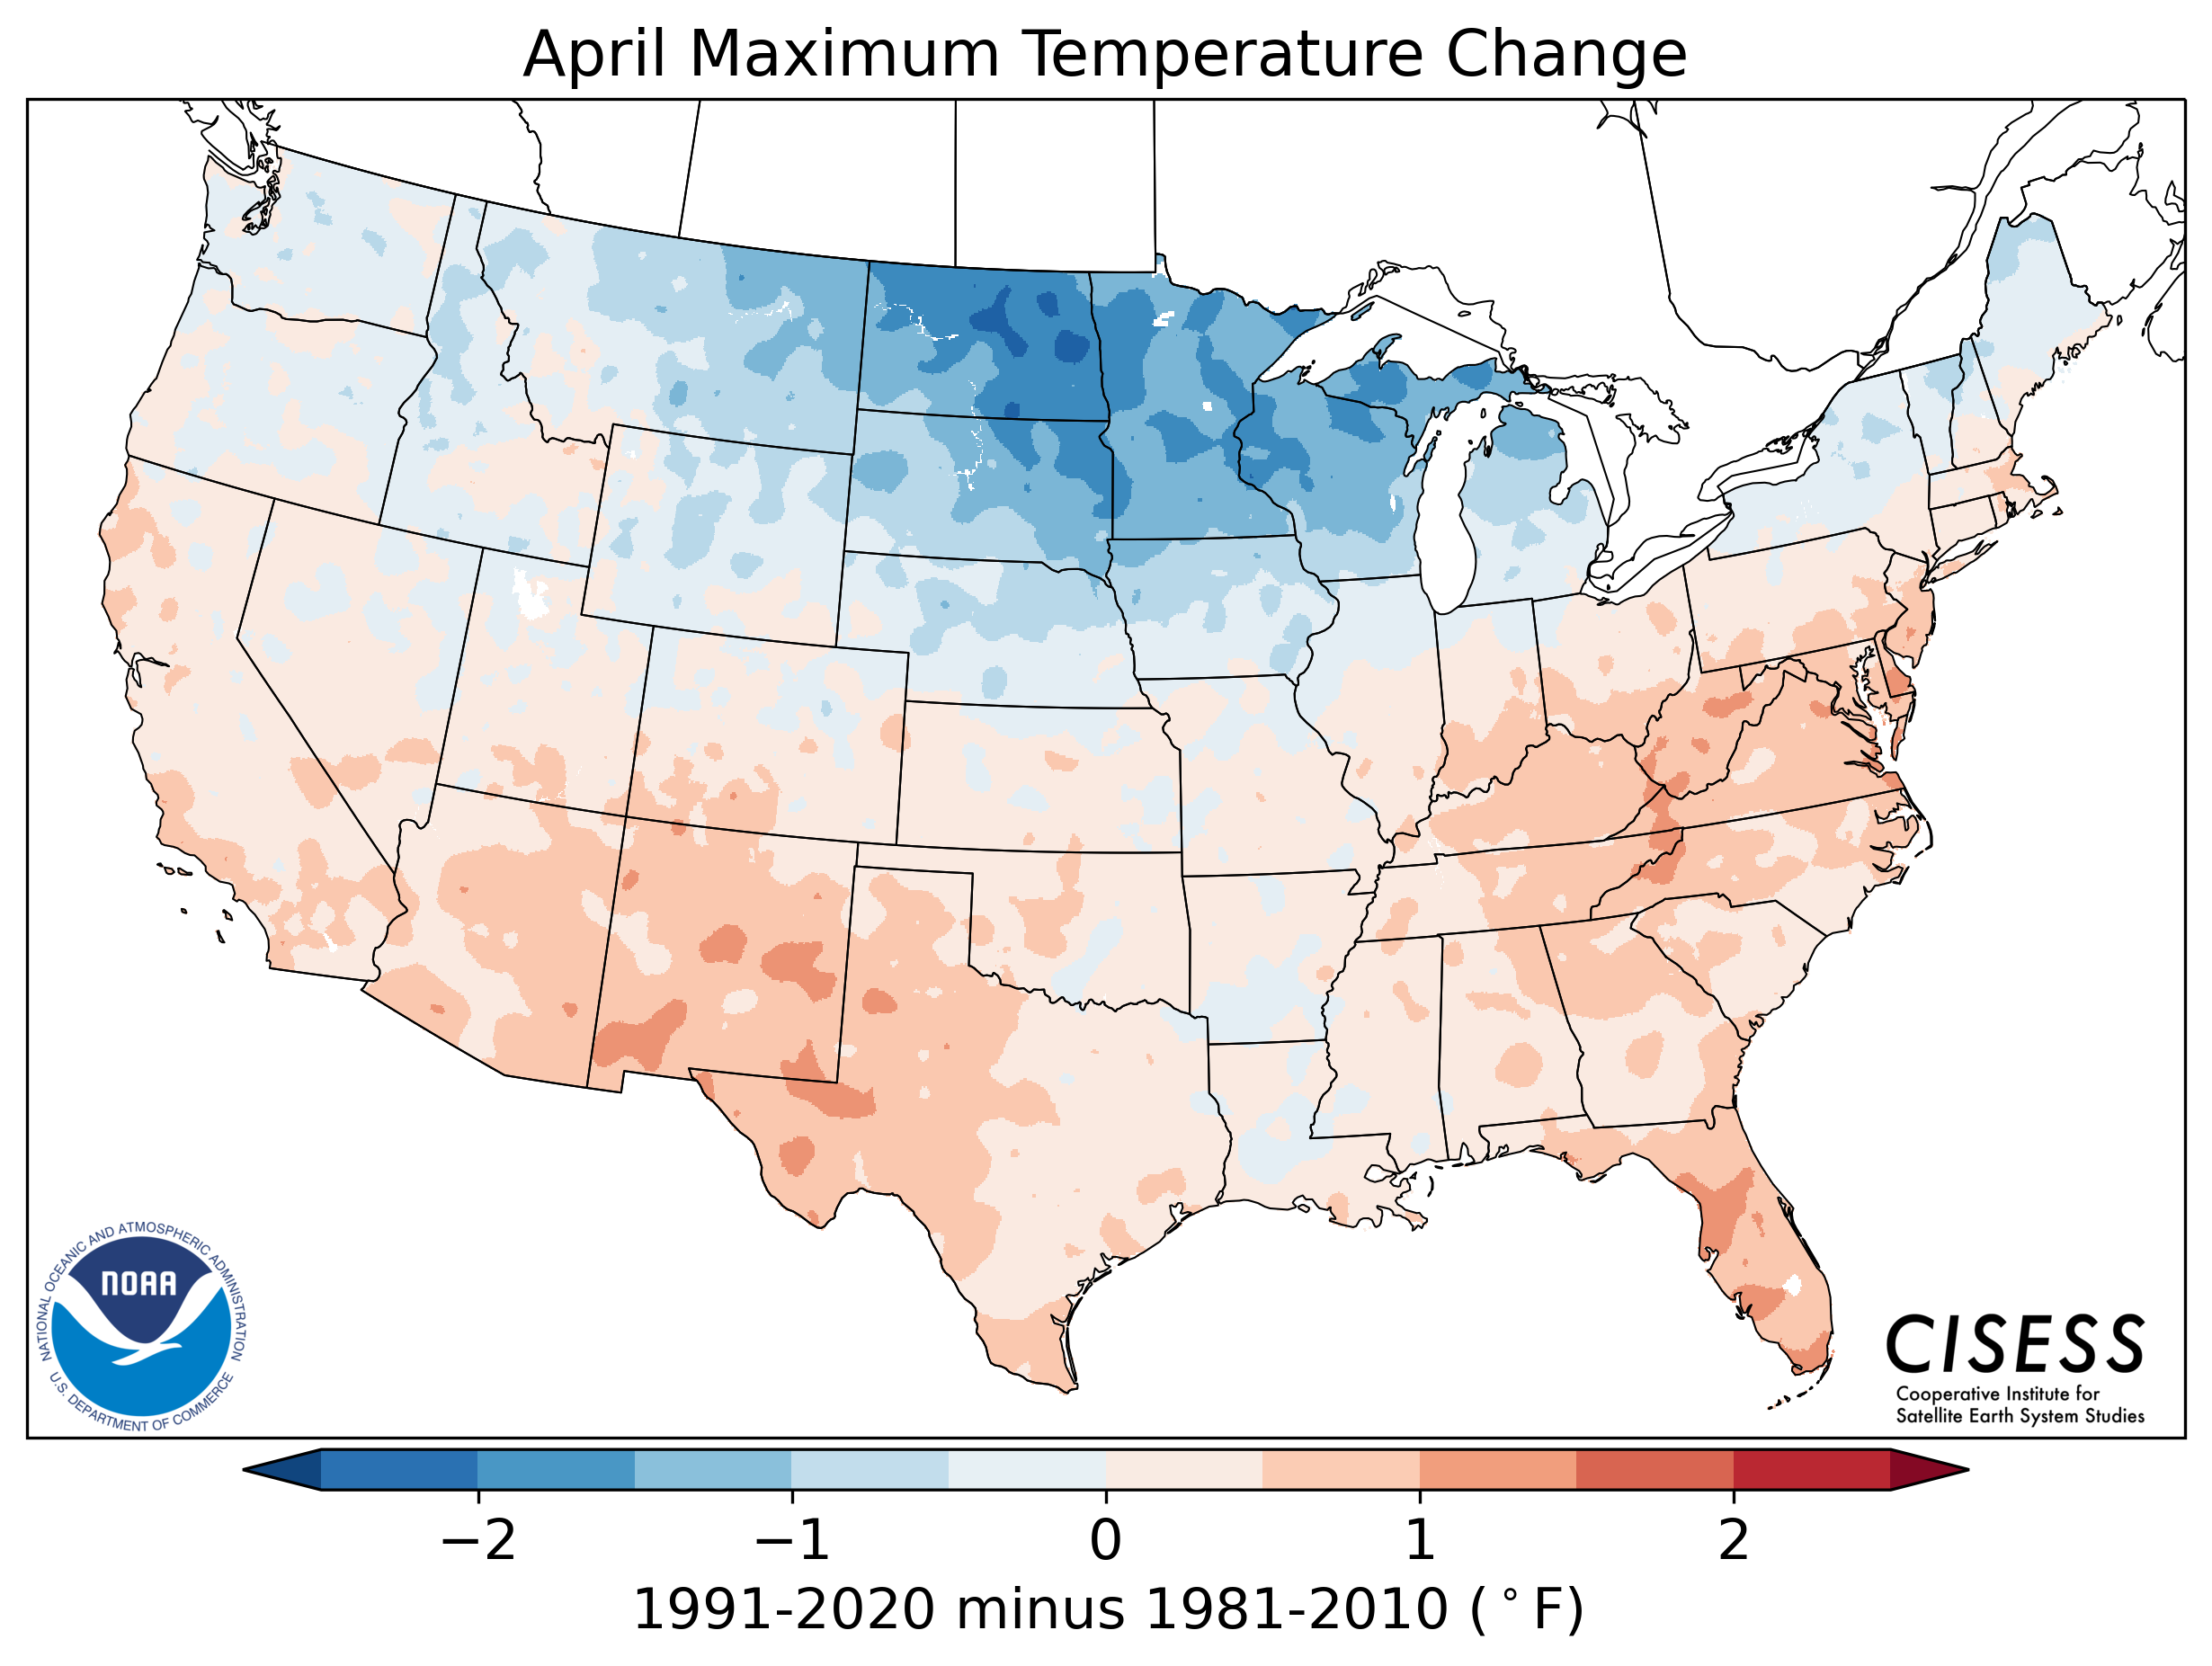
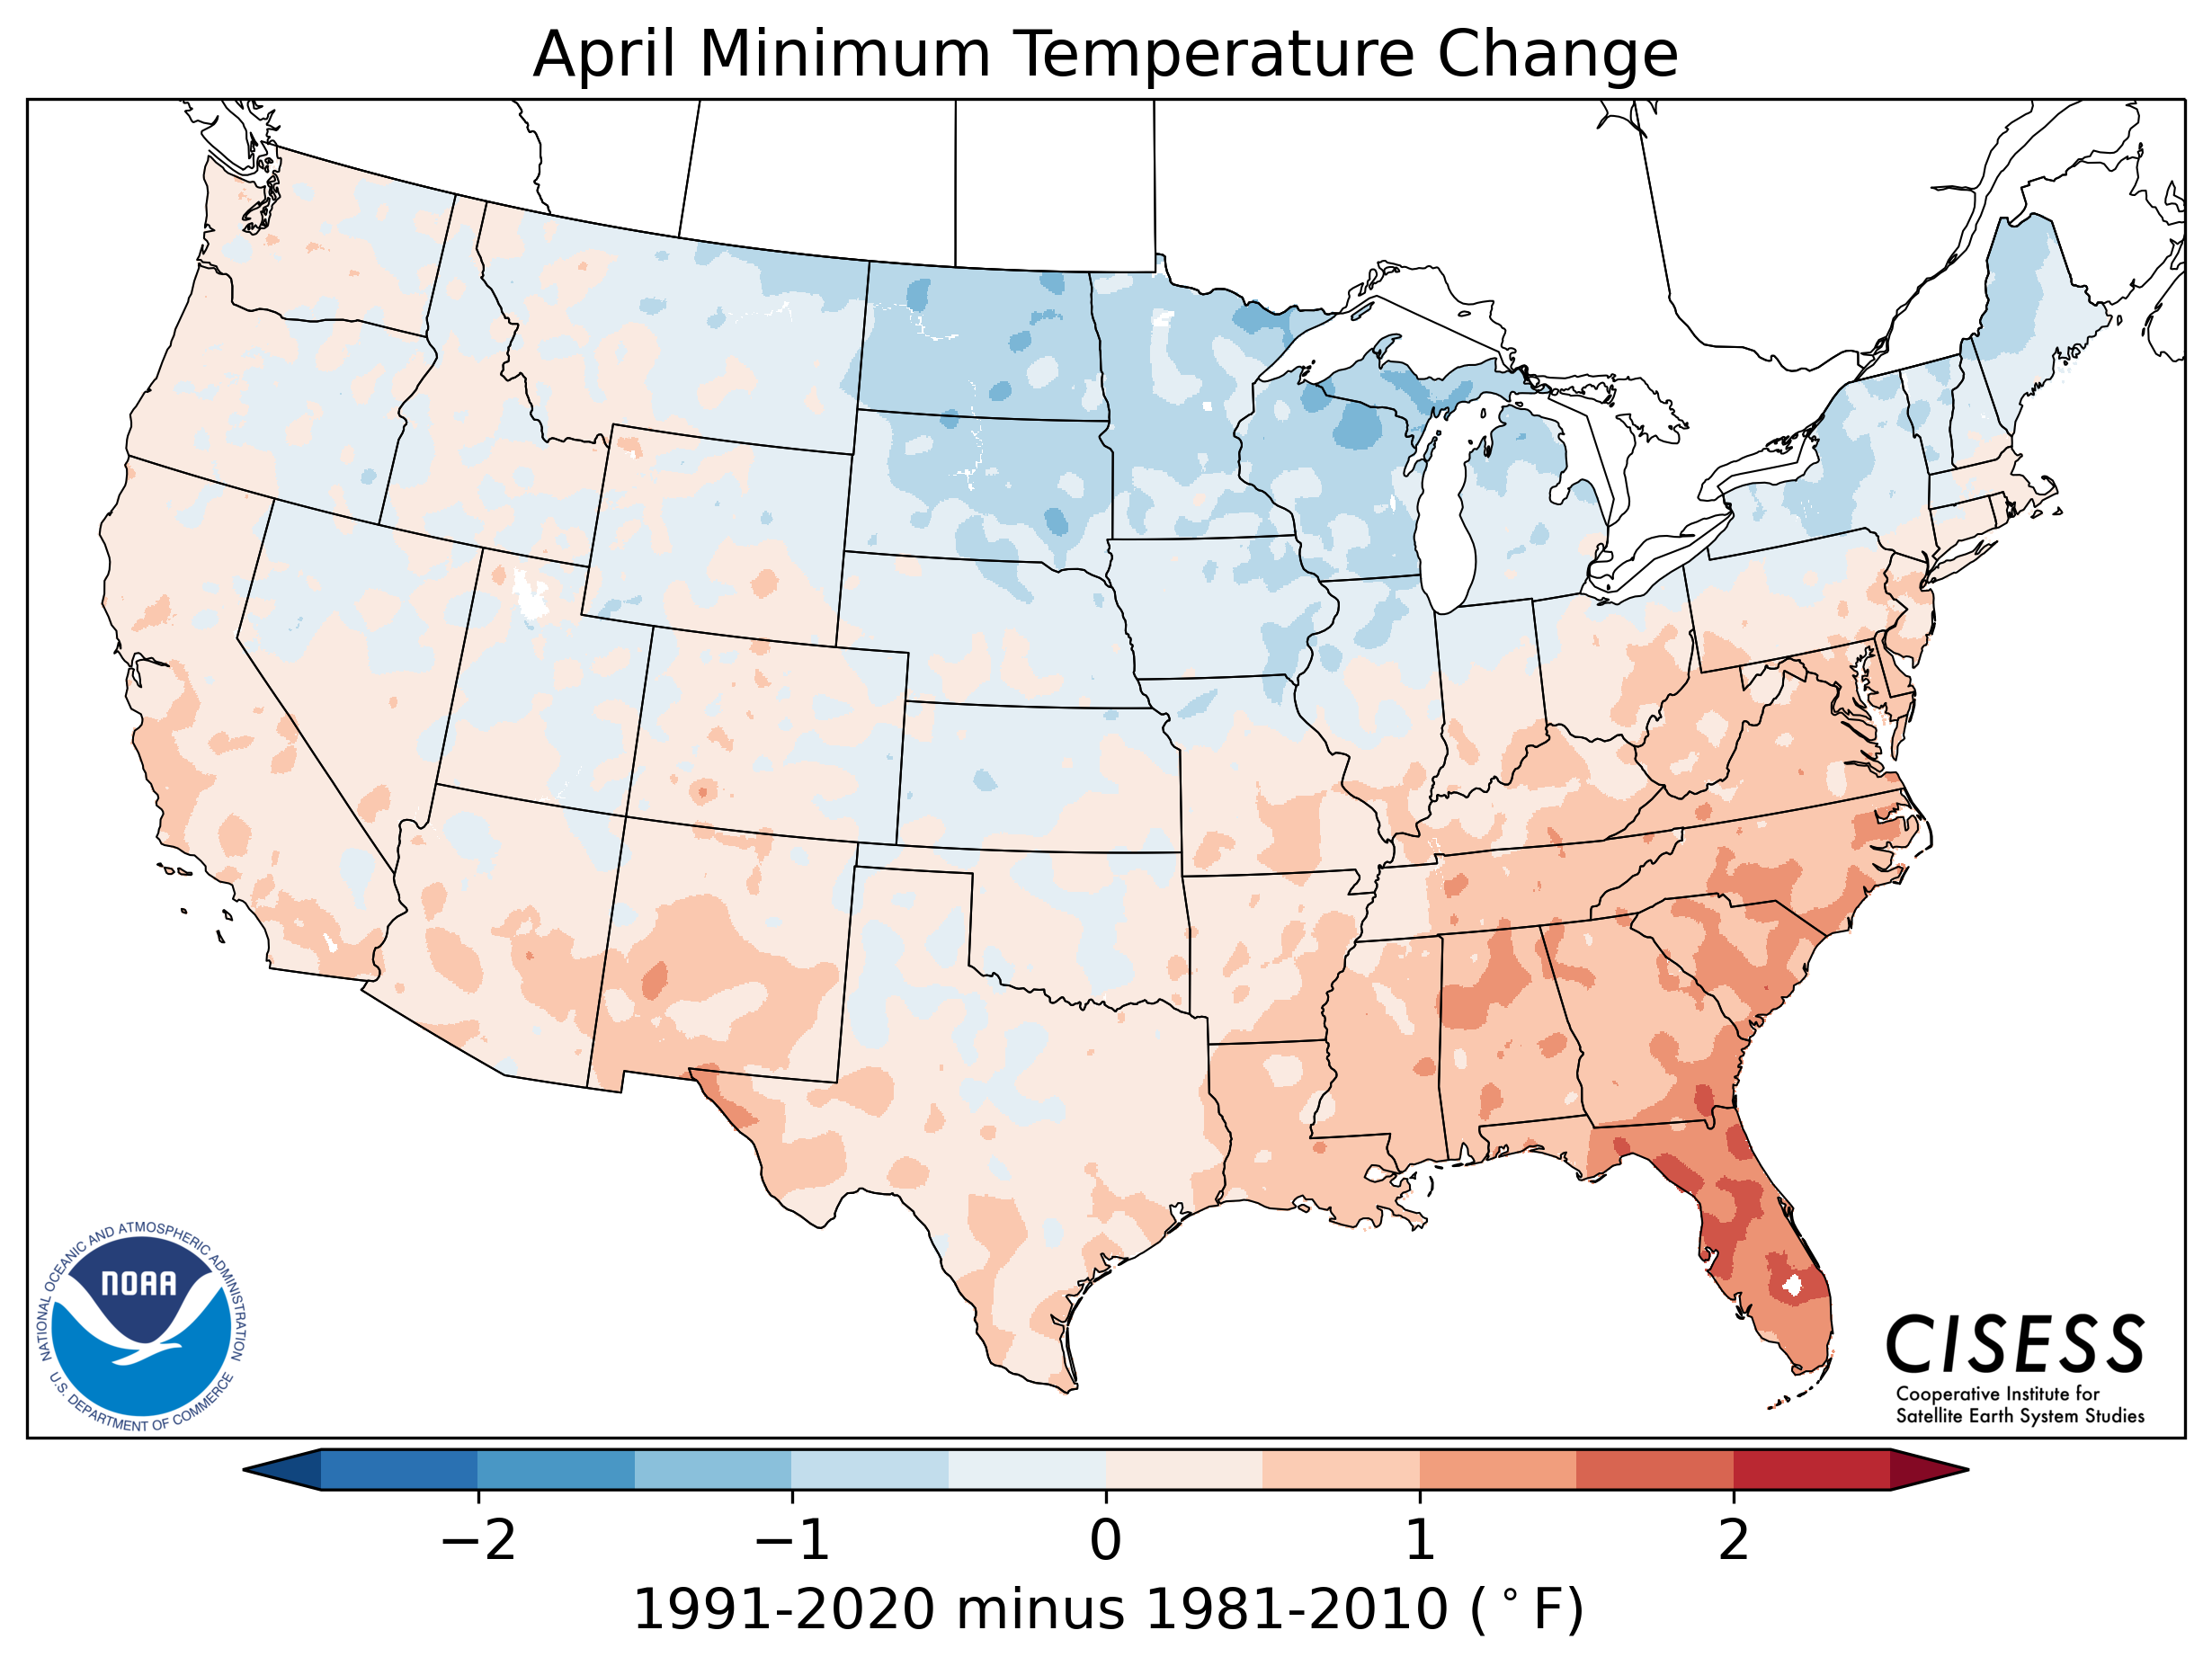
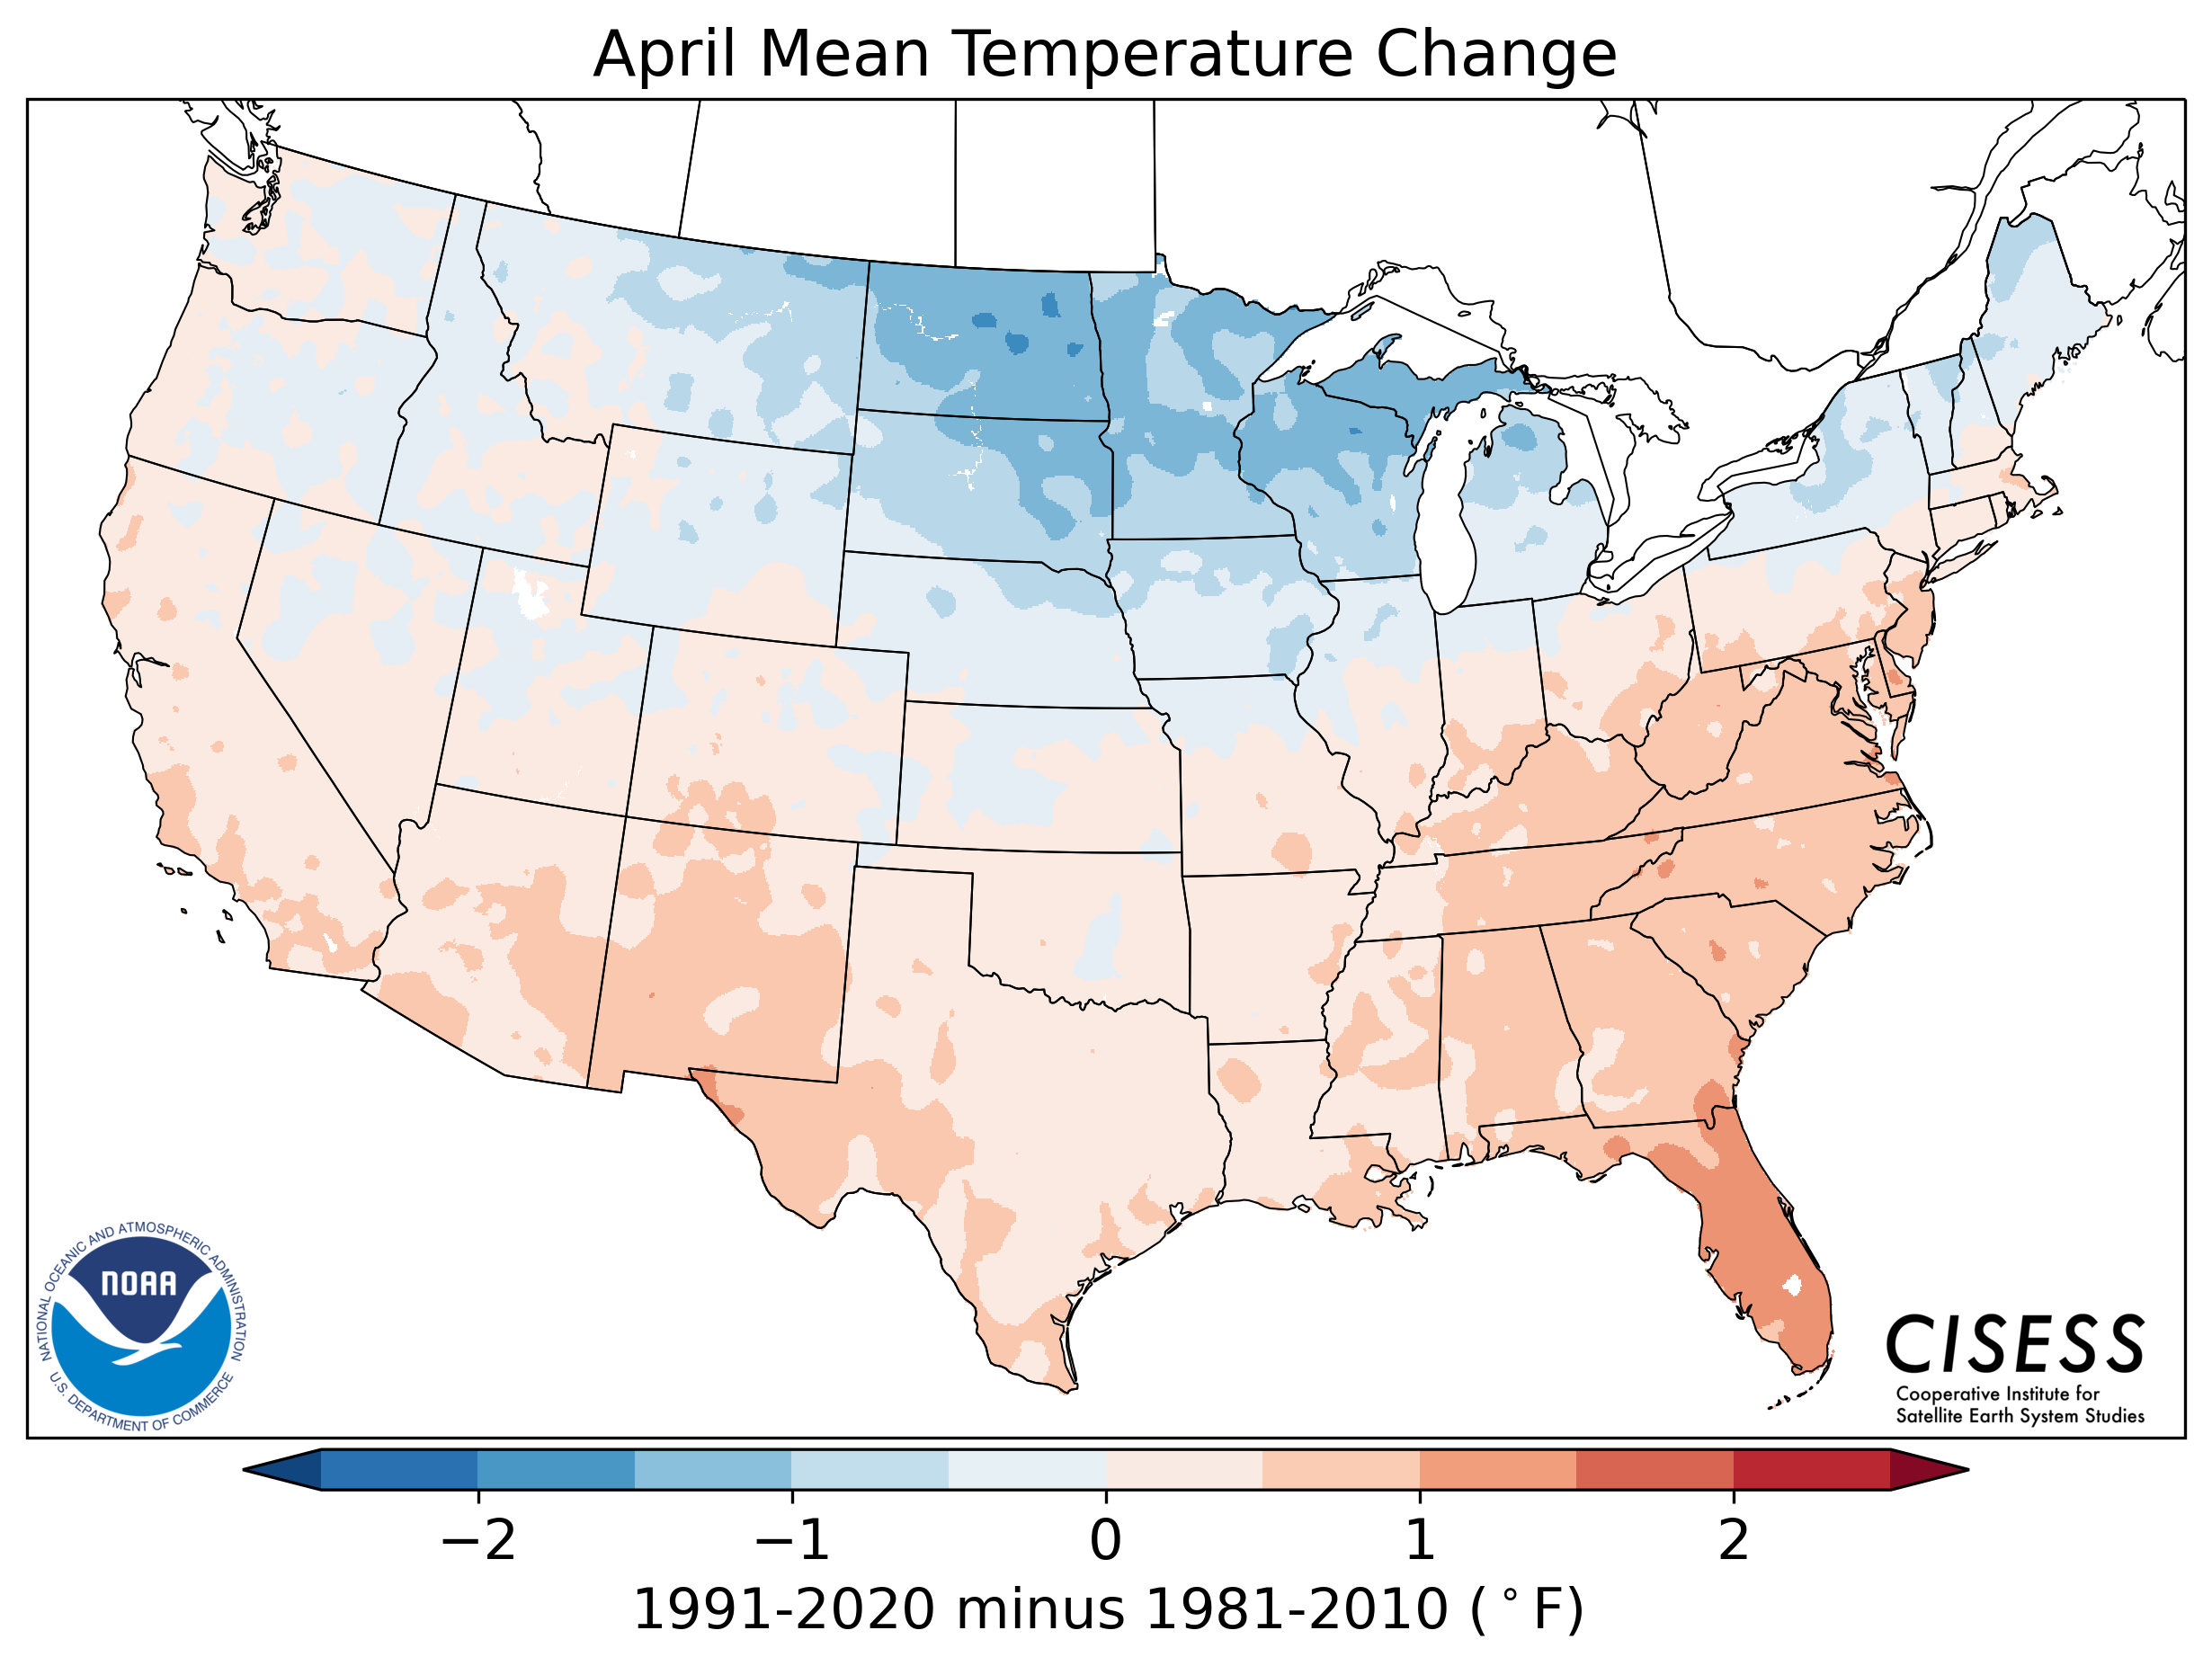
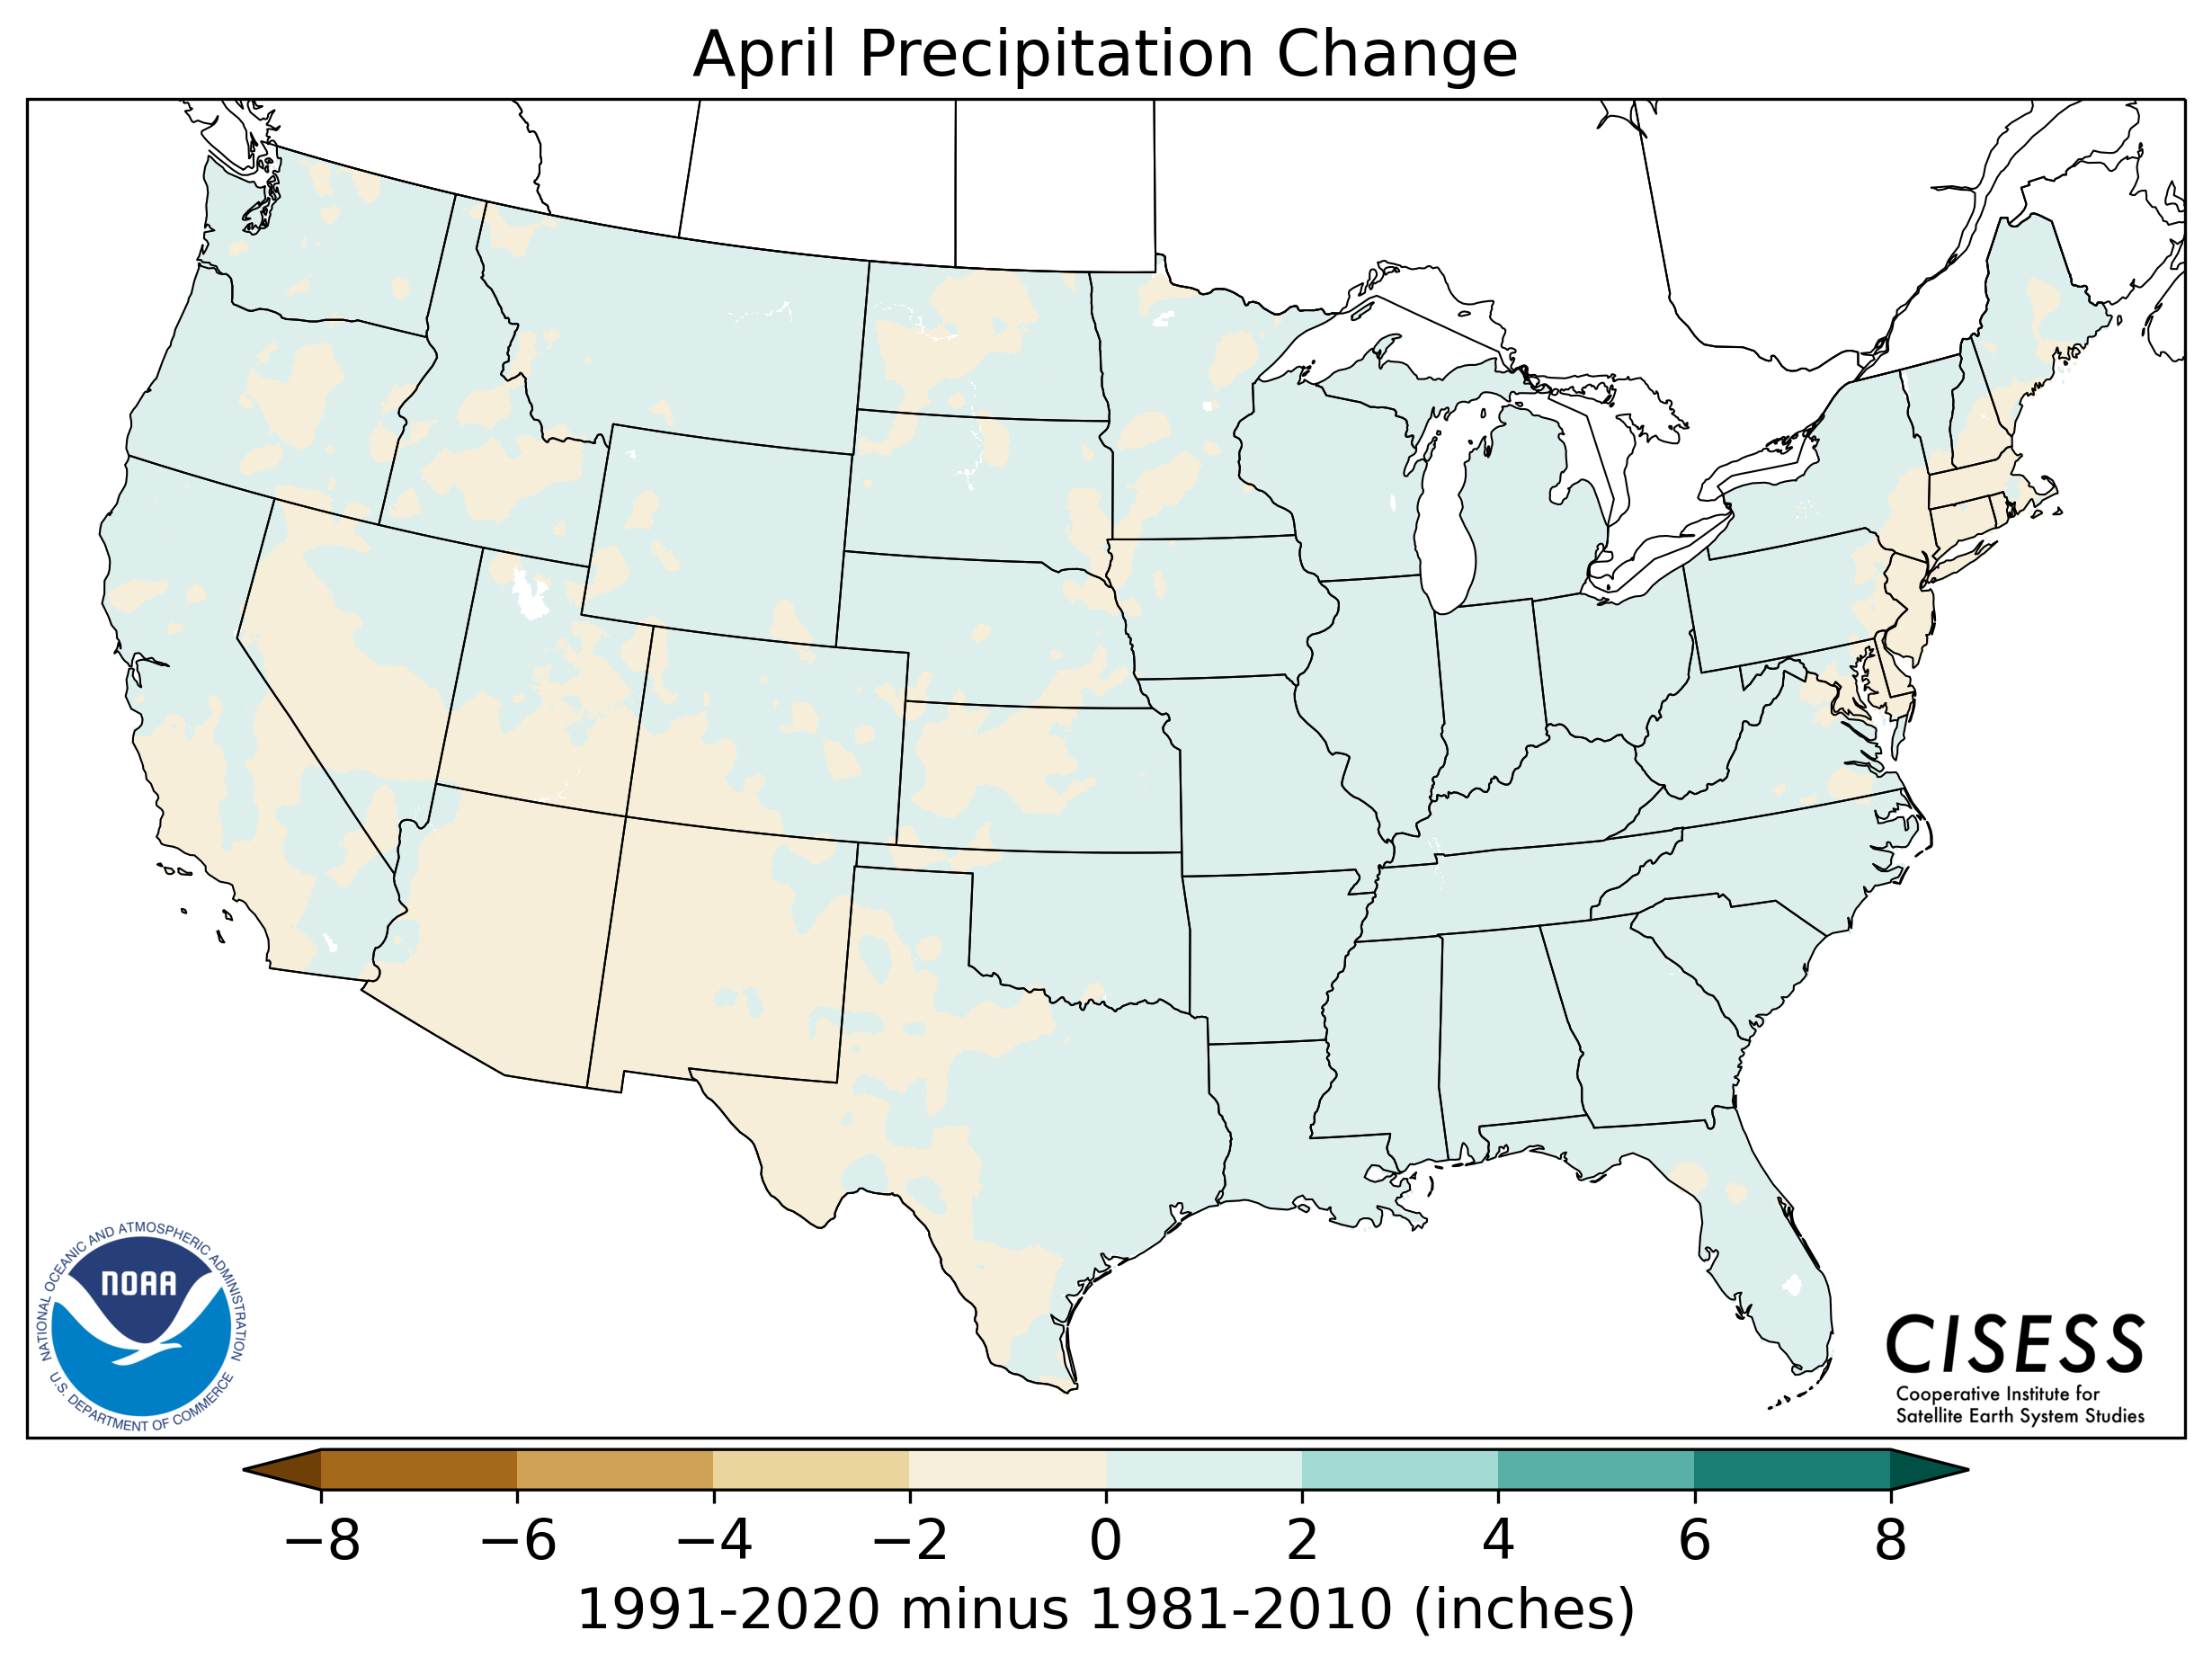
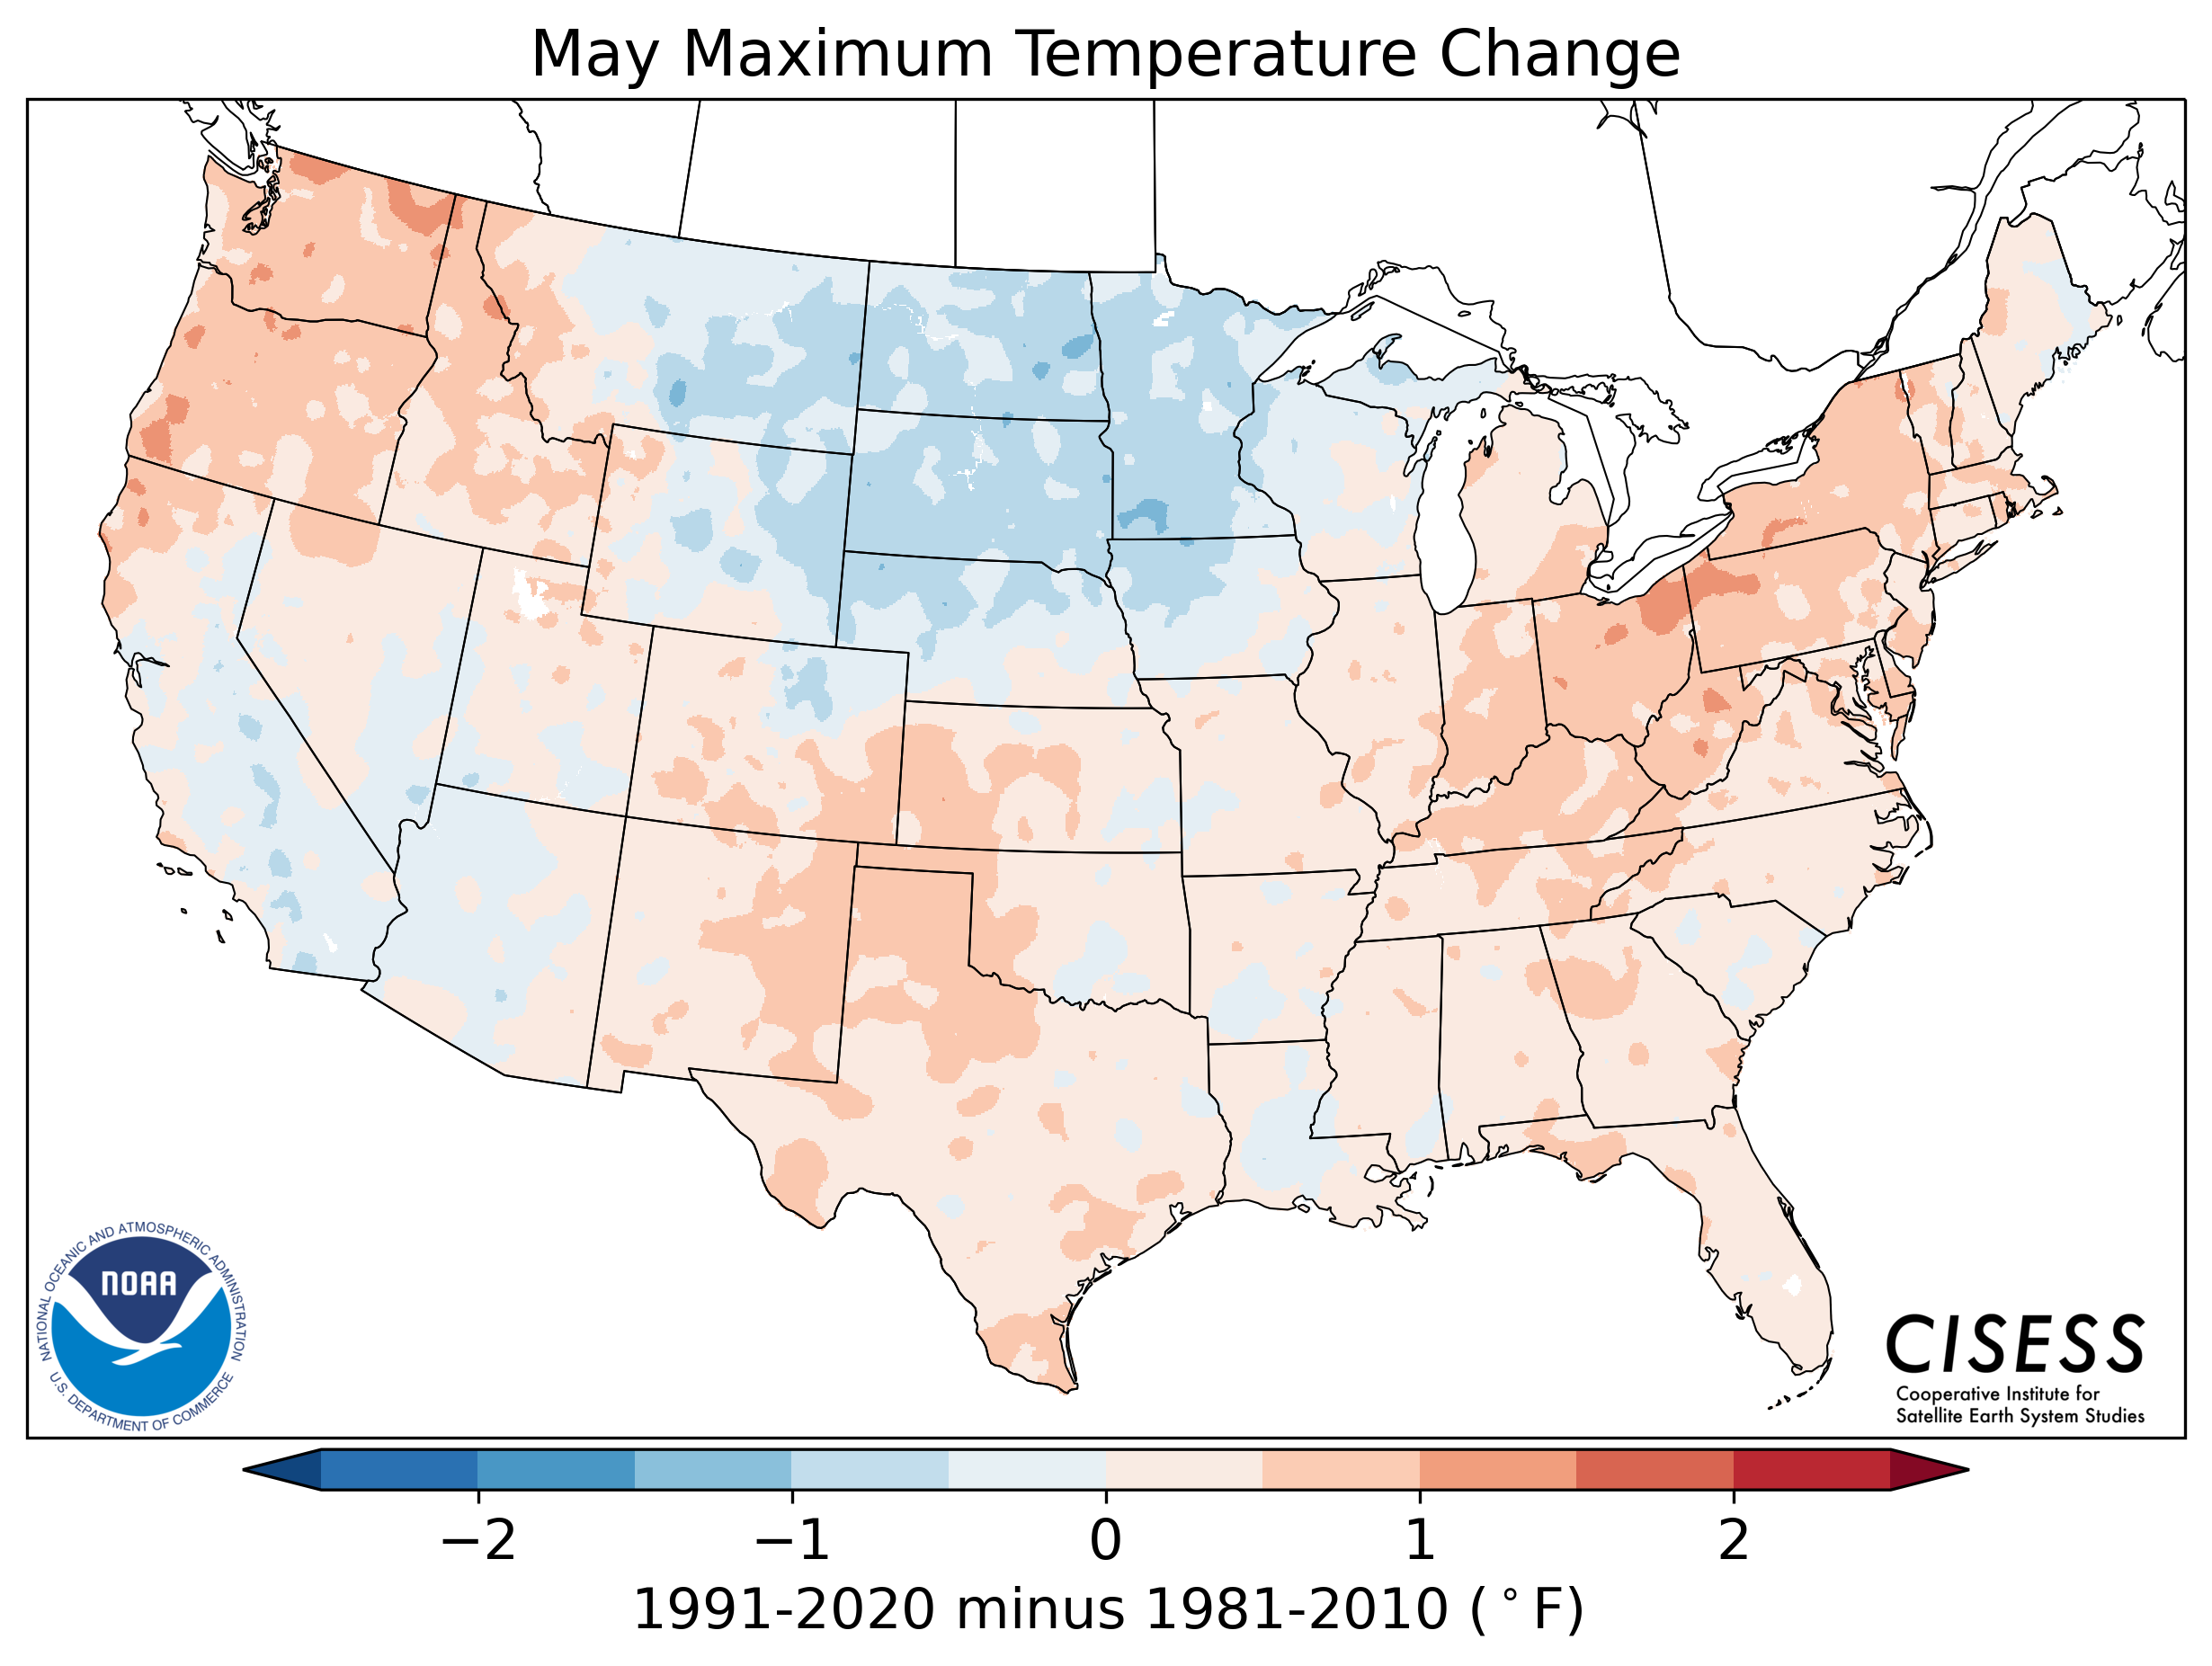
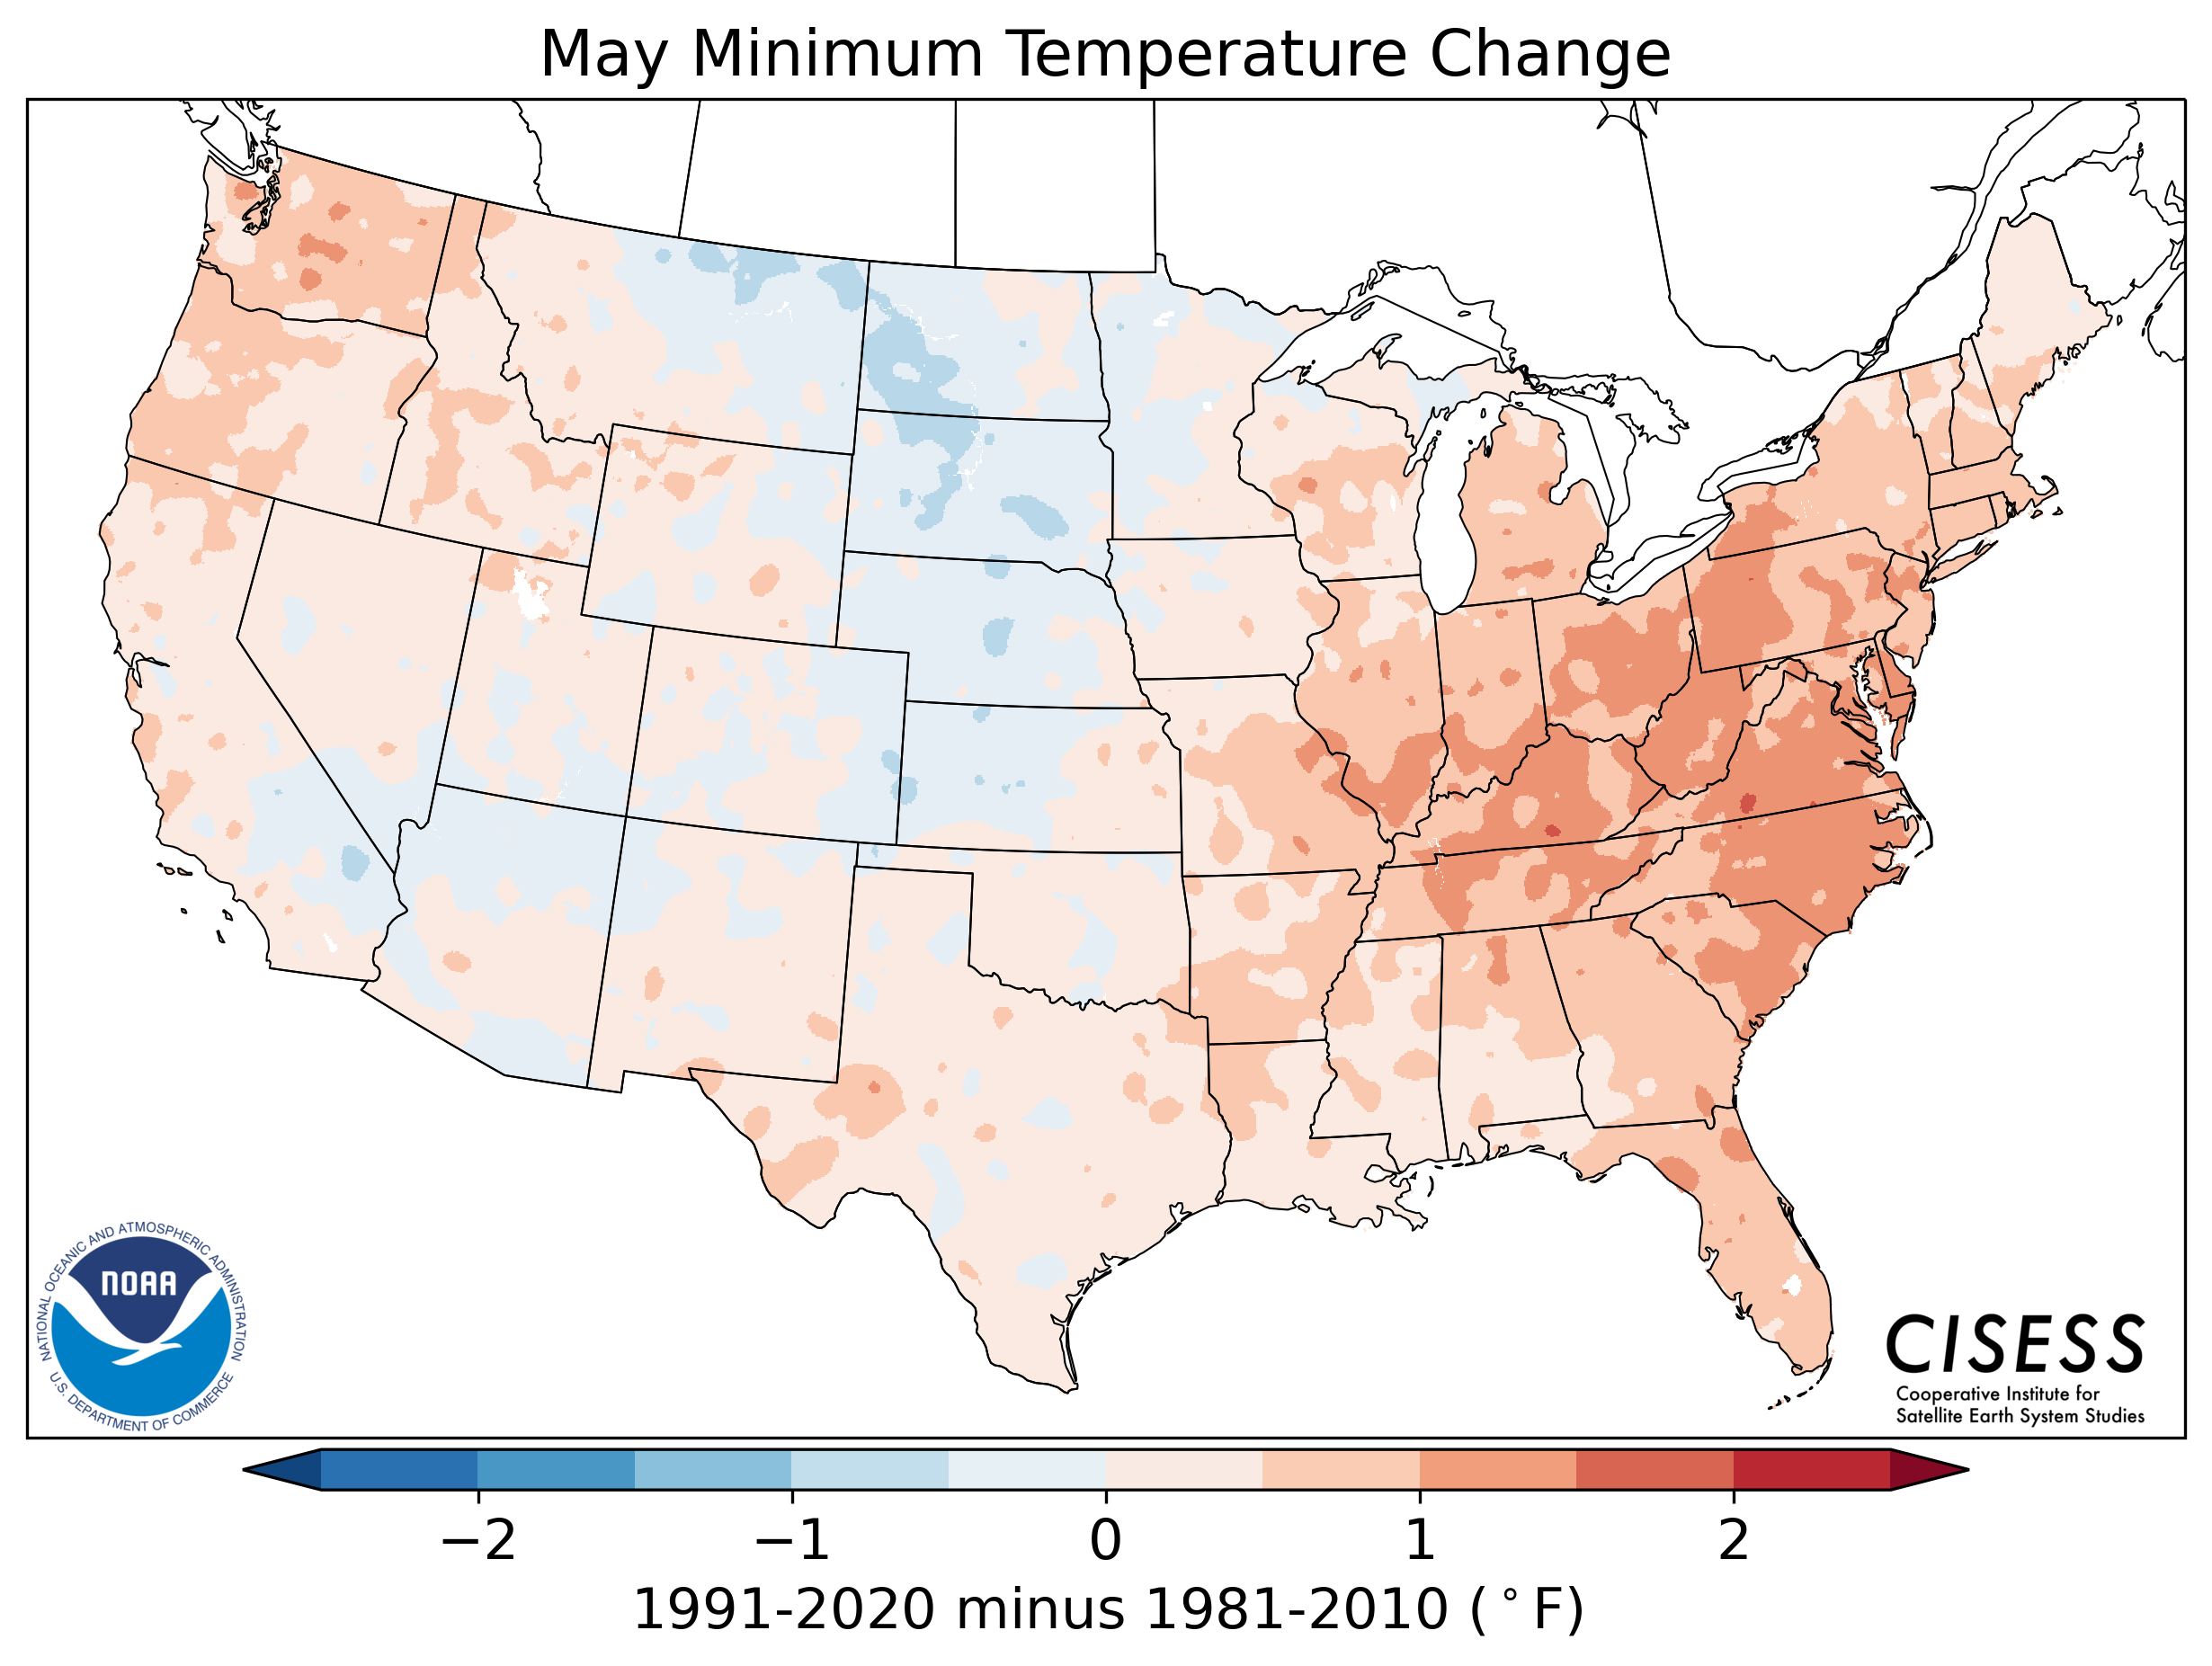
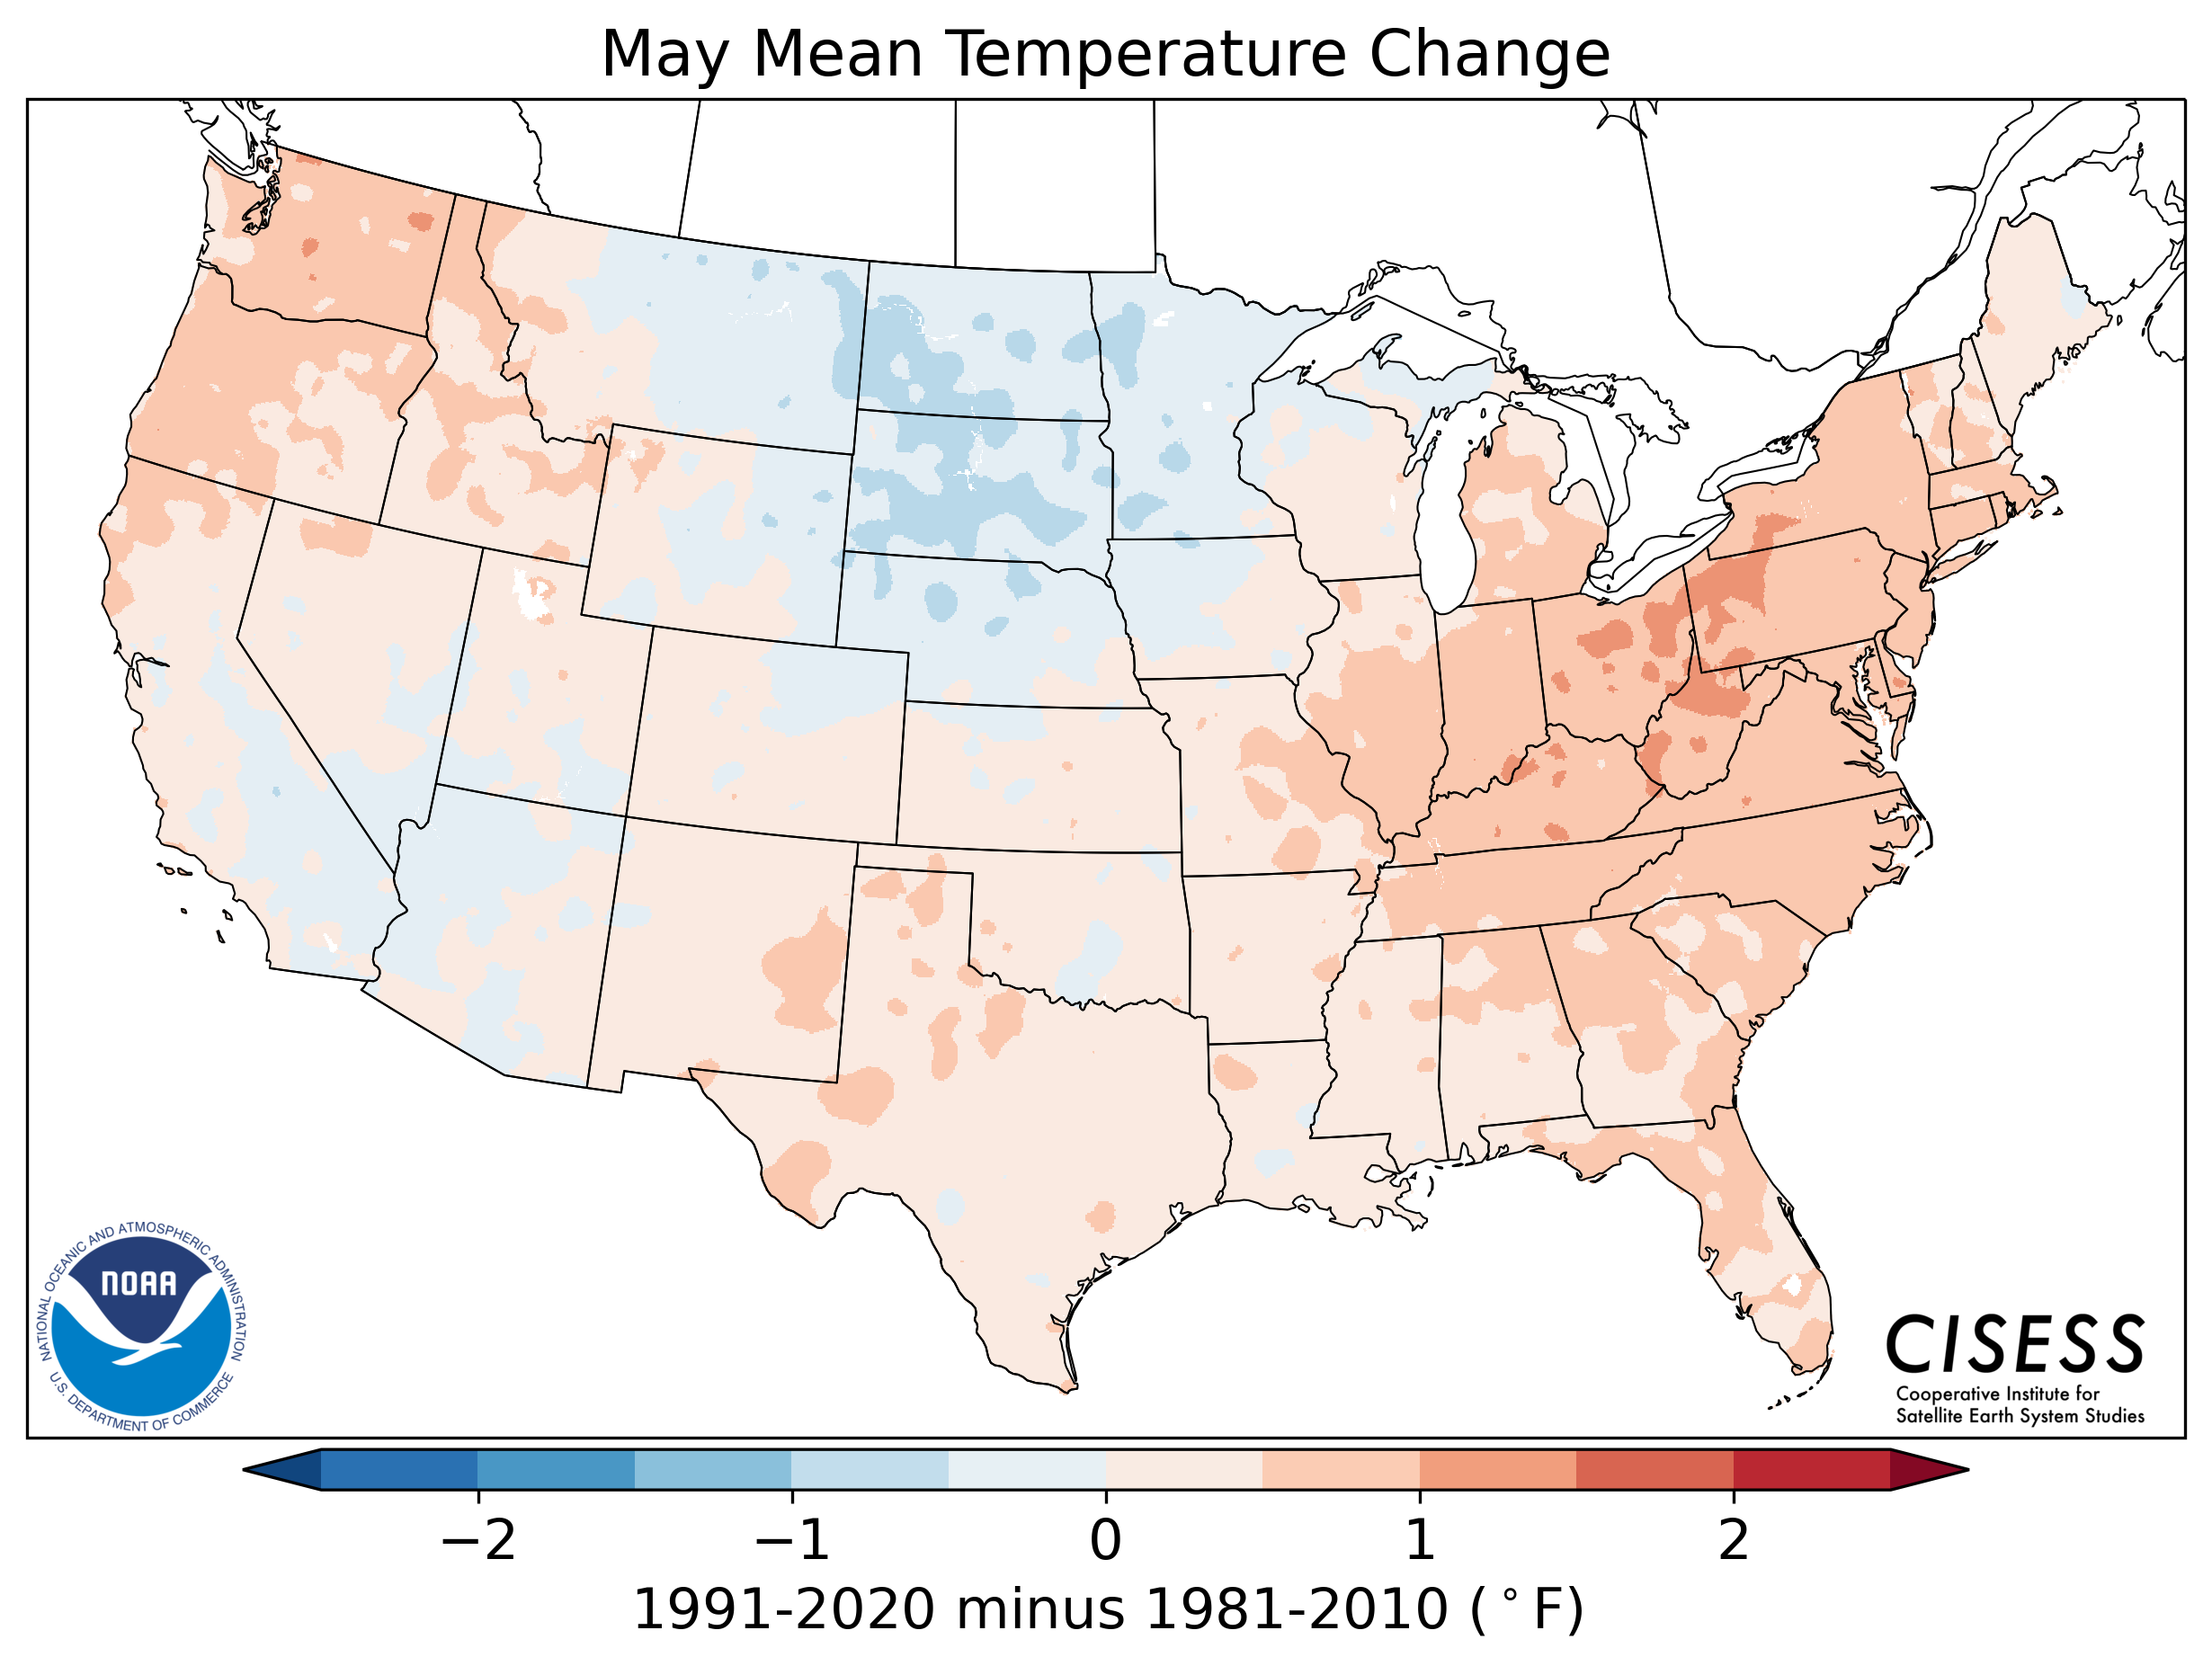
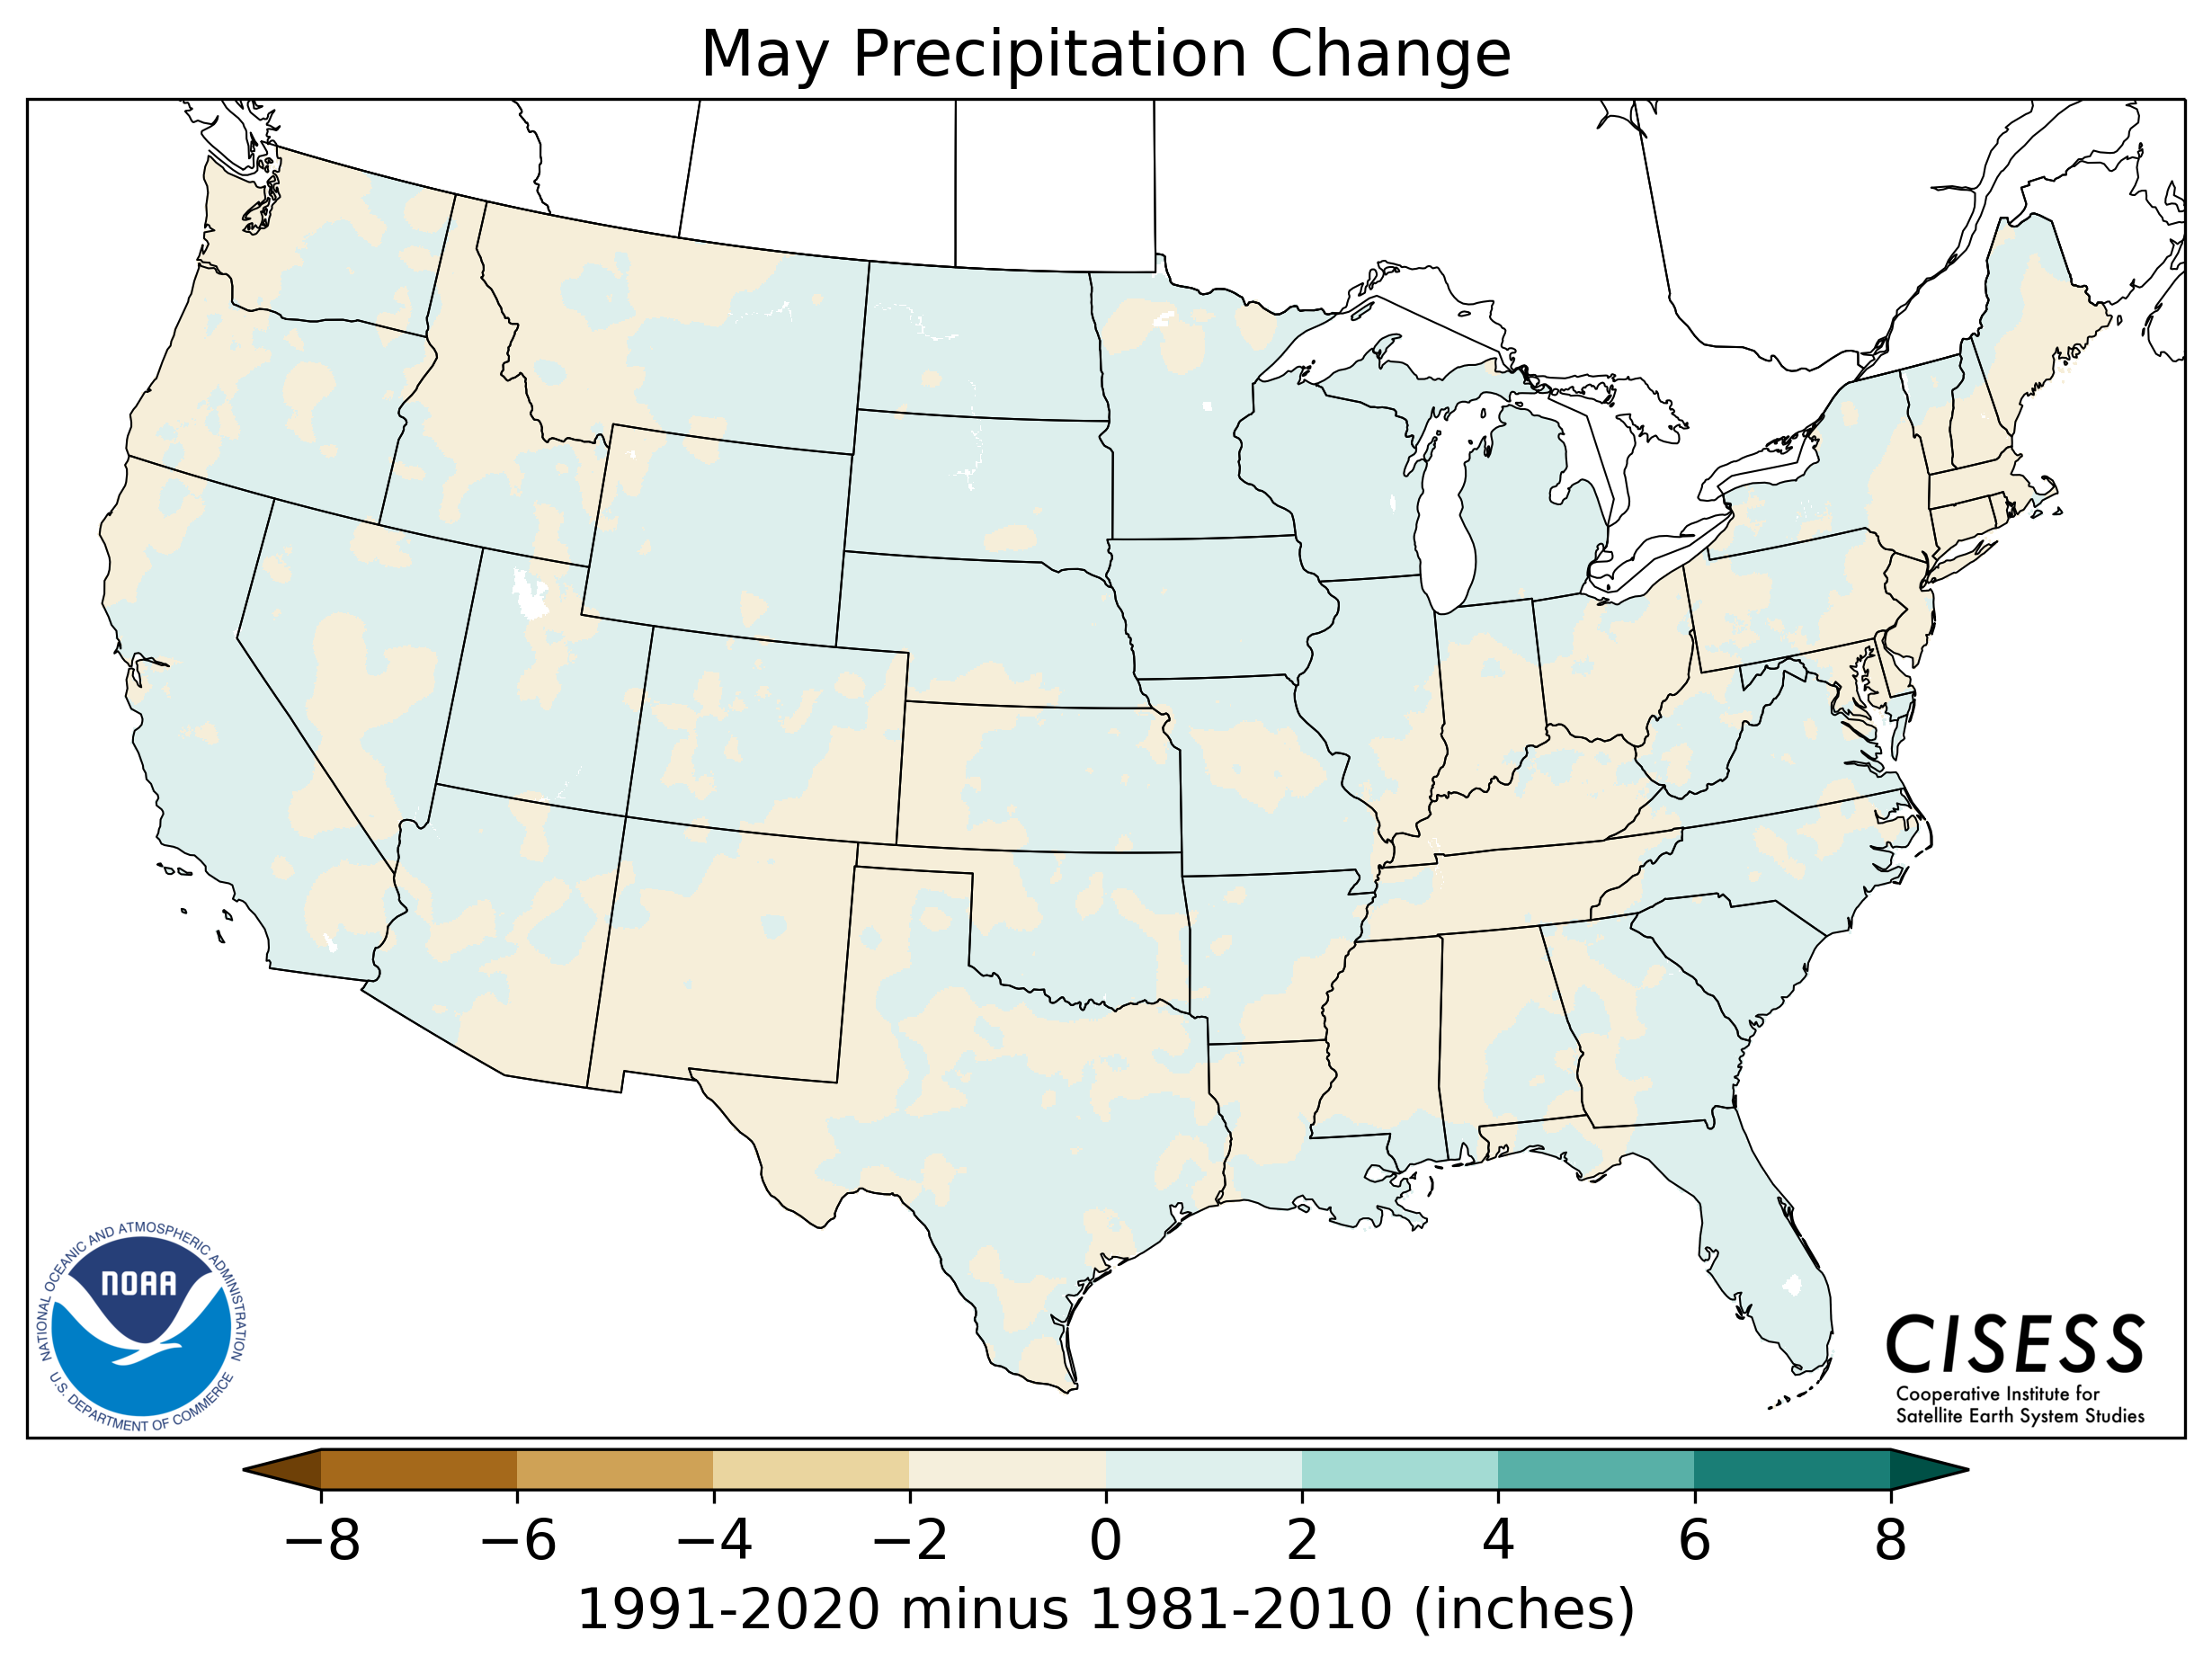
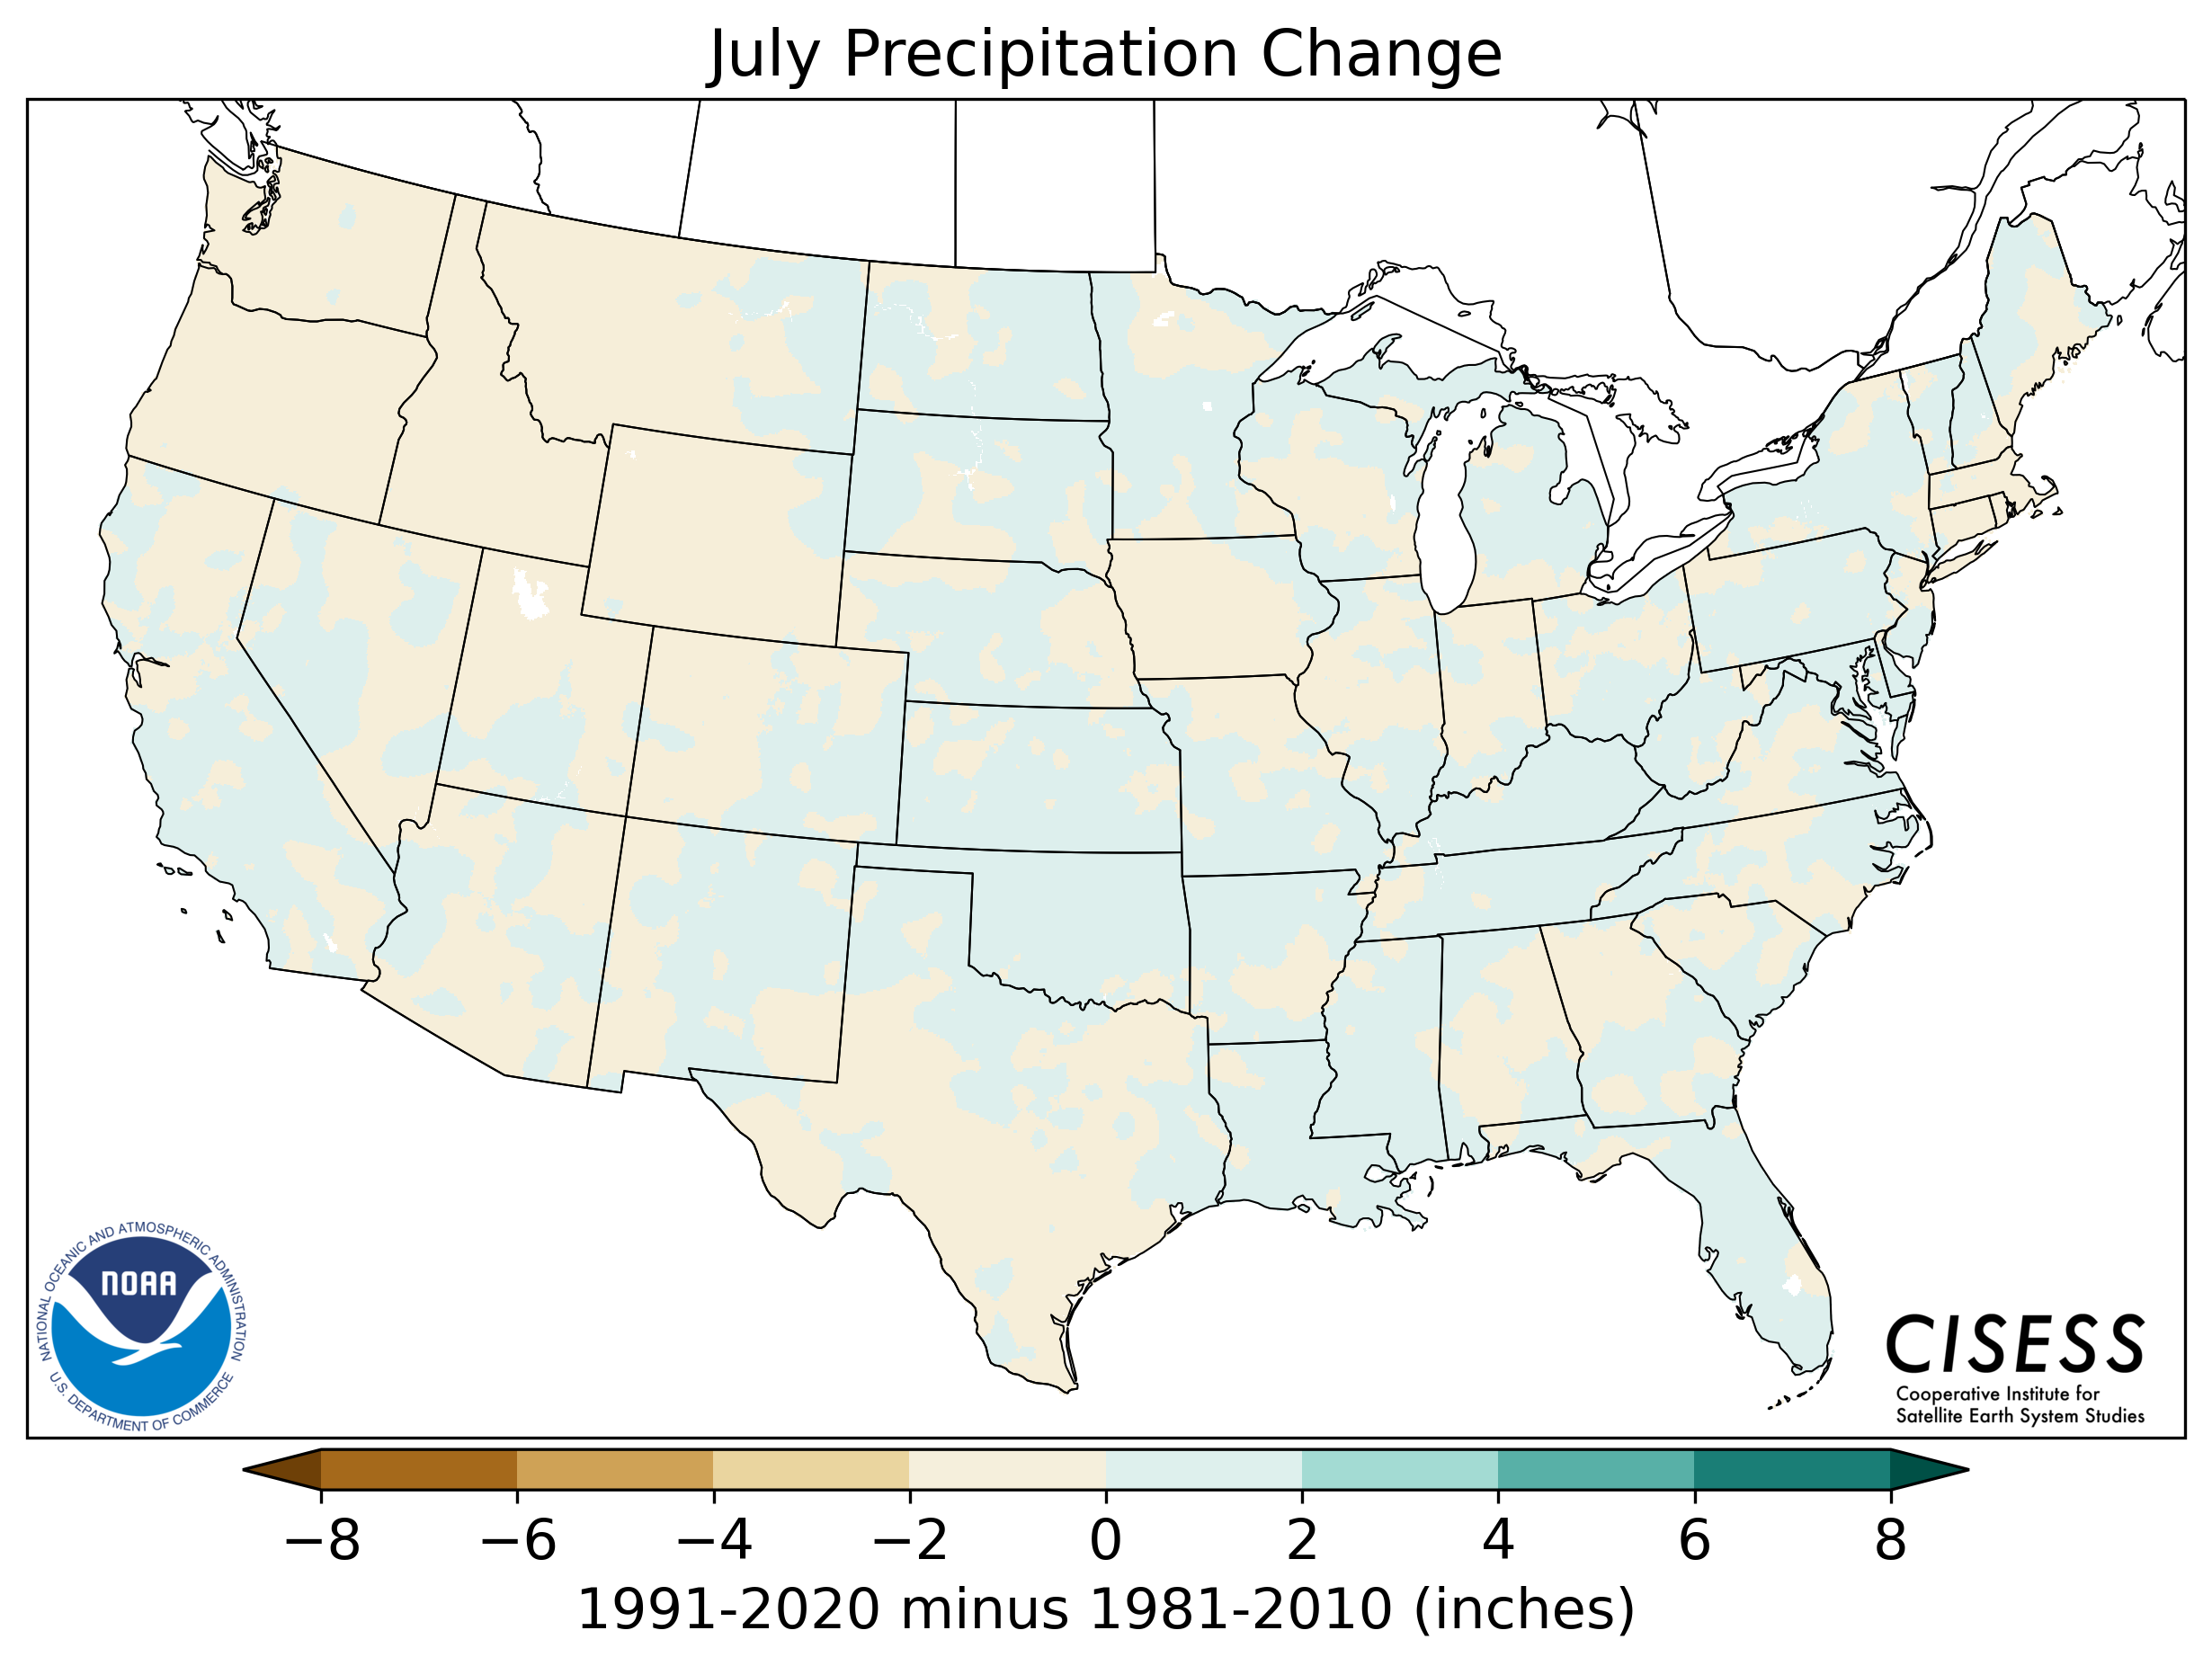
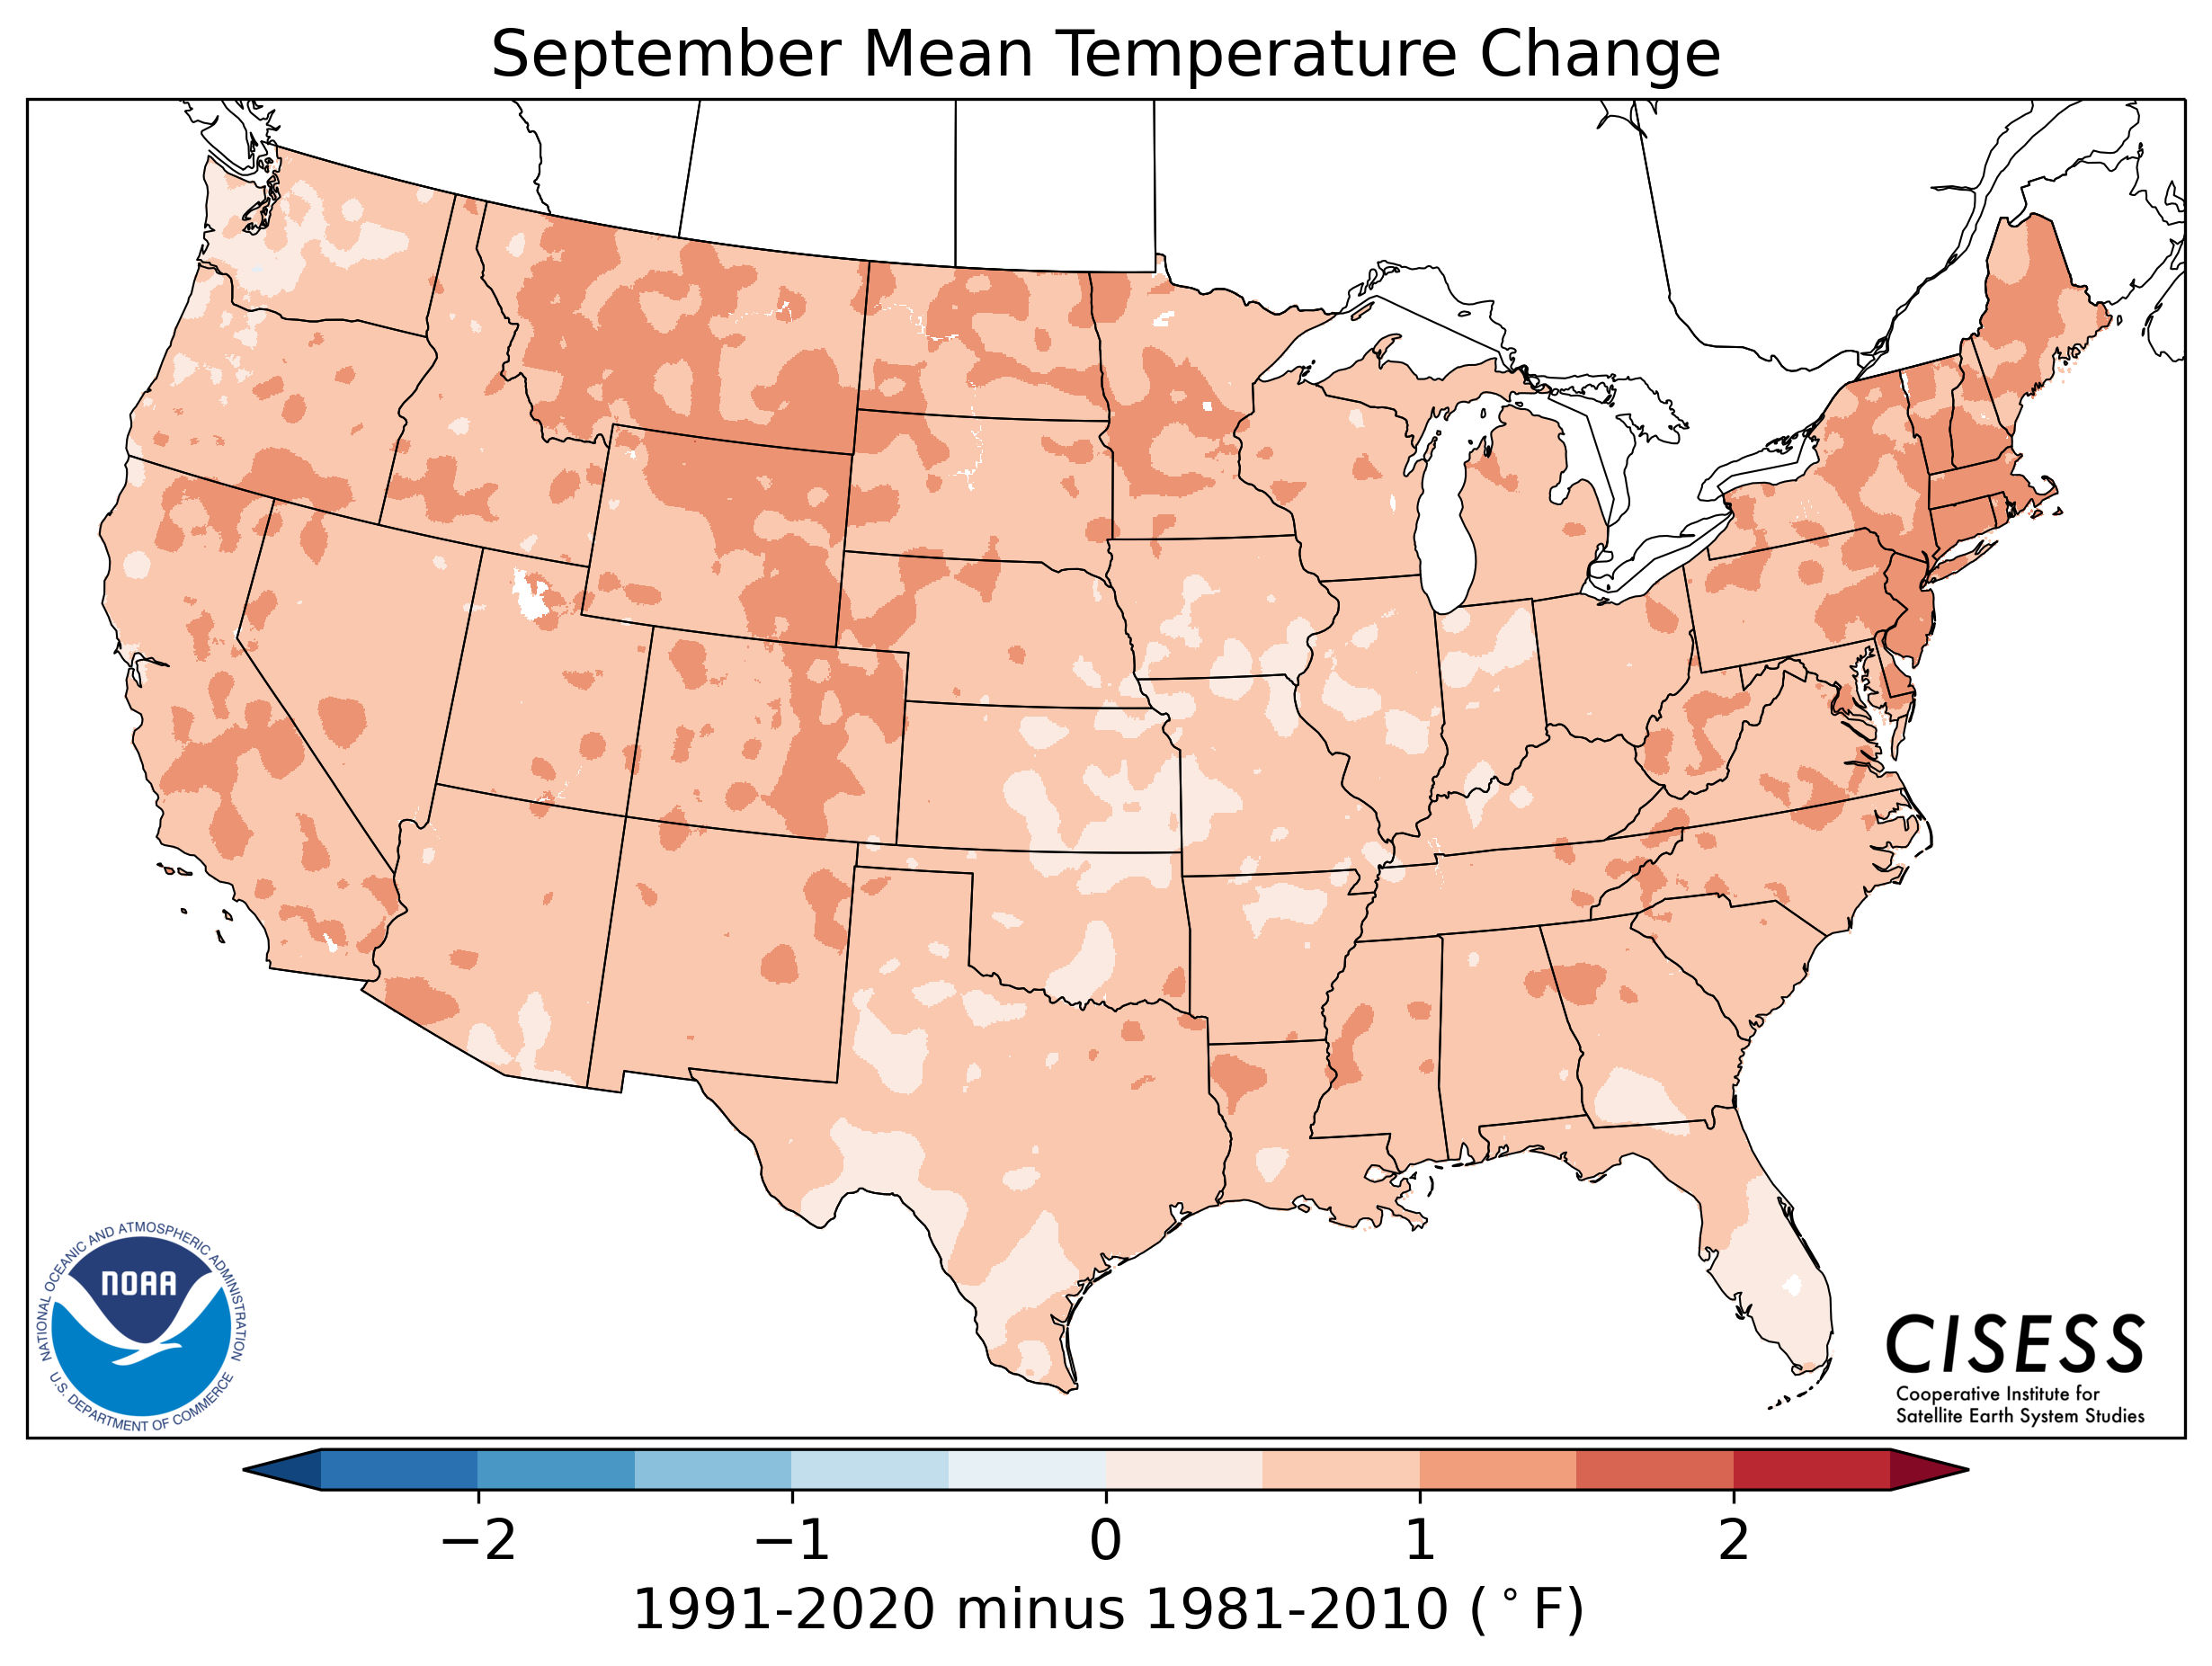
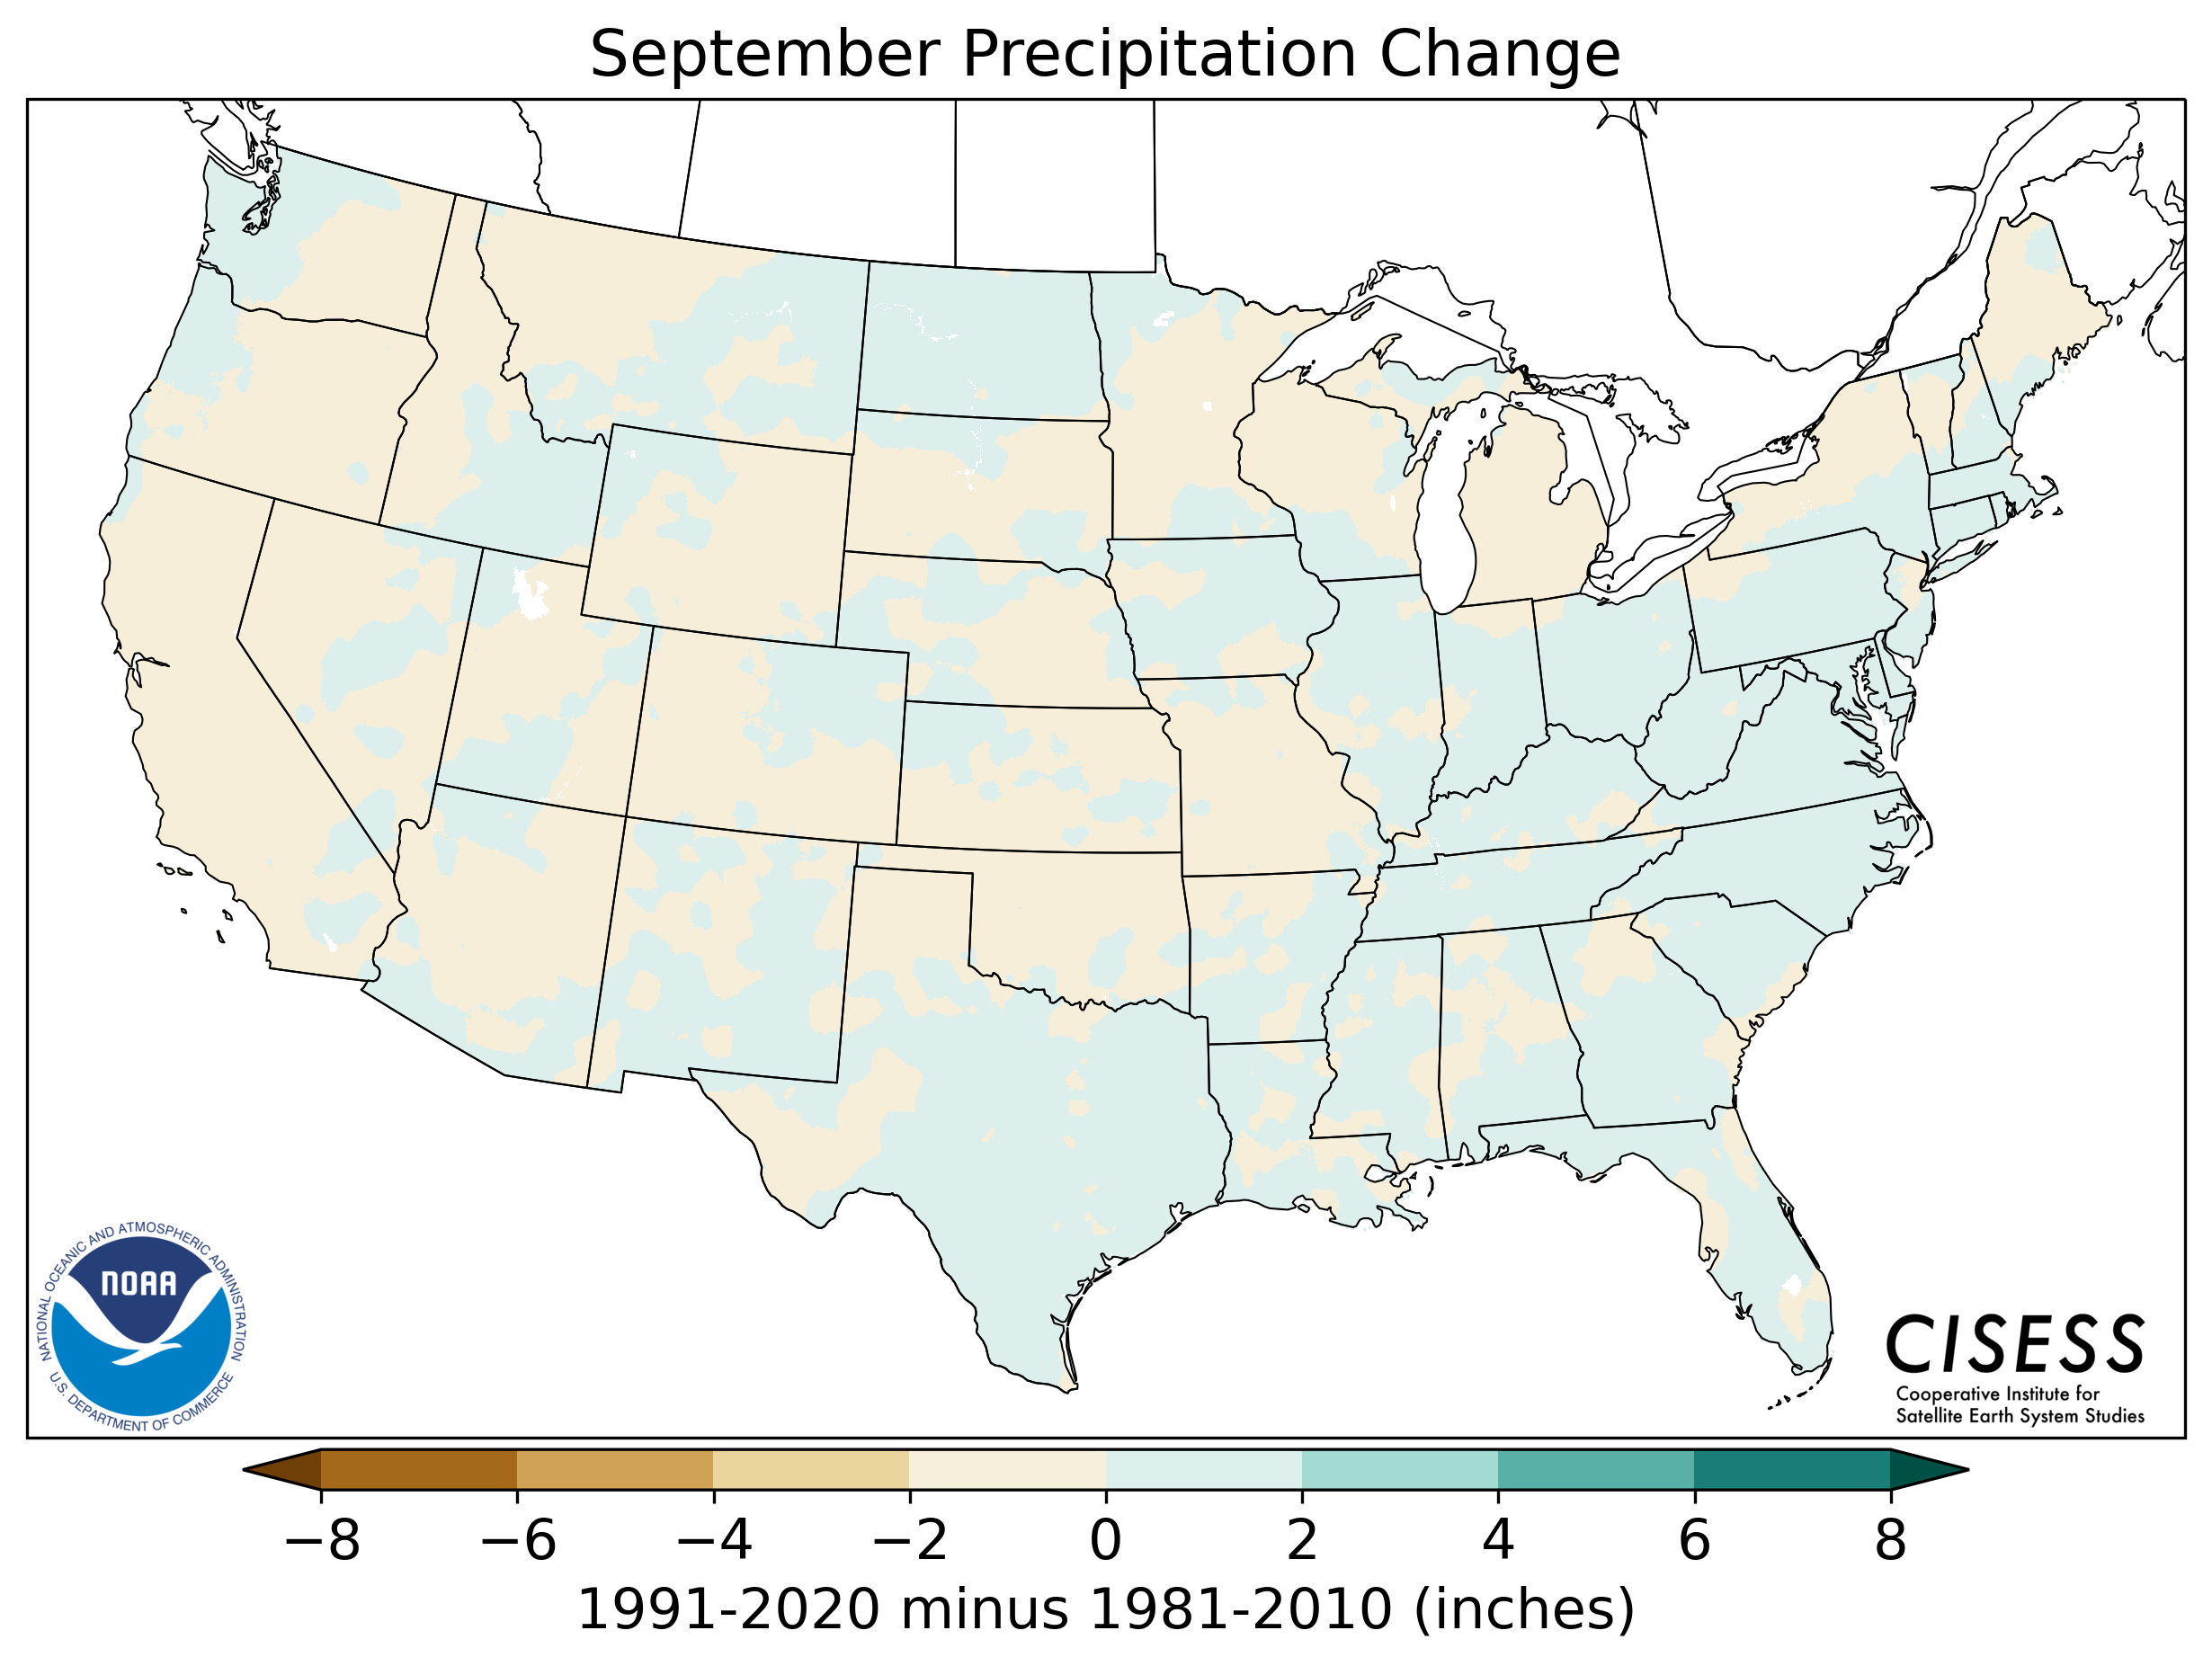
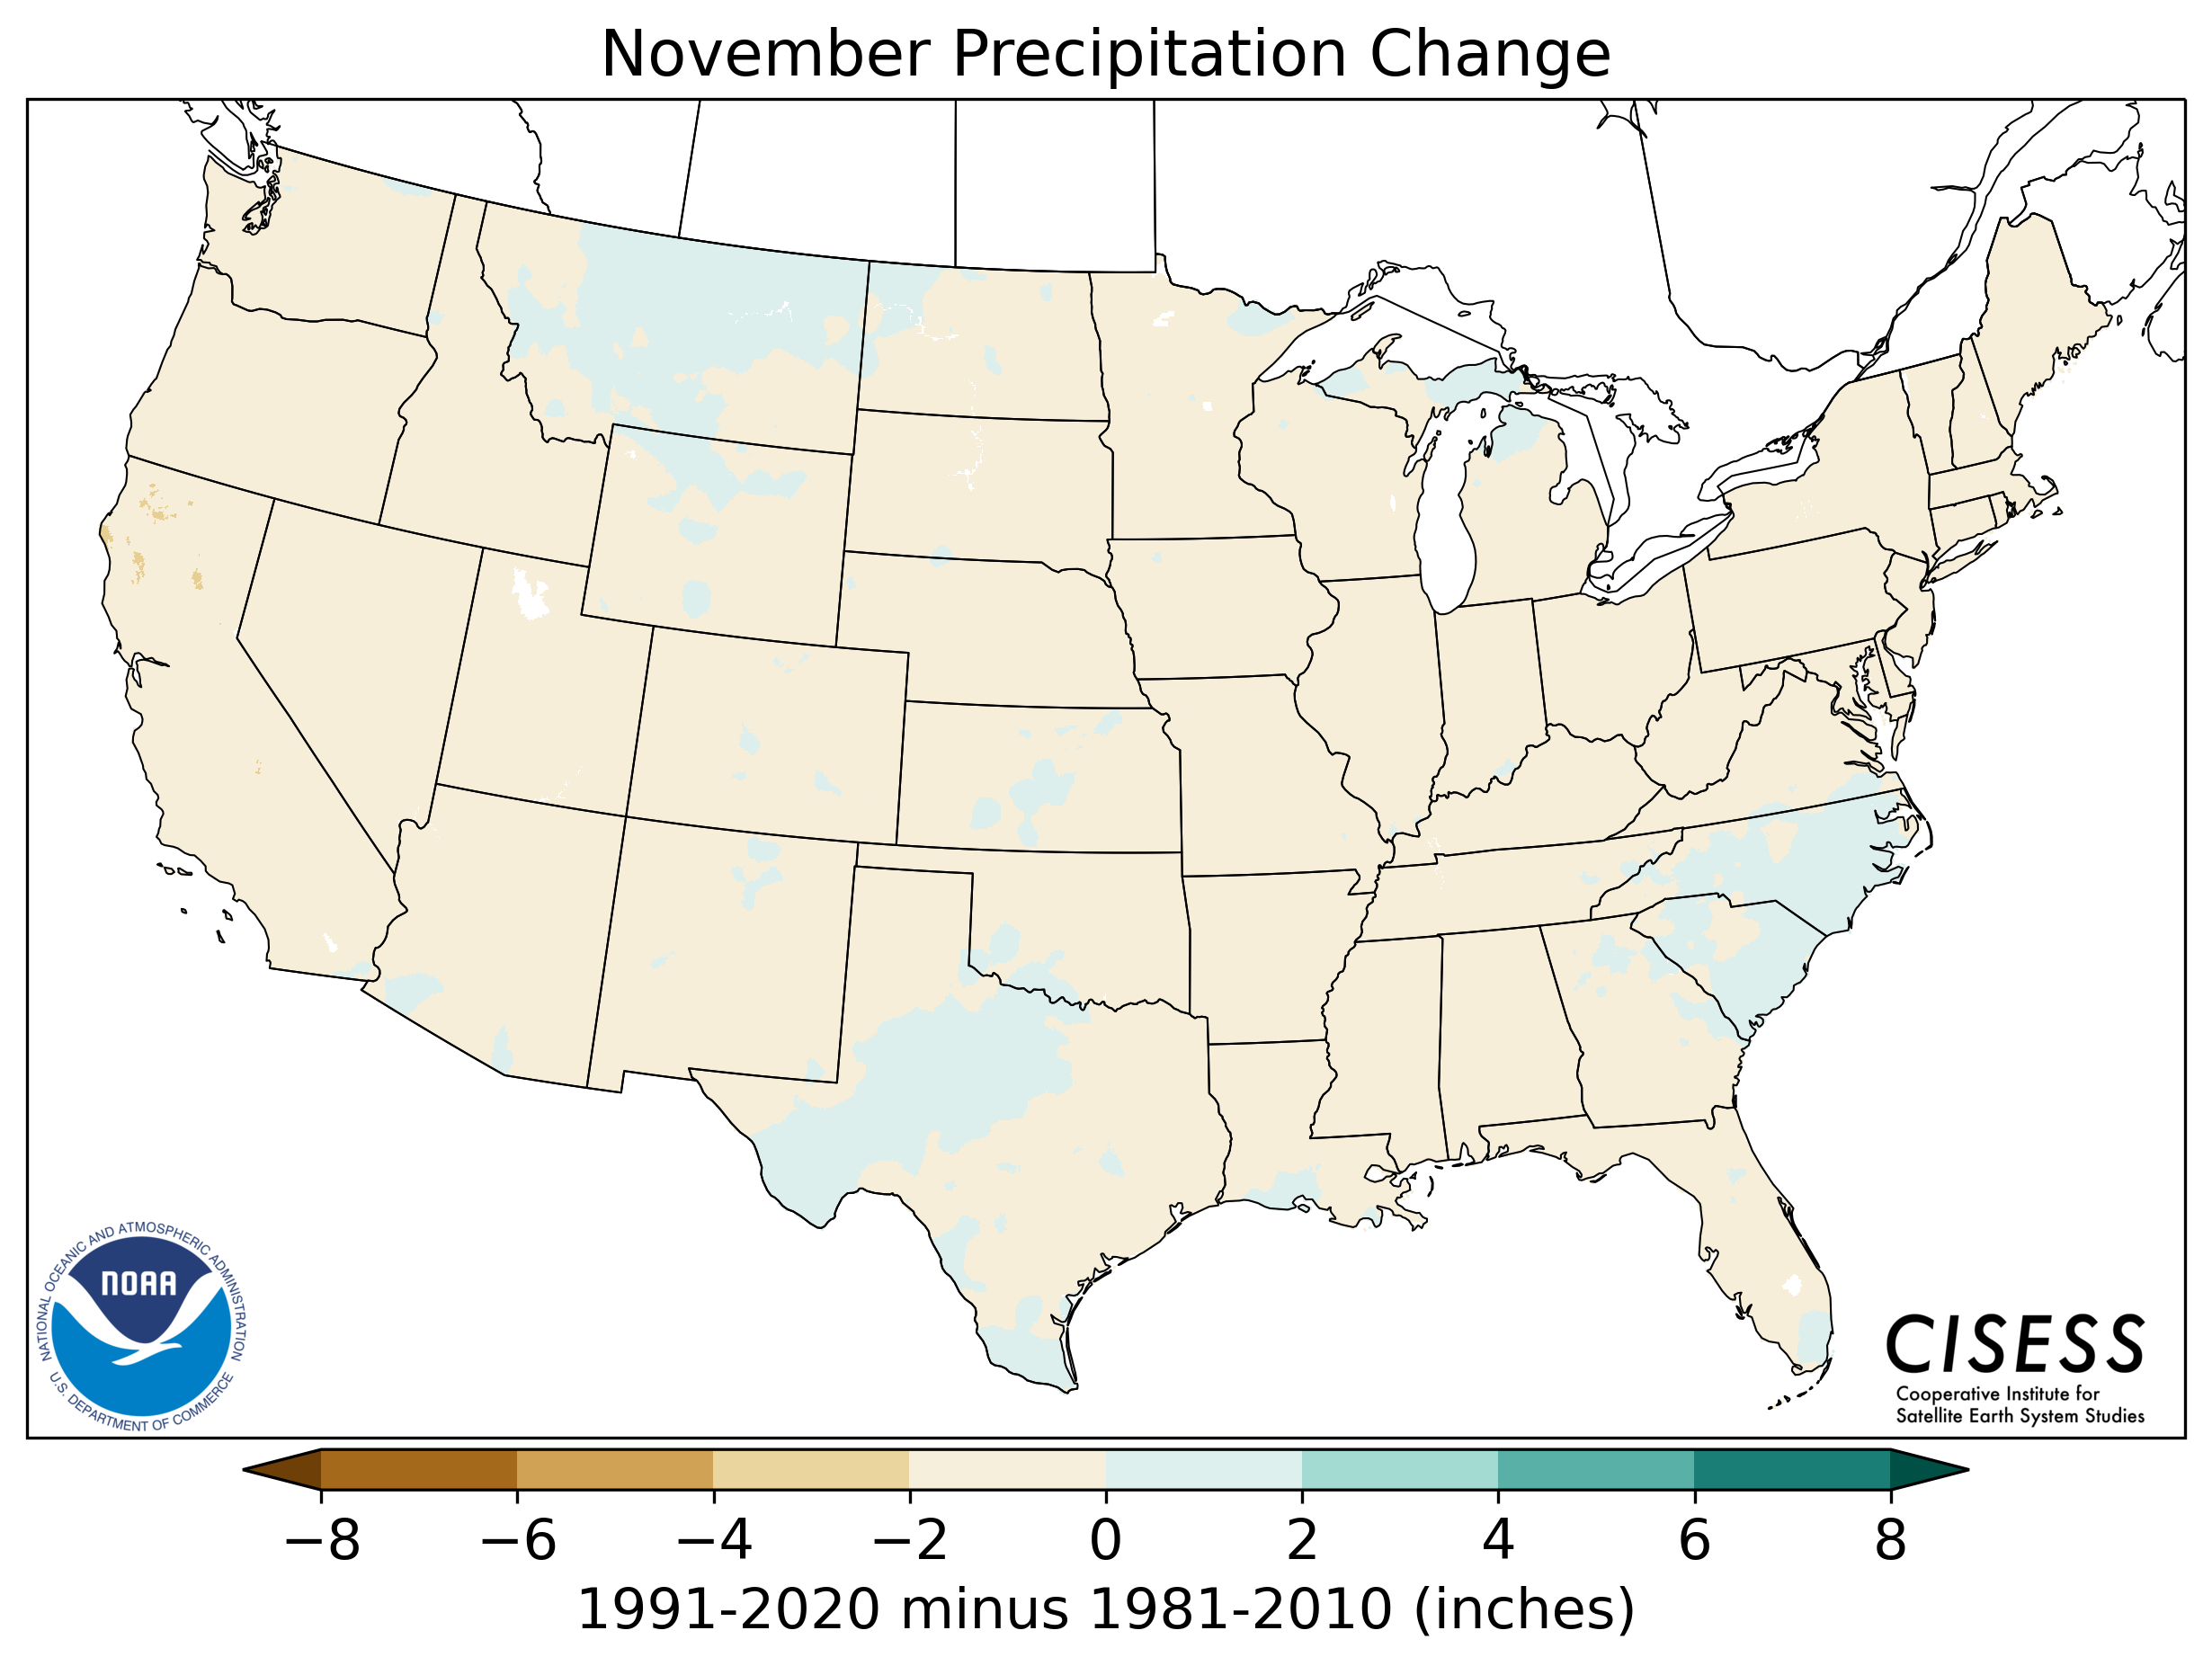
• Preliminary look ahead shows that not all areas of the U.S. have warmer temperature normals; especially in spring, normals have cooled in the north central U.S.; precipitation normals have also changed in complex ways, depending on season and location.
Are the 1991-2020 Normals calculations different from 1981-2010 Normals? Just a little.
Station normals calculations will follow the approaches pioneered in the last cycle, You will find at the following link references to all the detailed normals methodology publications: https://www.ncdc.noaa.gov/data-access/land-based-station-data/land-based-datasets/climate-normals/1981-2010-normals-data. Small technical changes were made to adopt World Meteorological Organization (WMO) Normals Calculation Guidelines.
Why are the Normals calculated for a 30-year period? History, tradition, and WMO requirements.
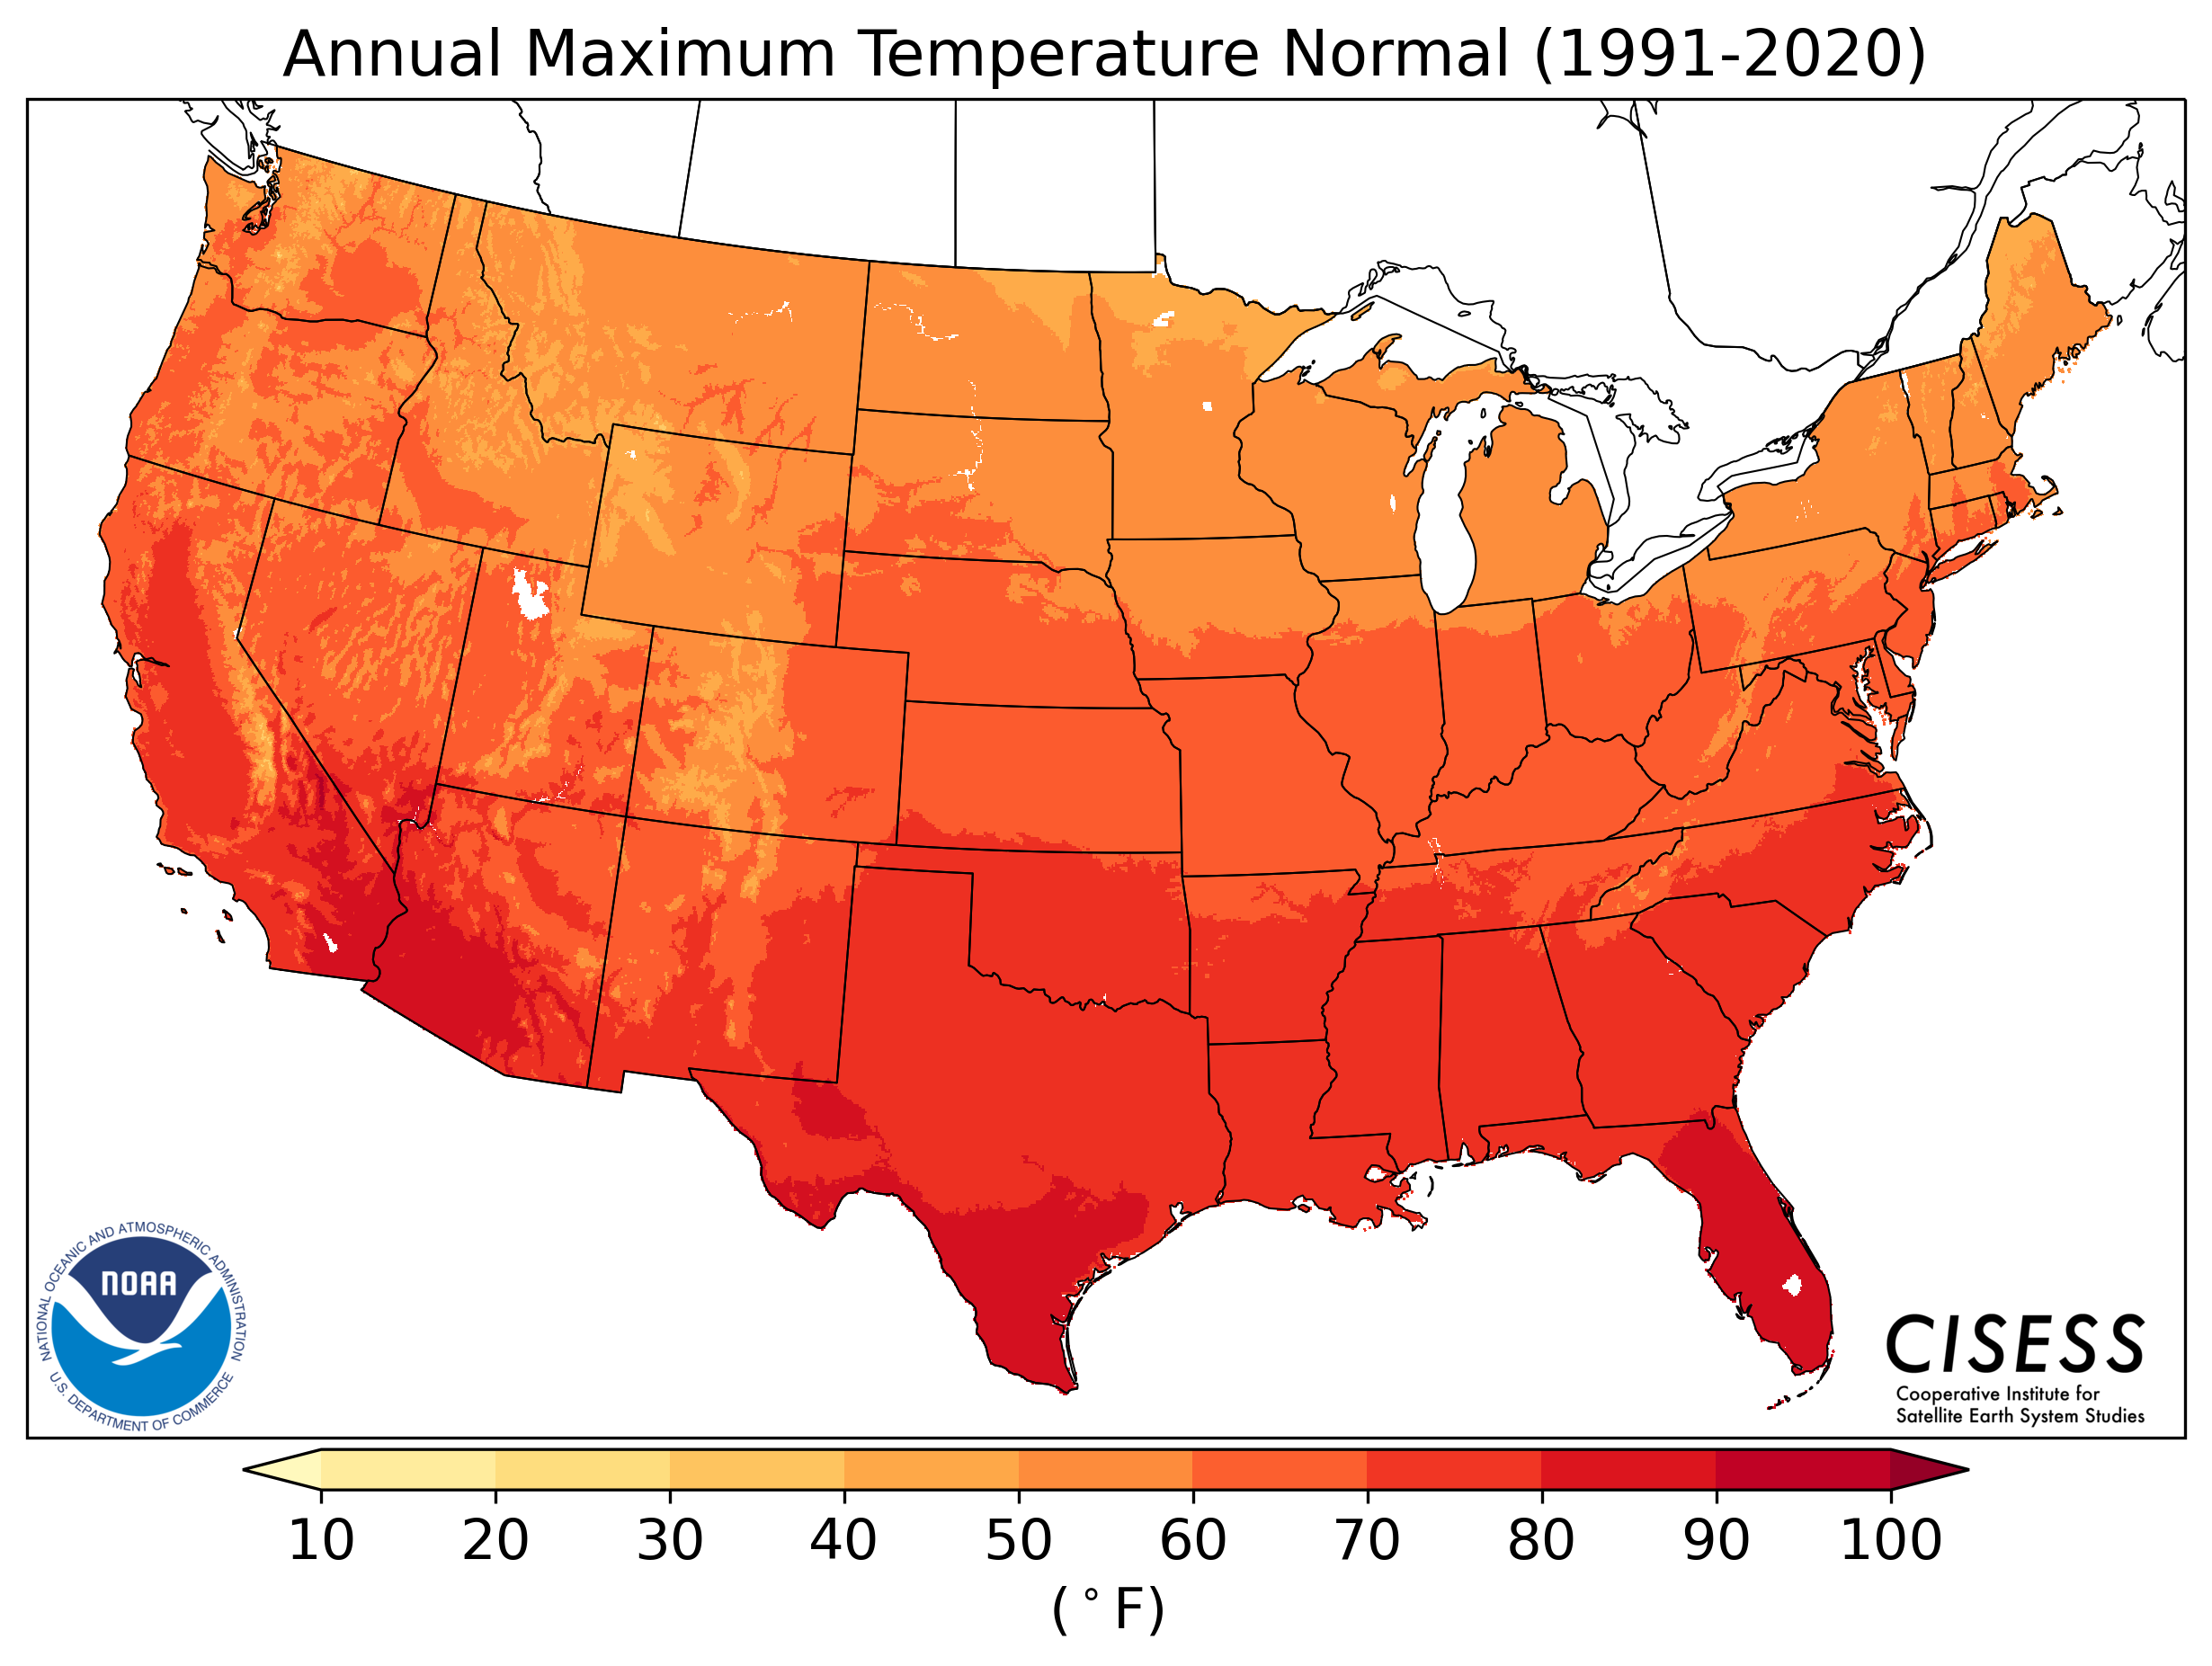
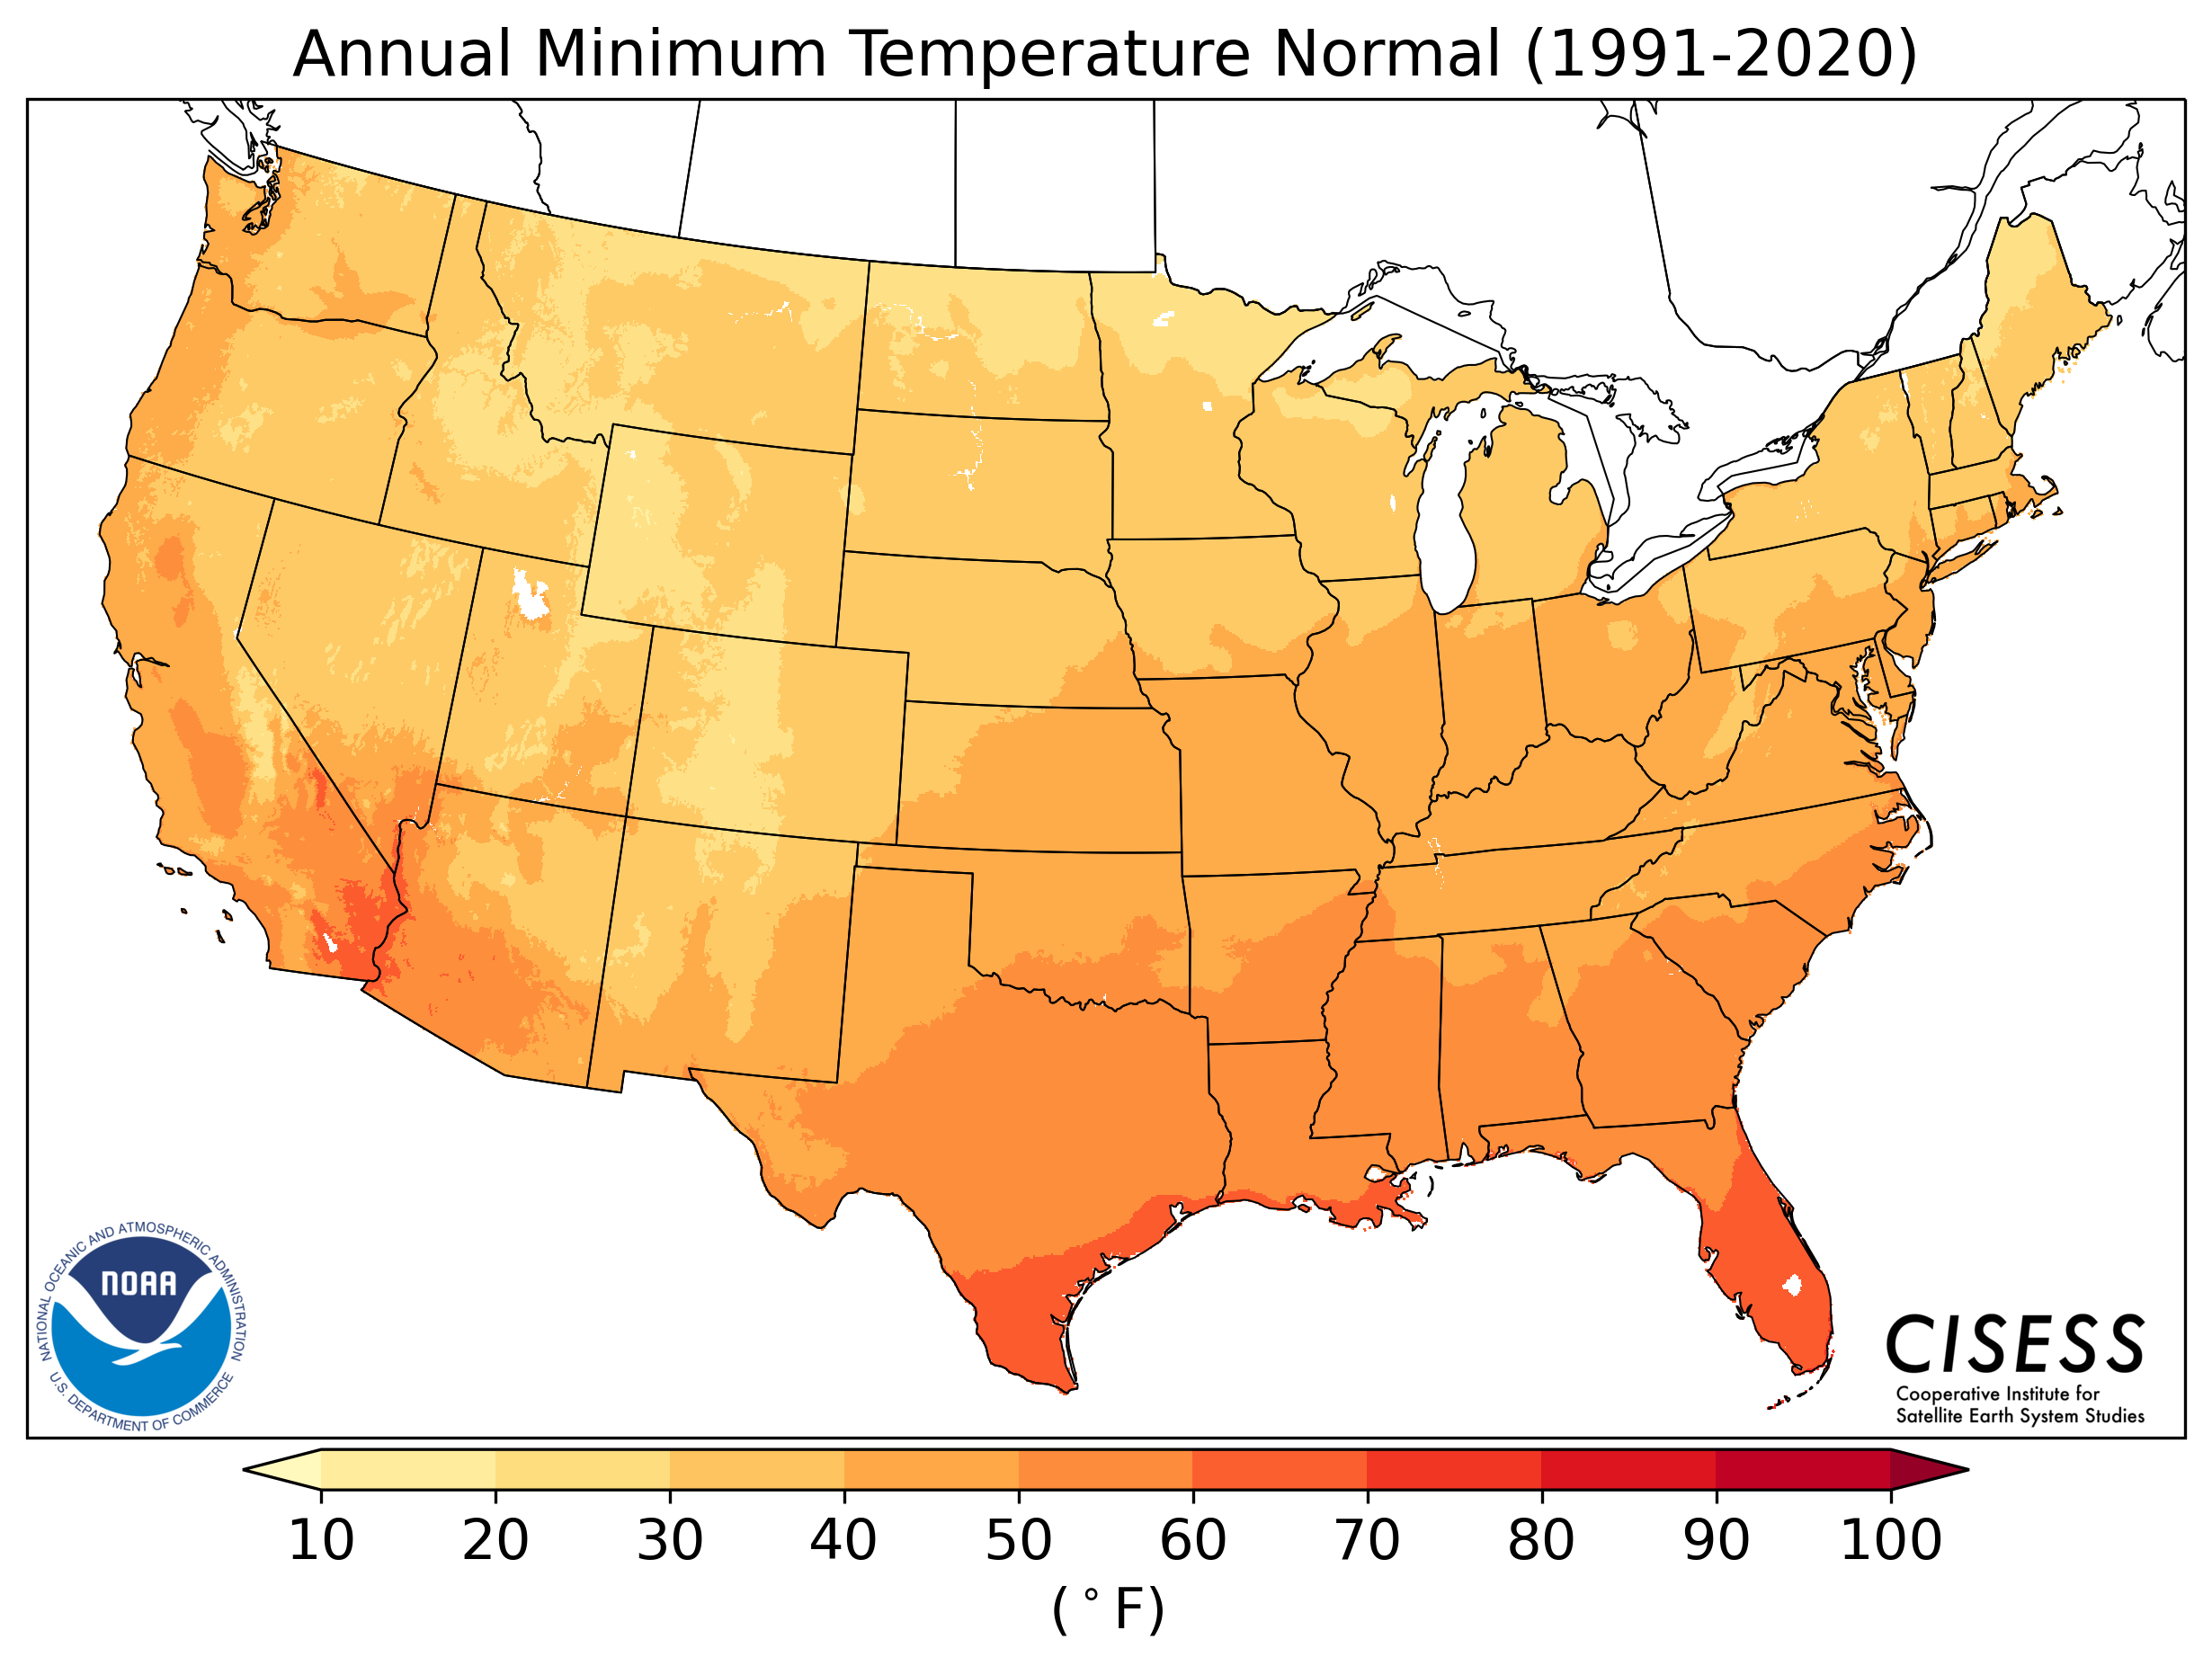
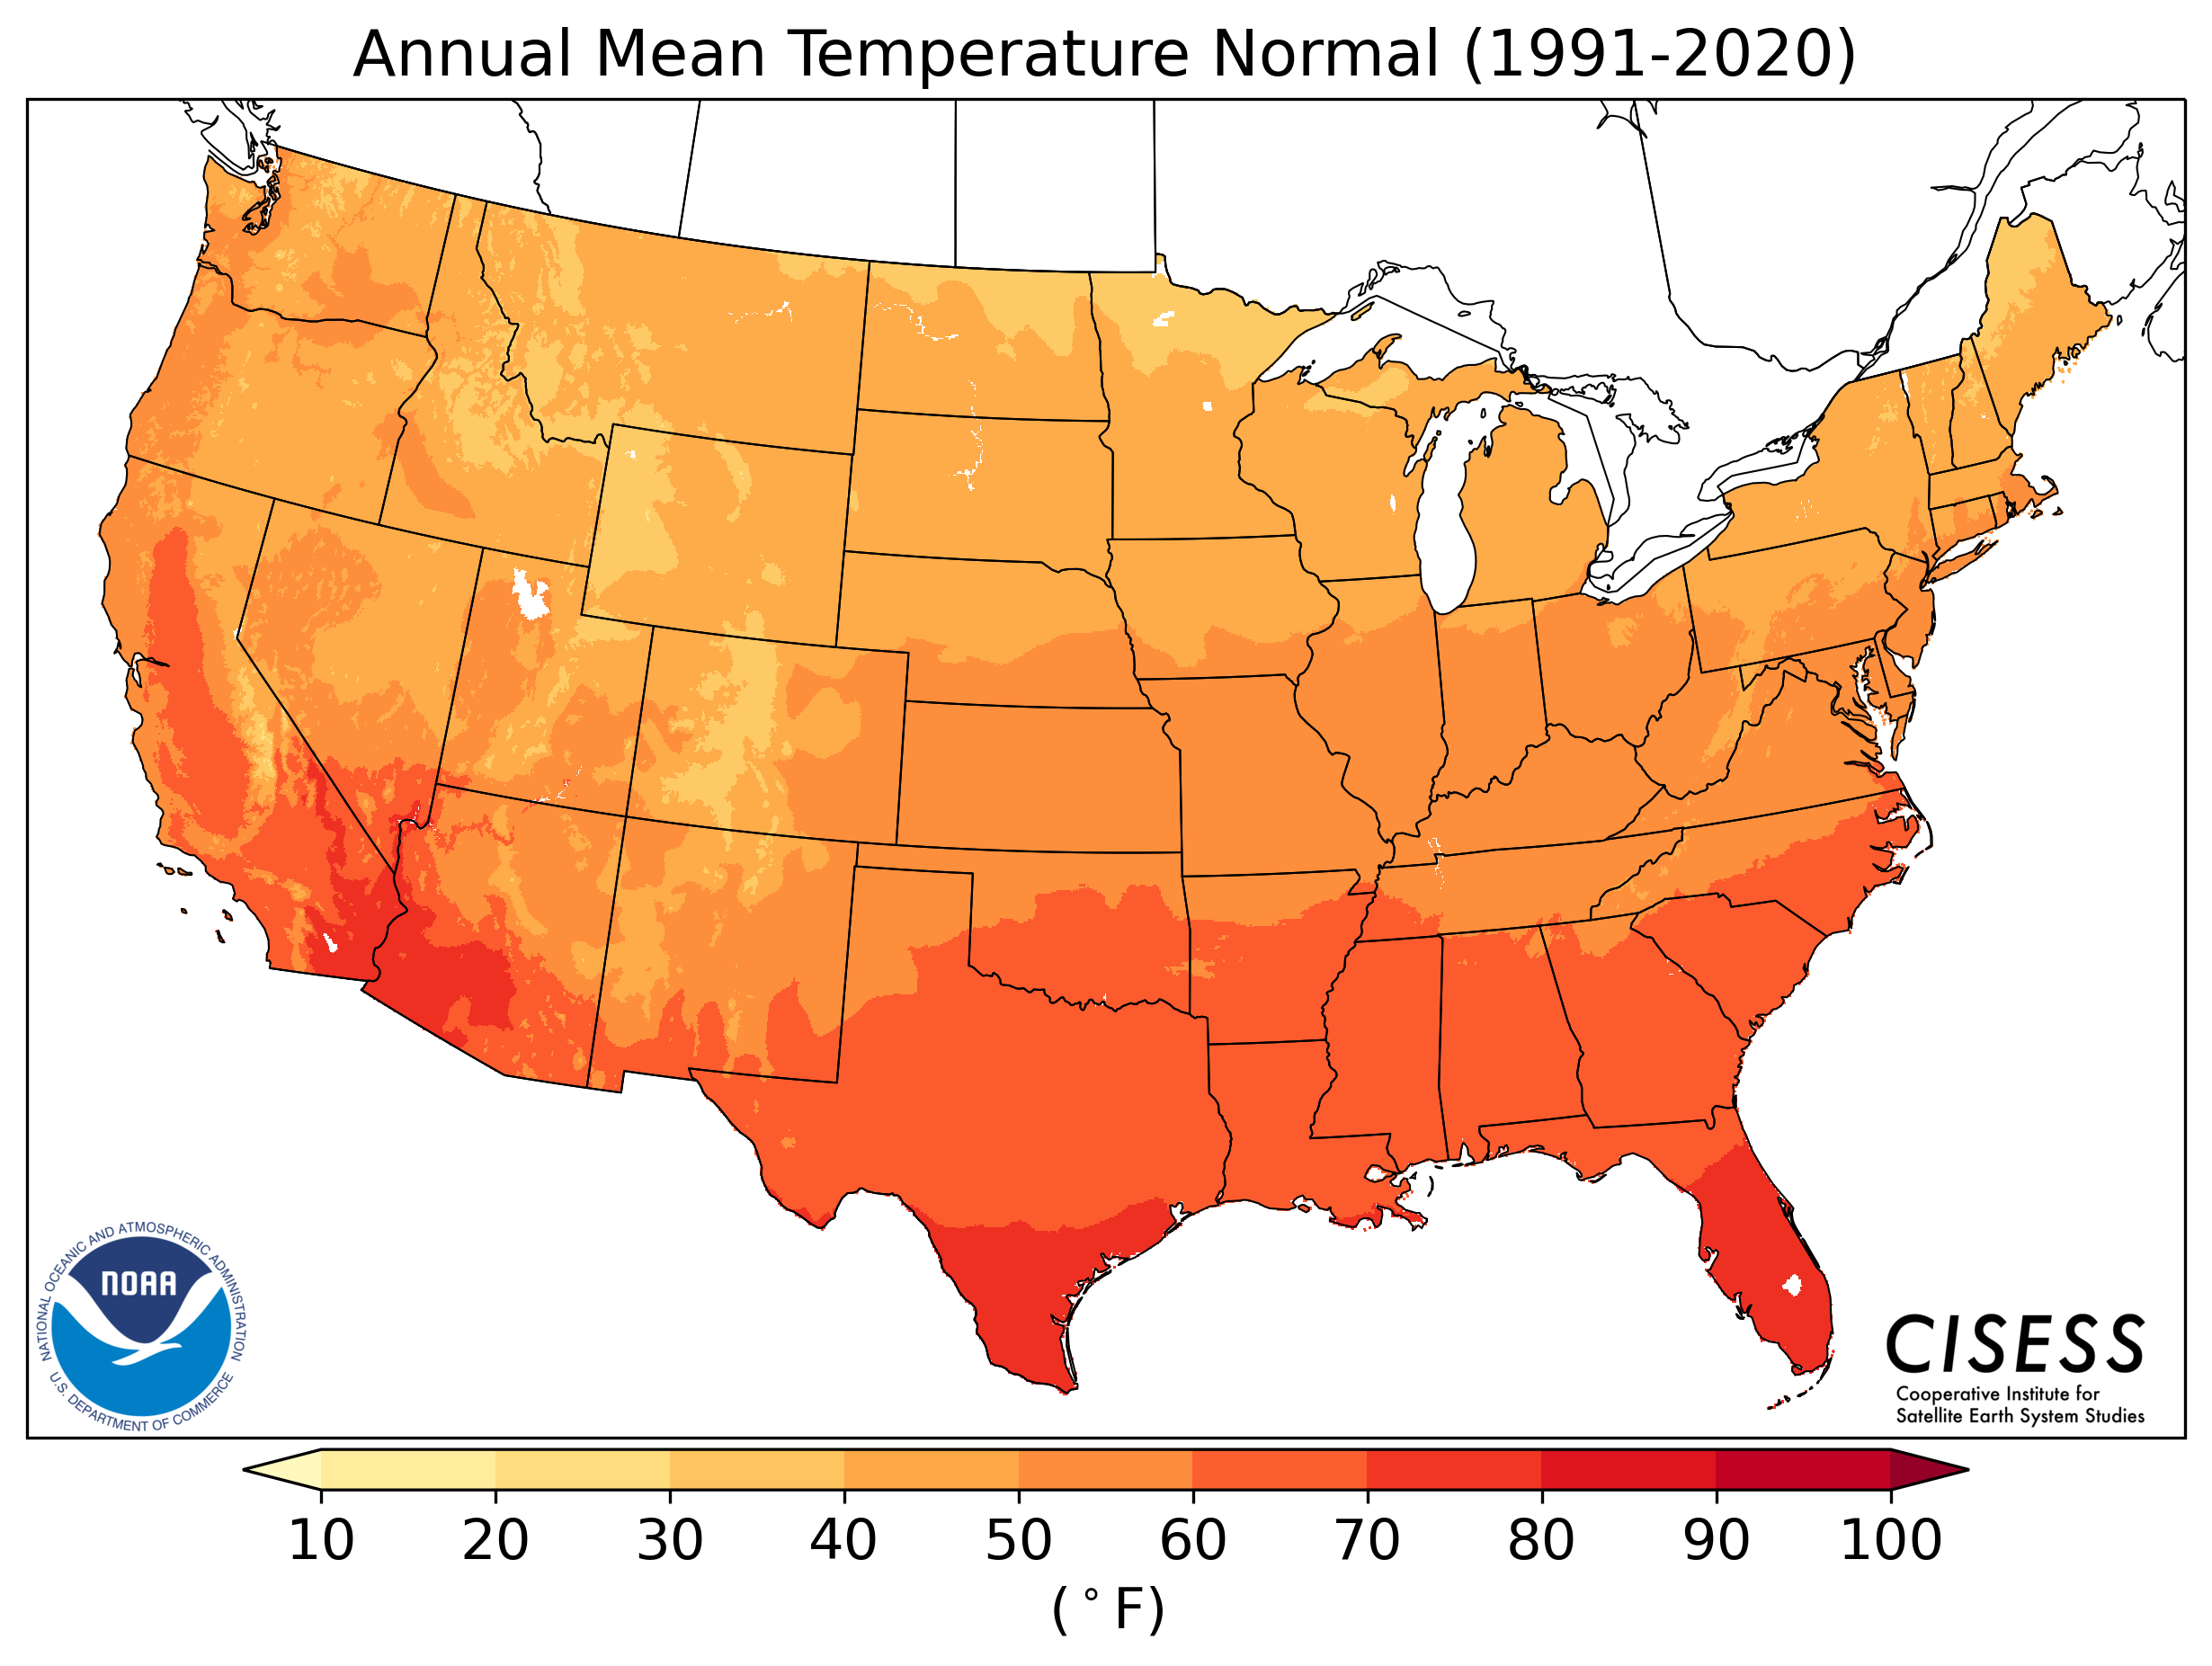
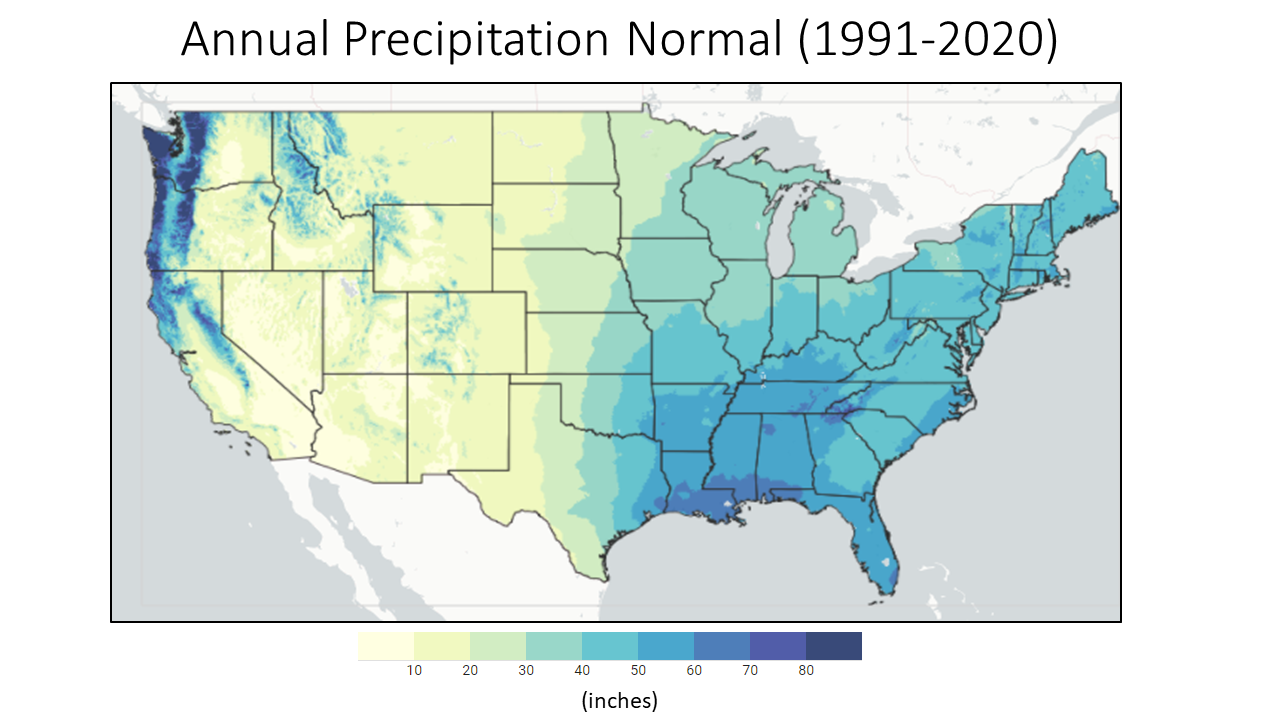
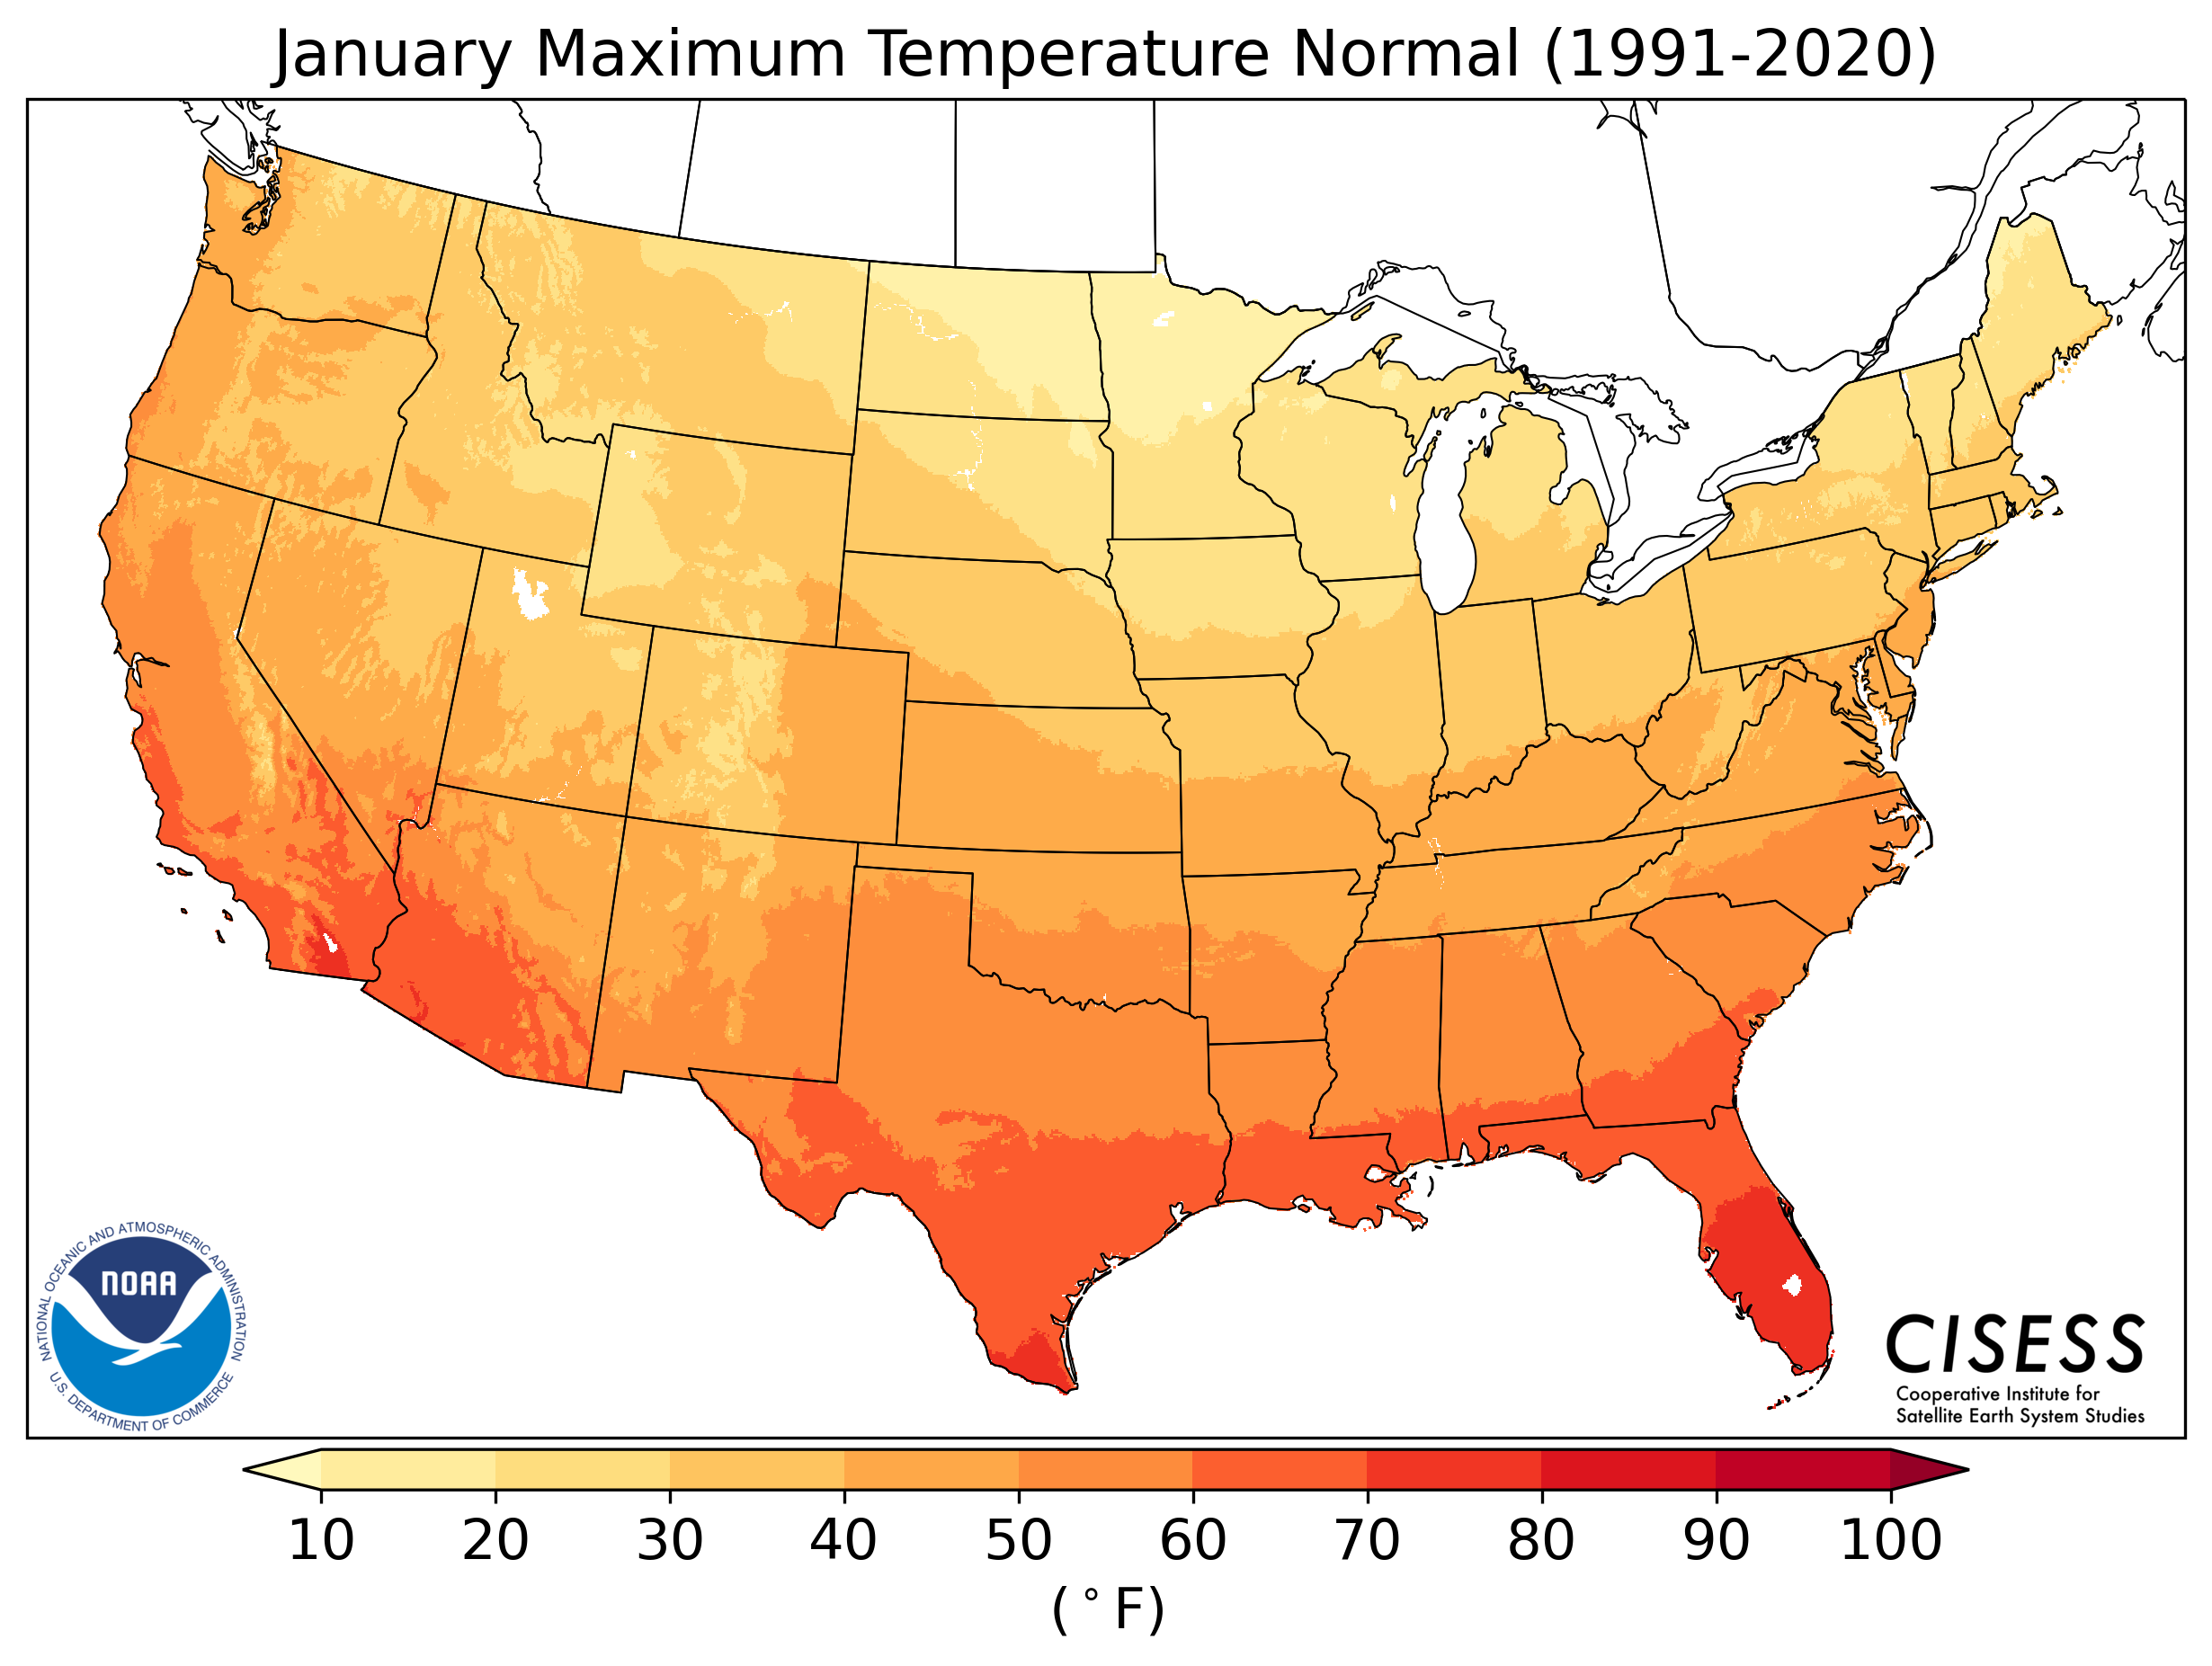
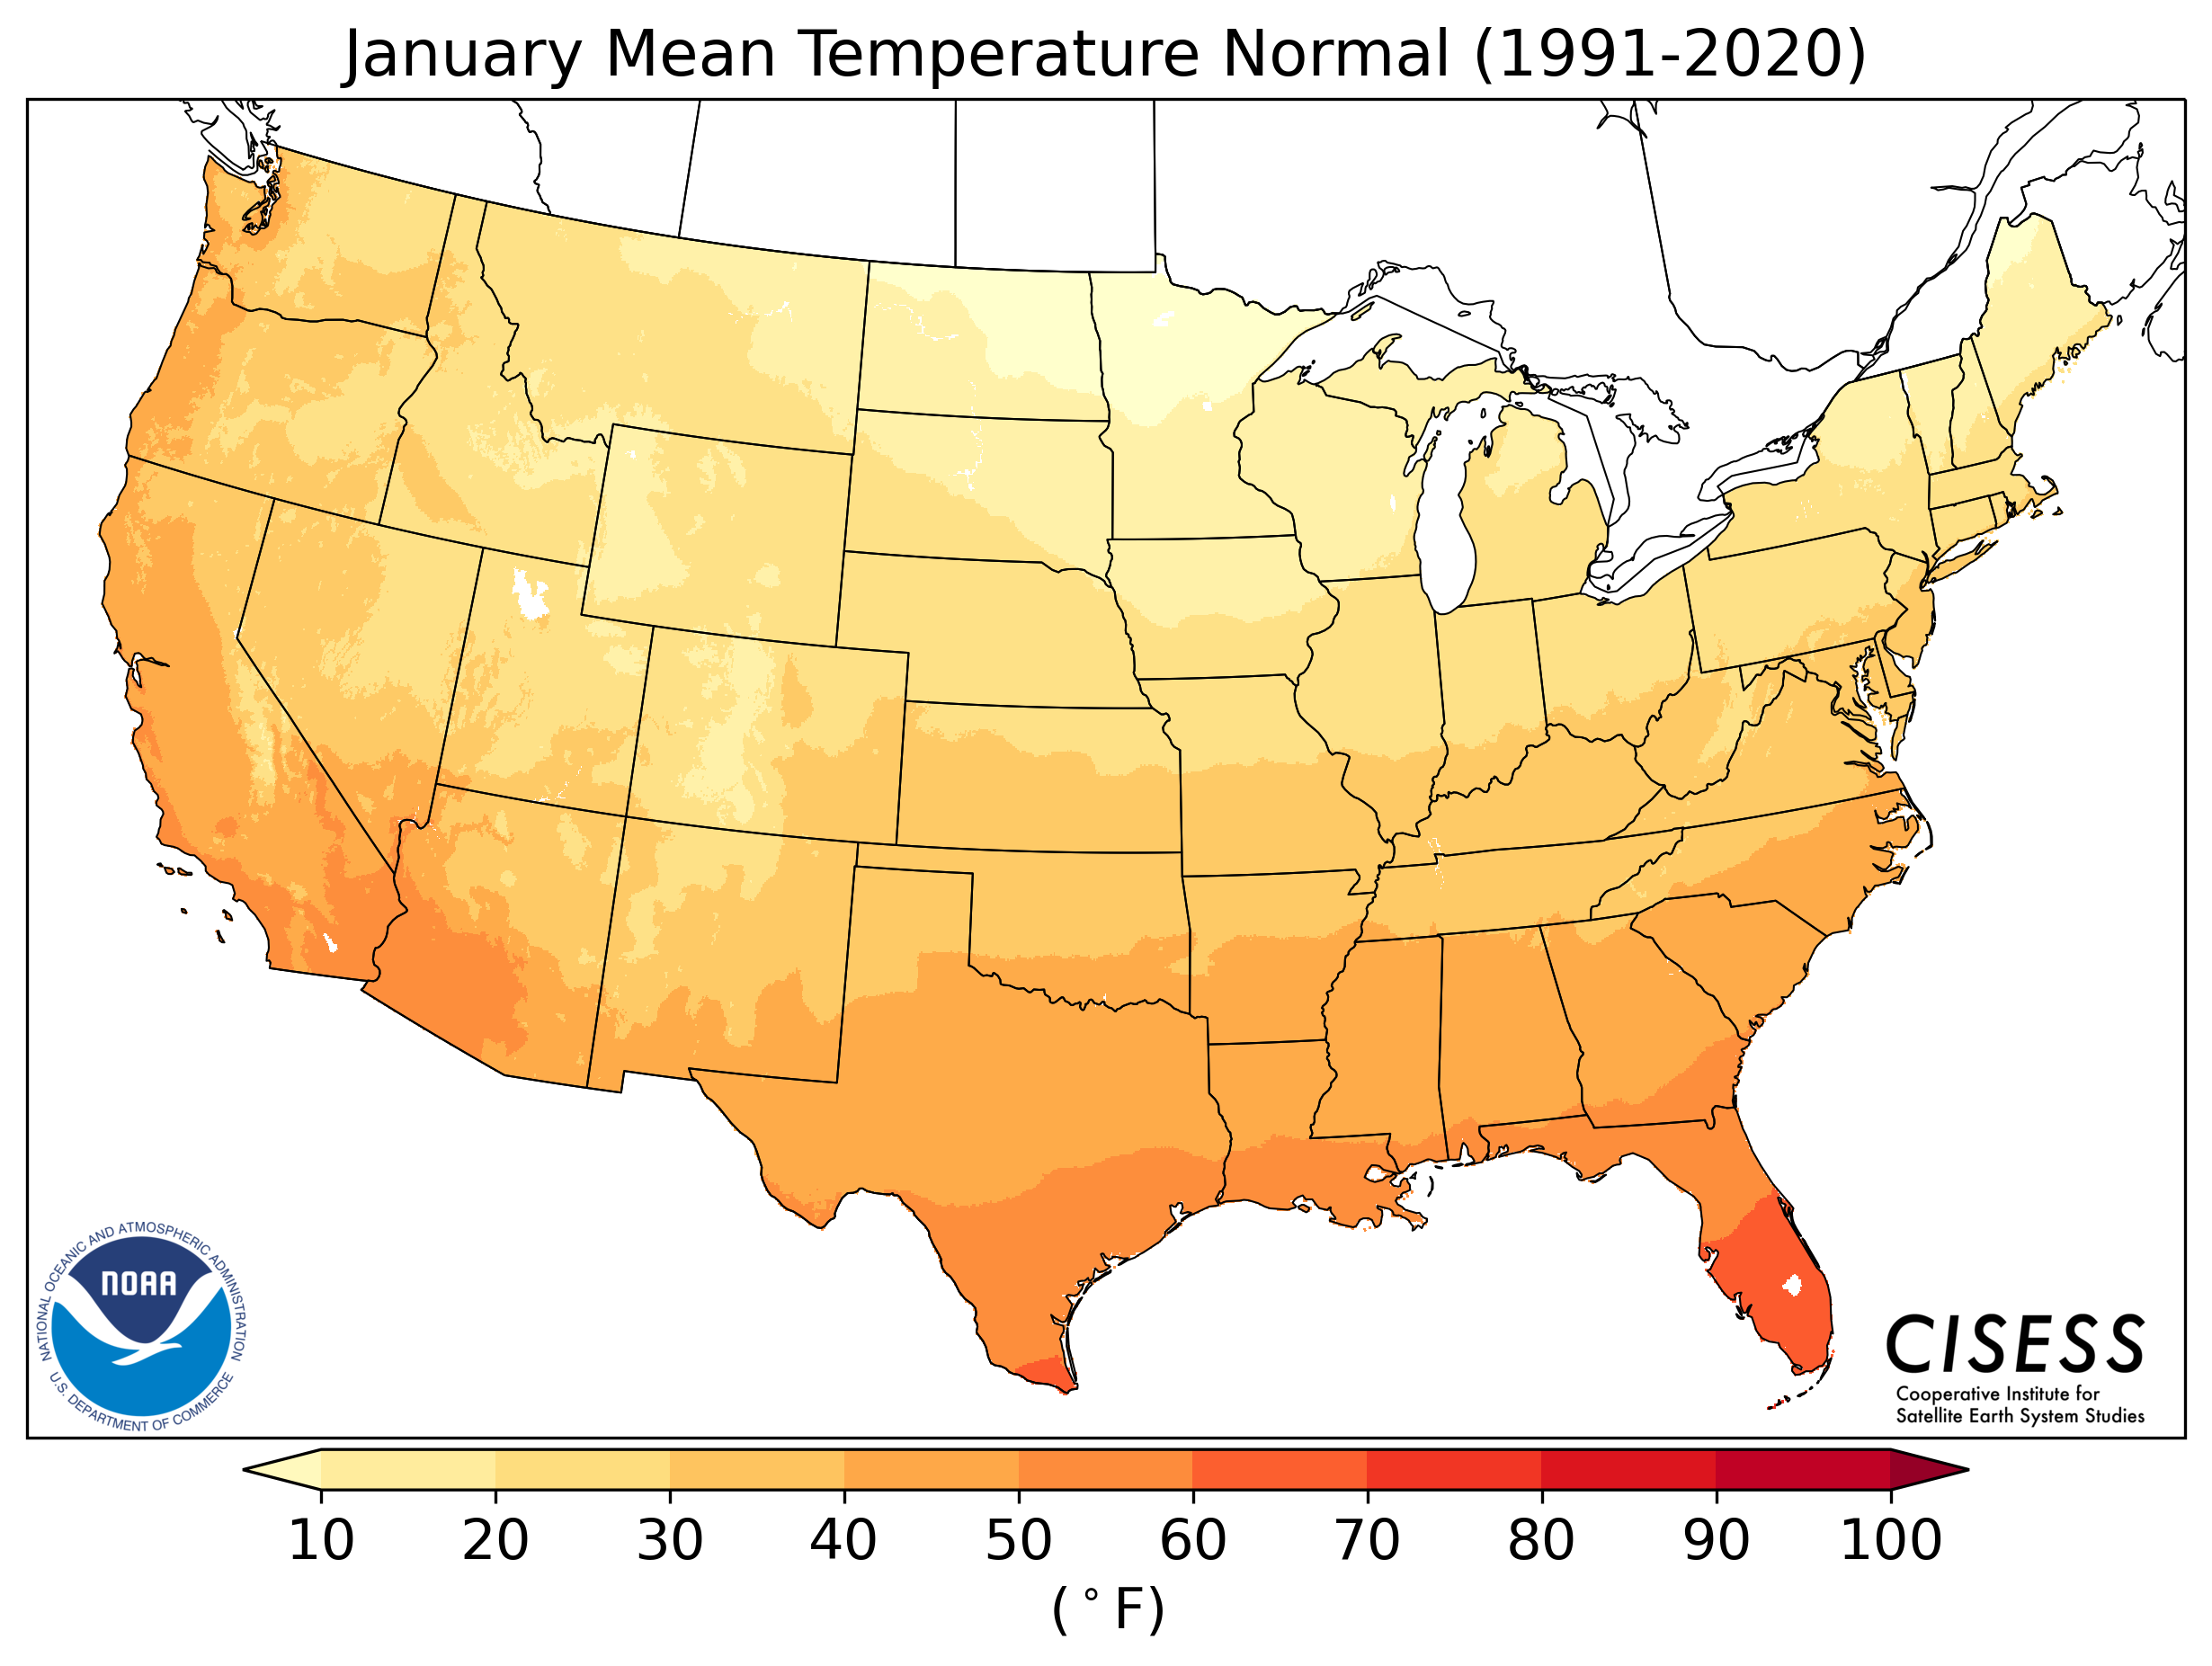
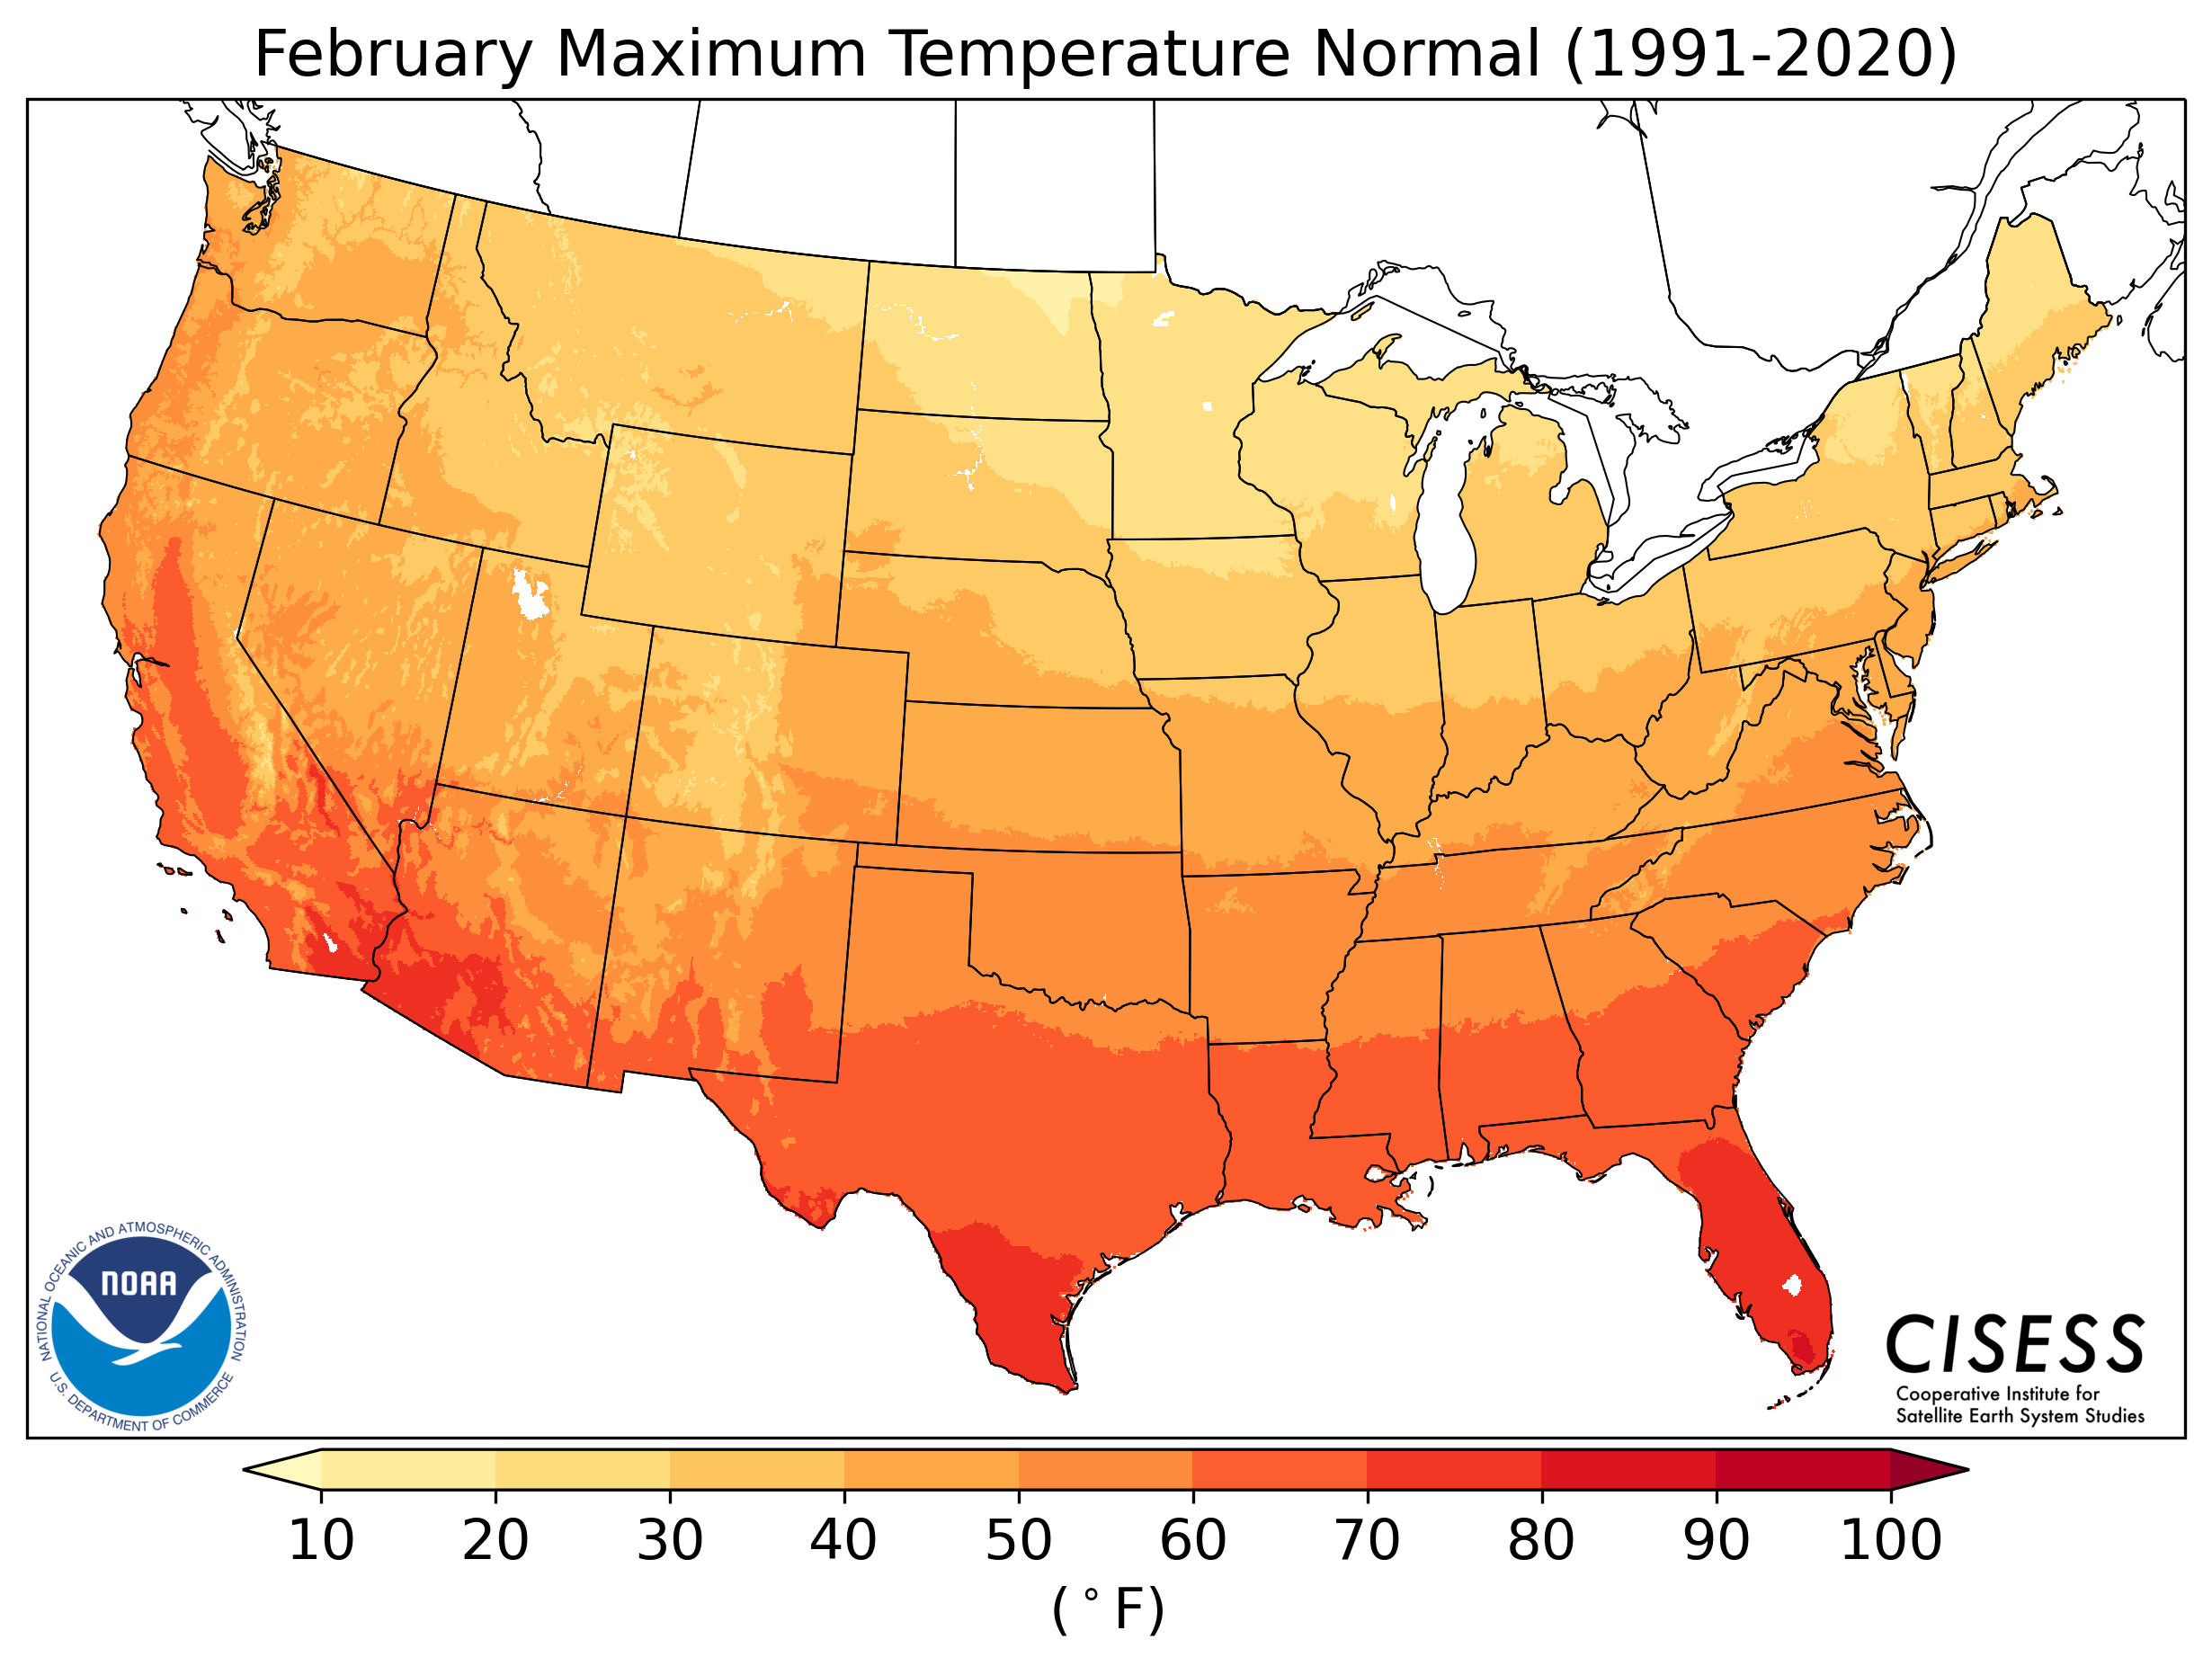
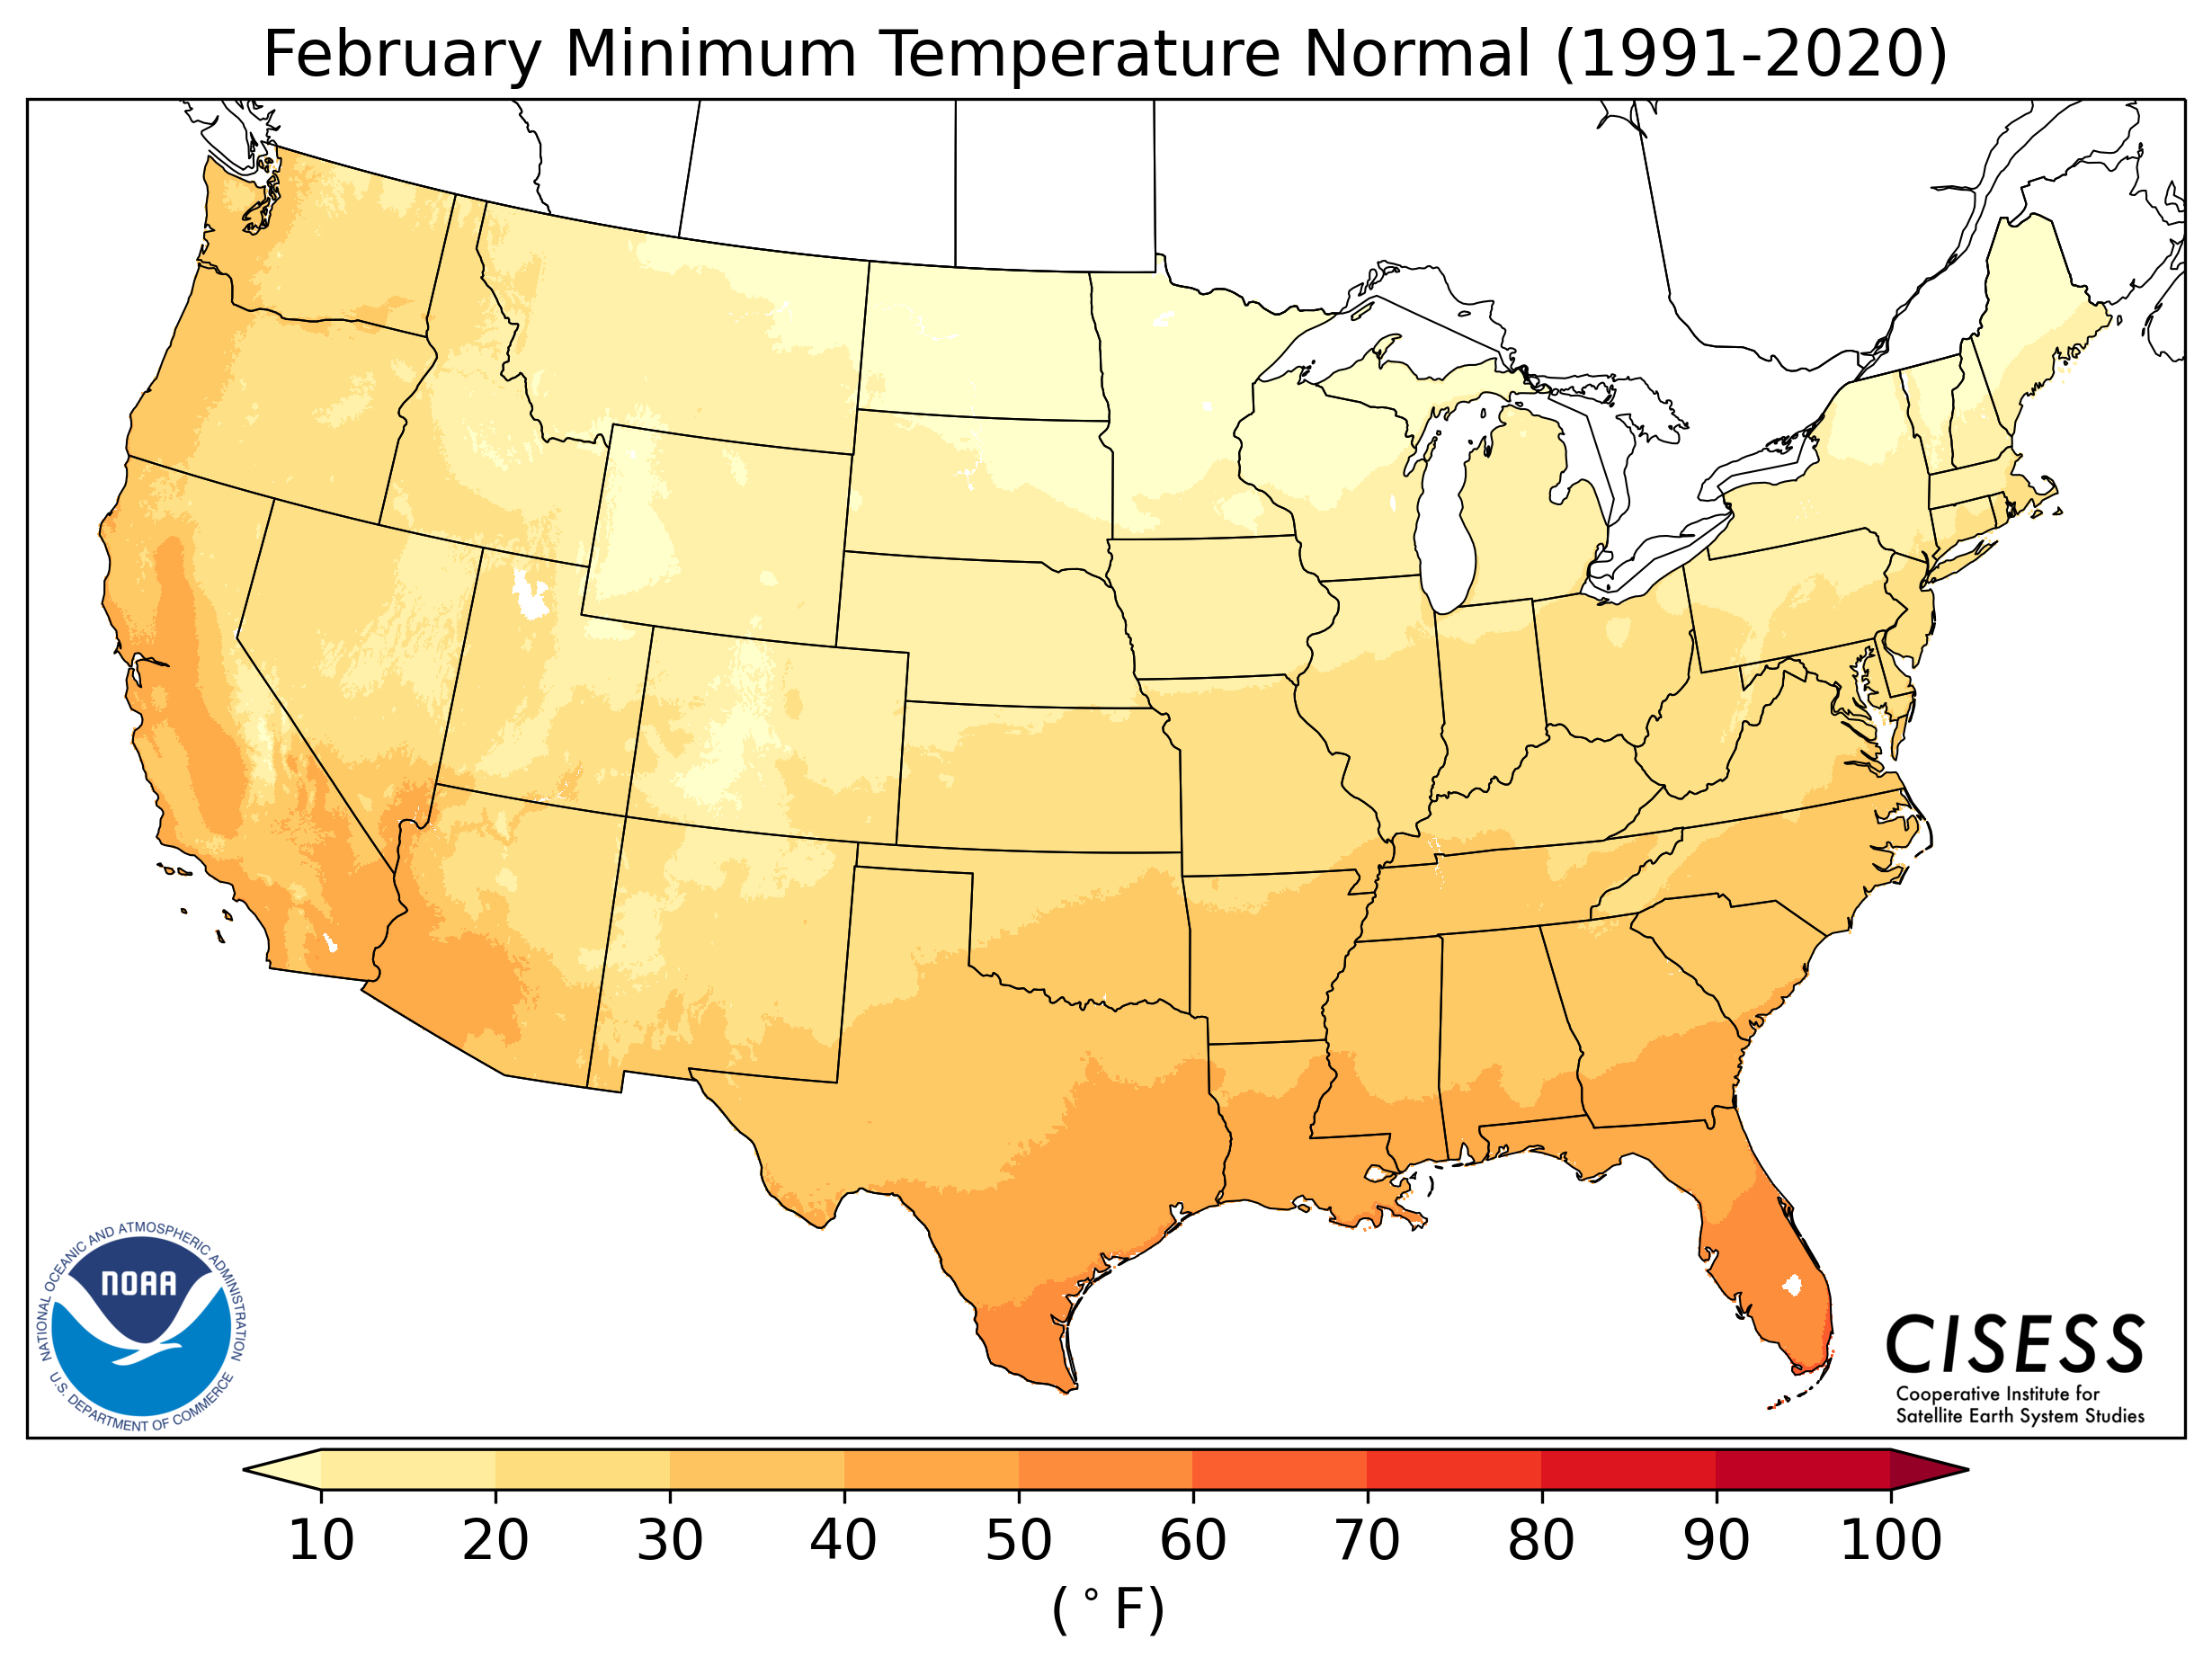
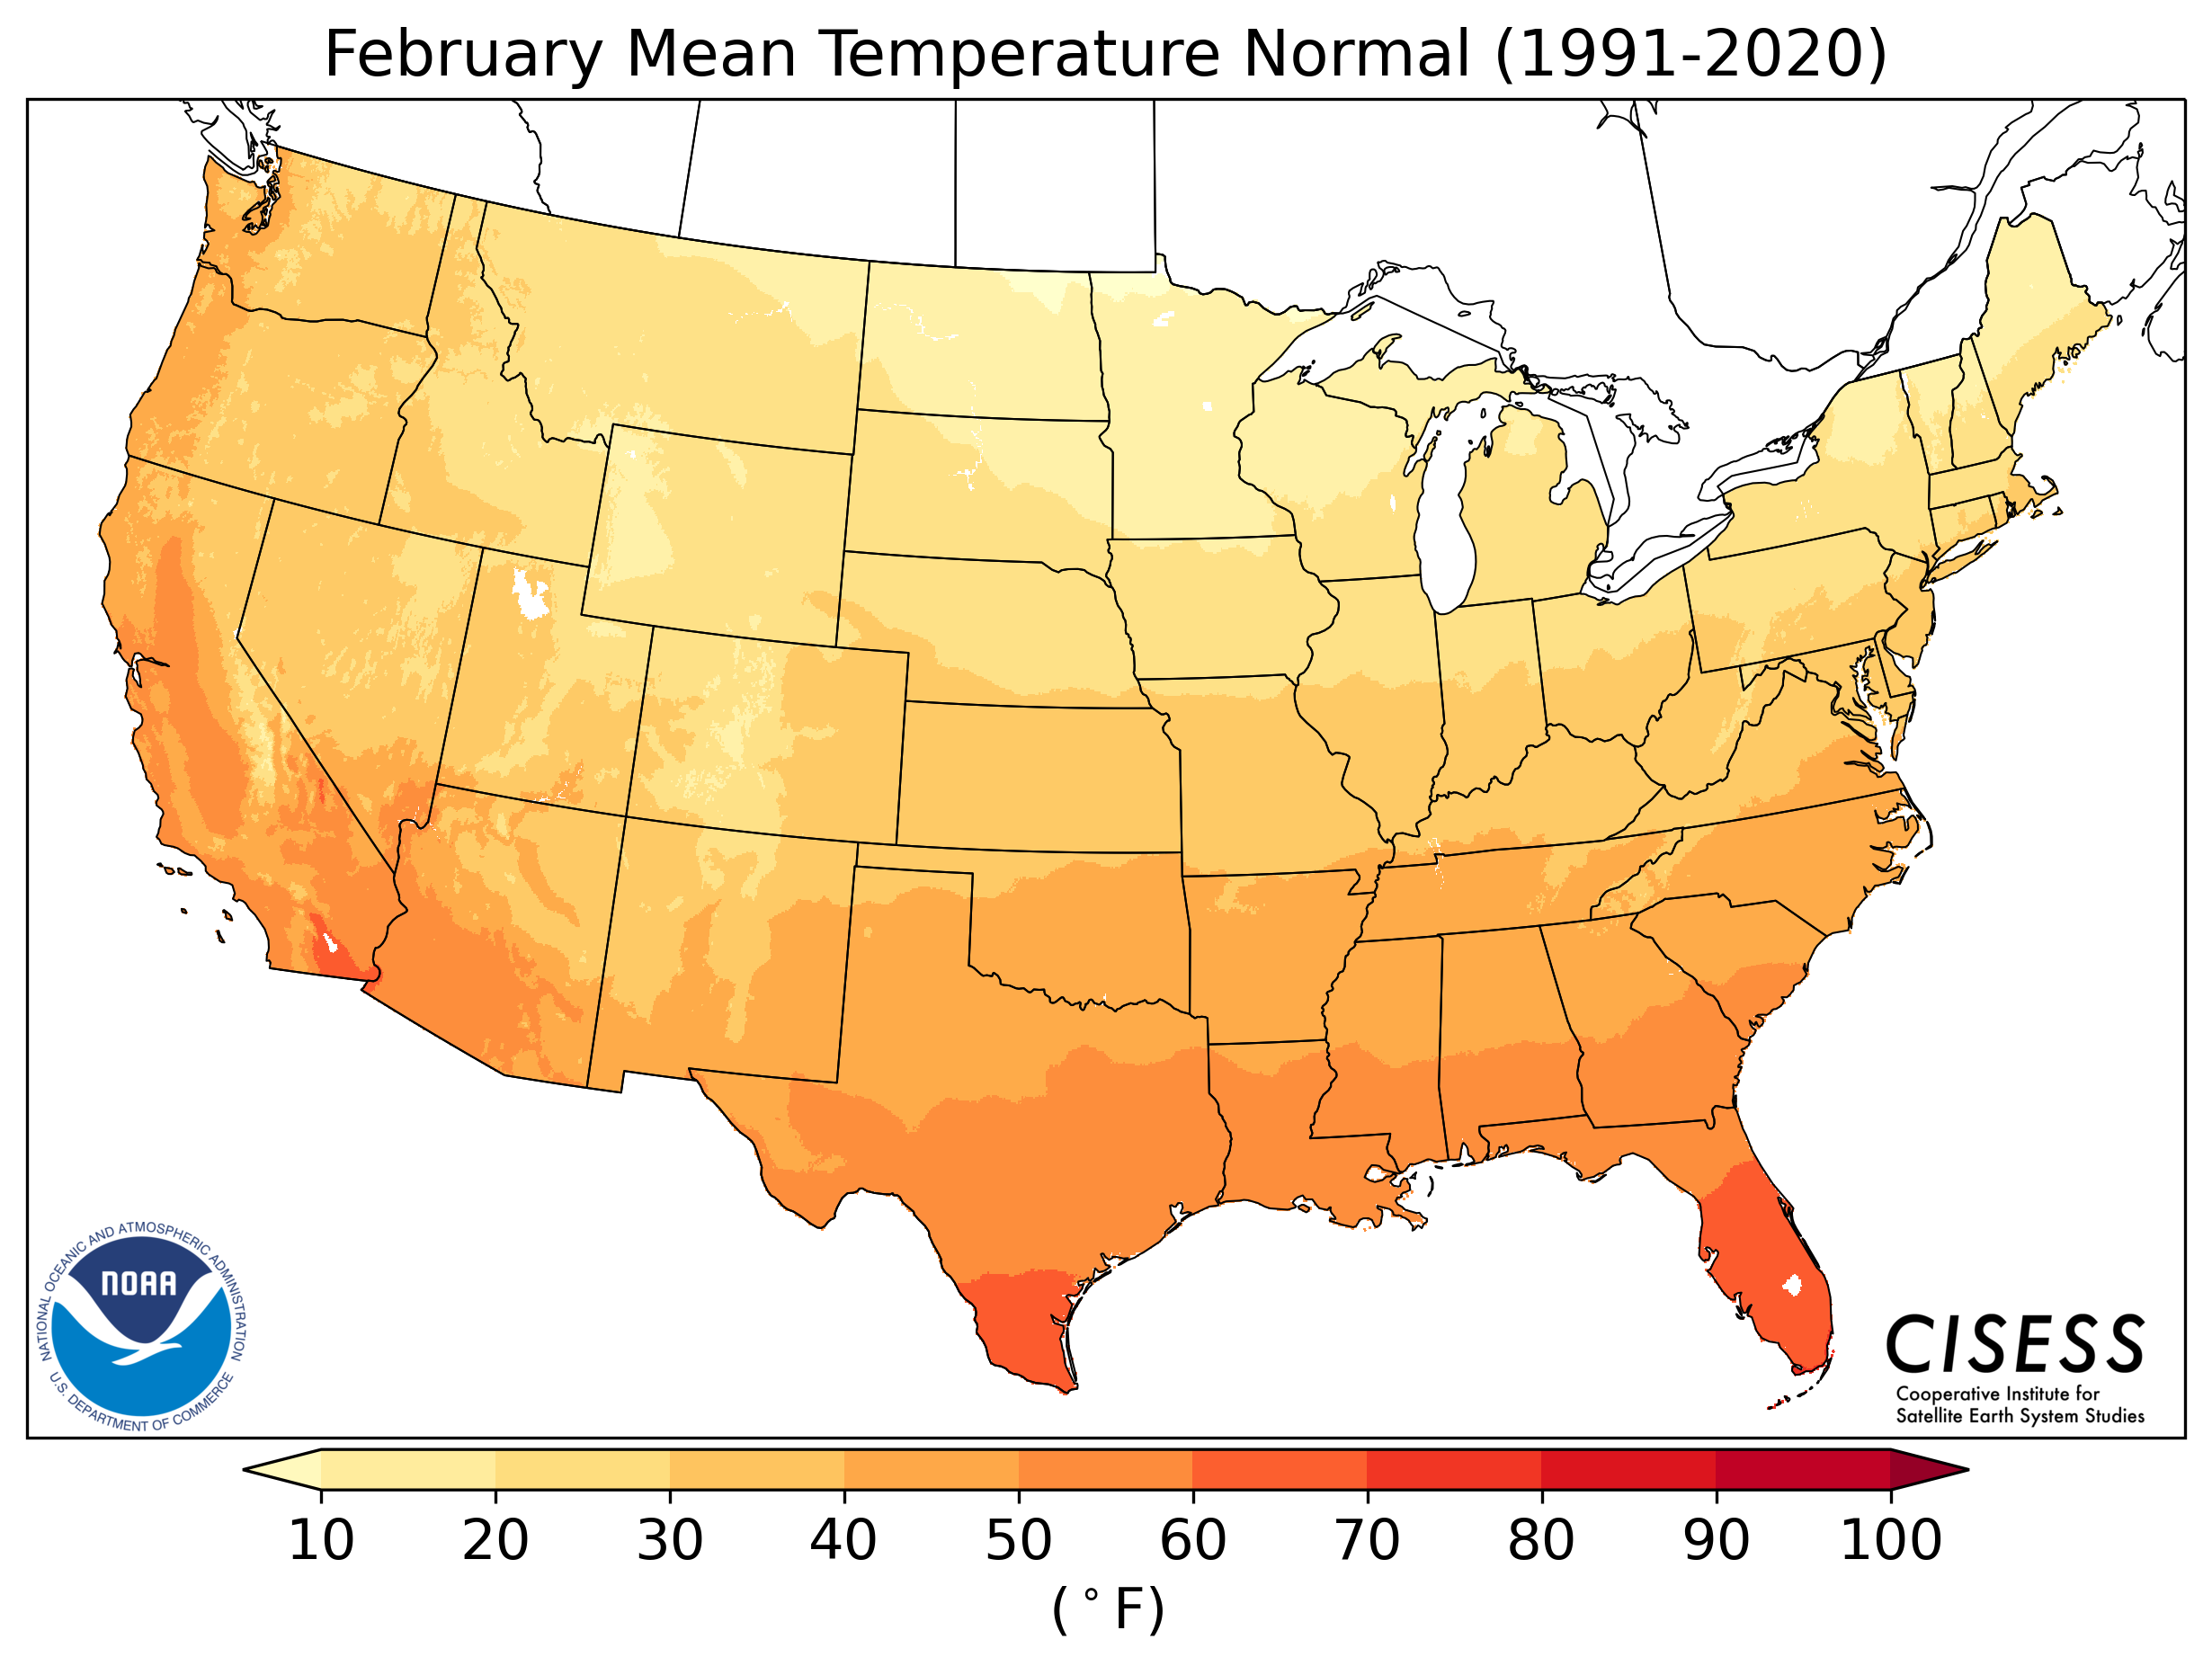
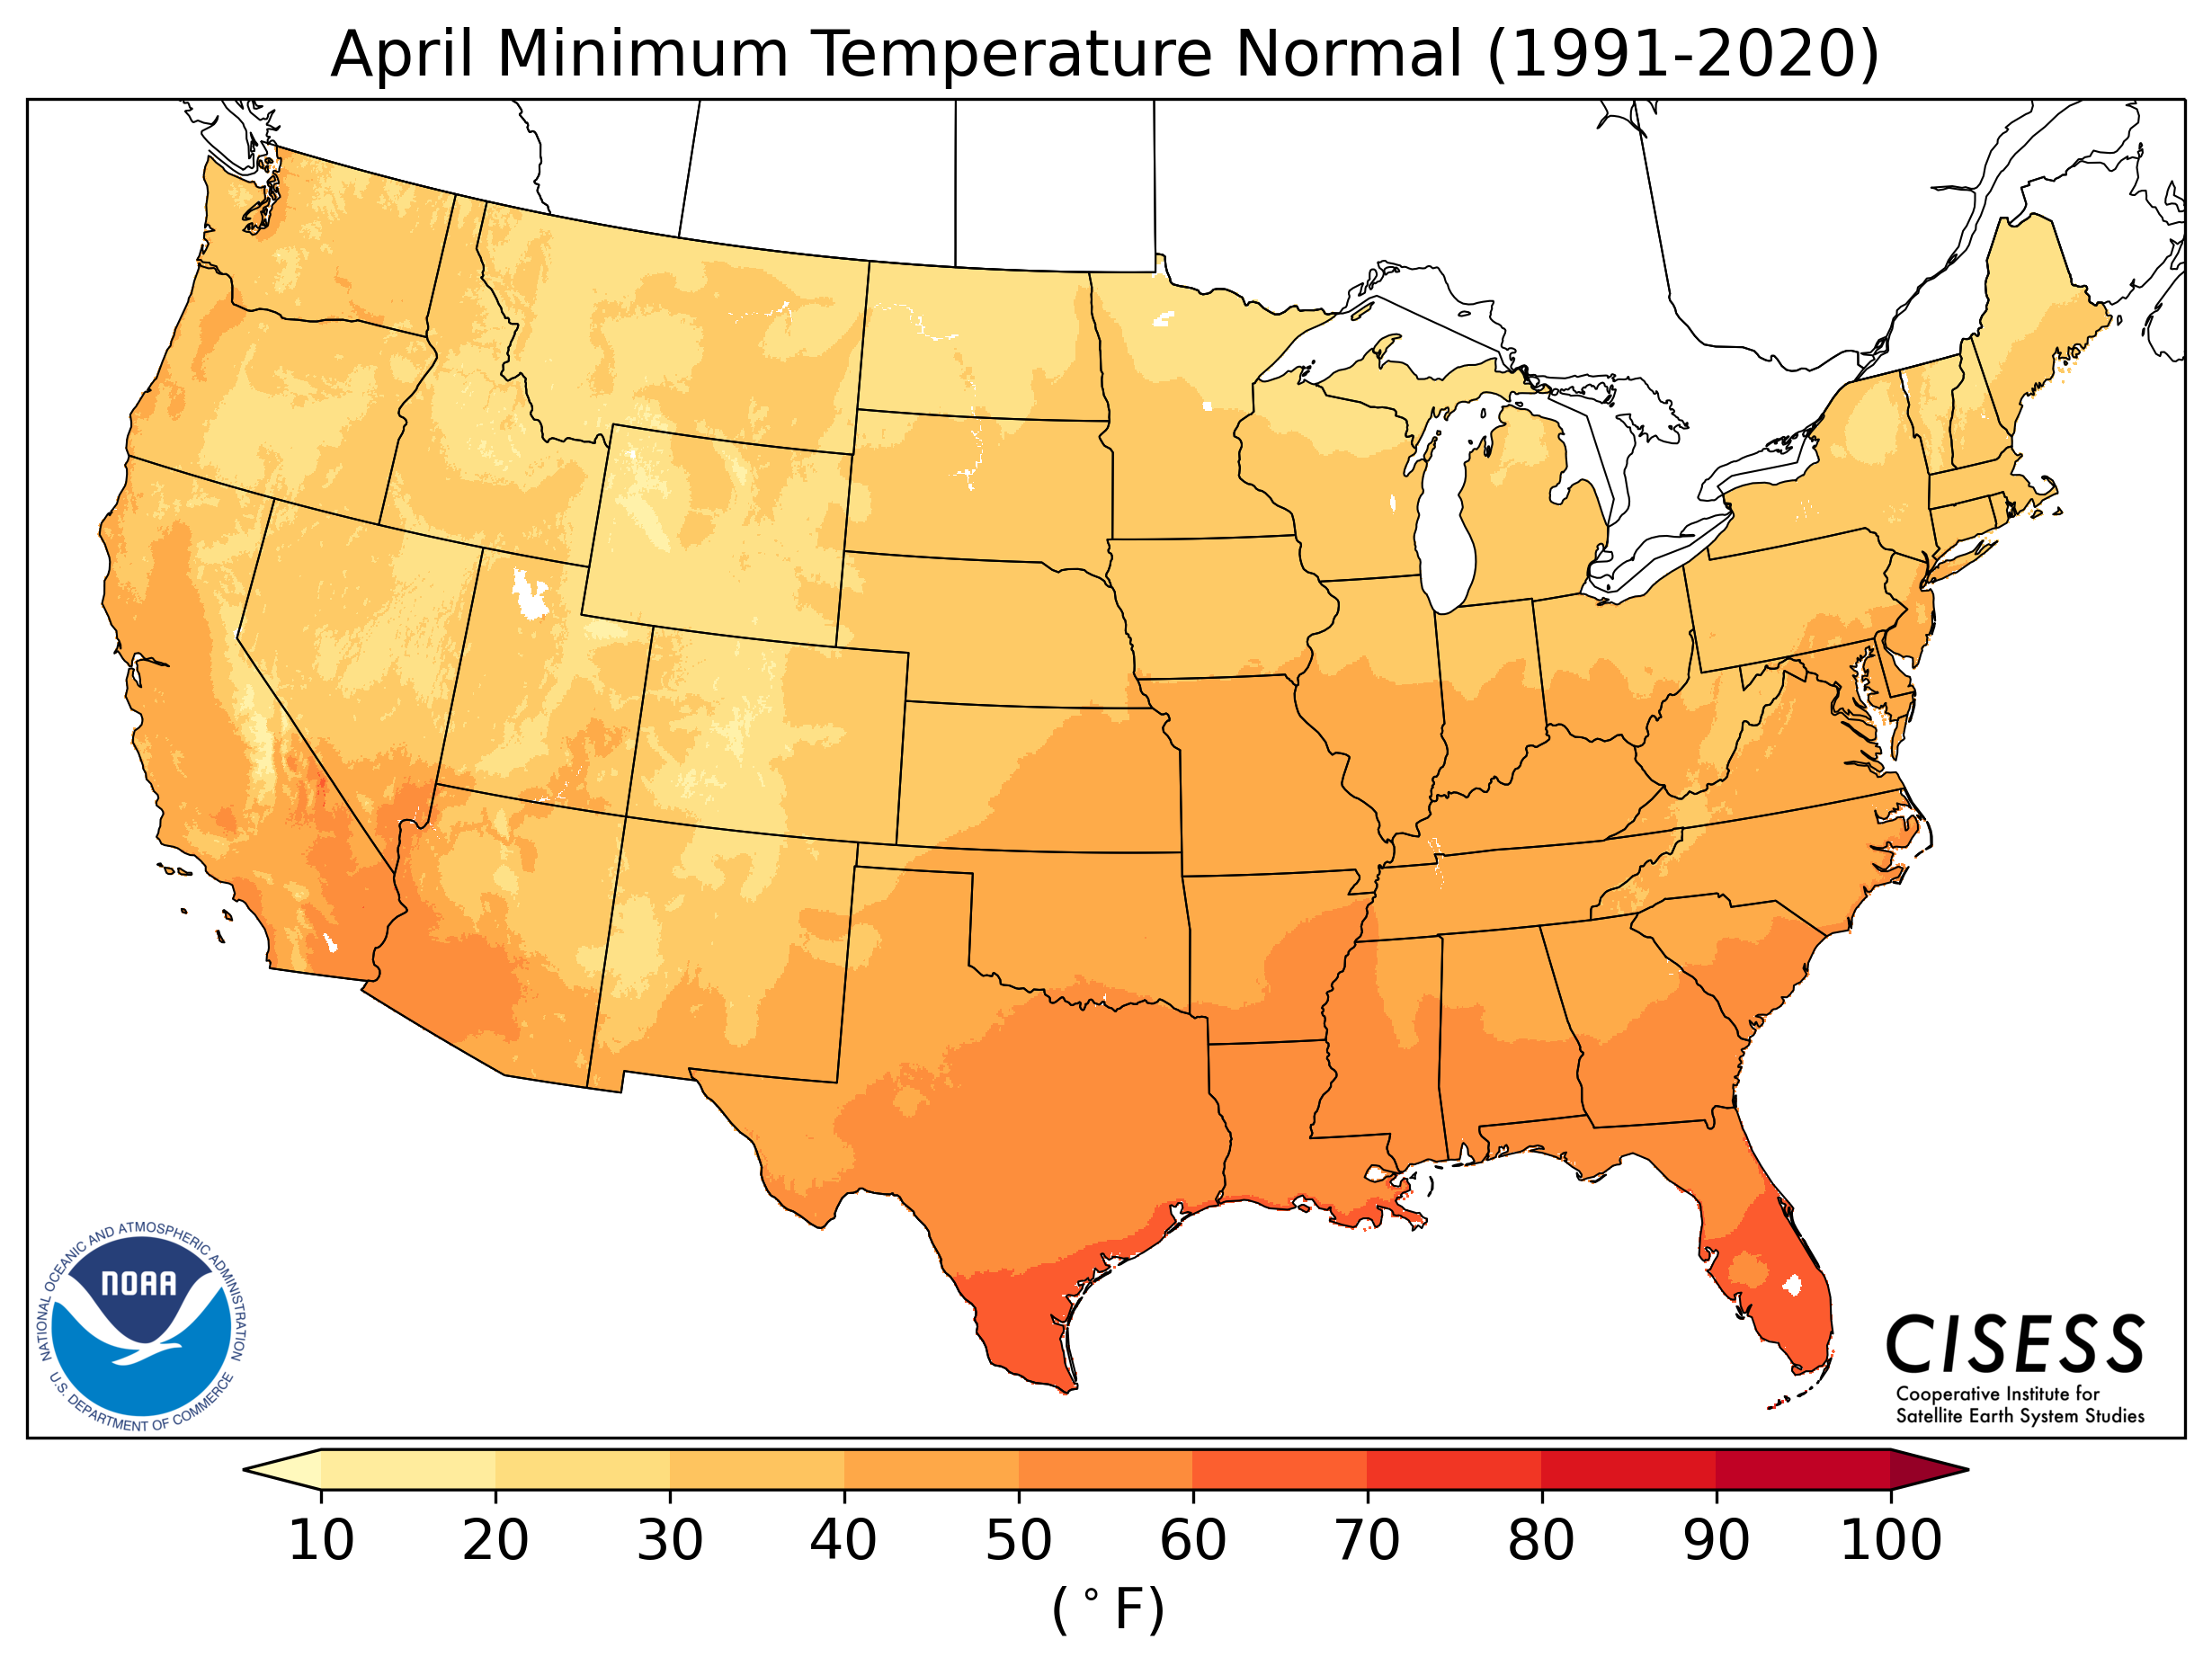
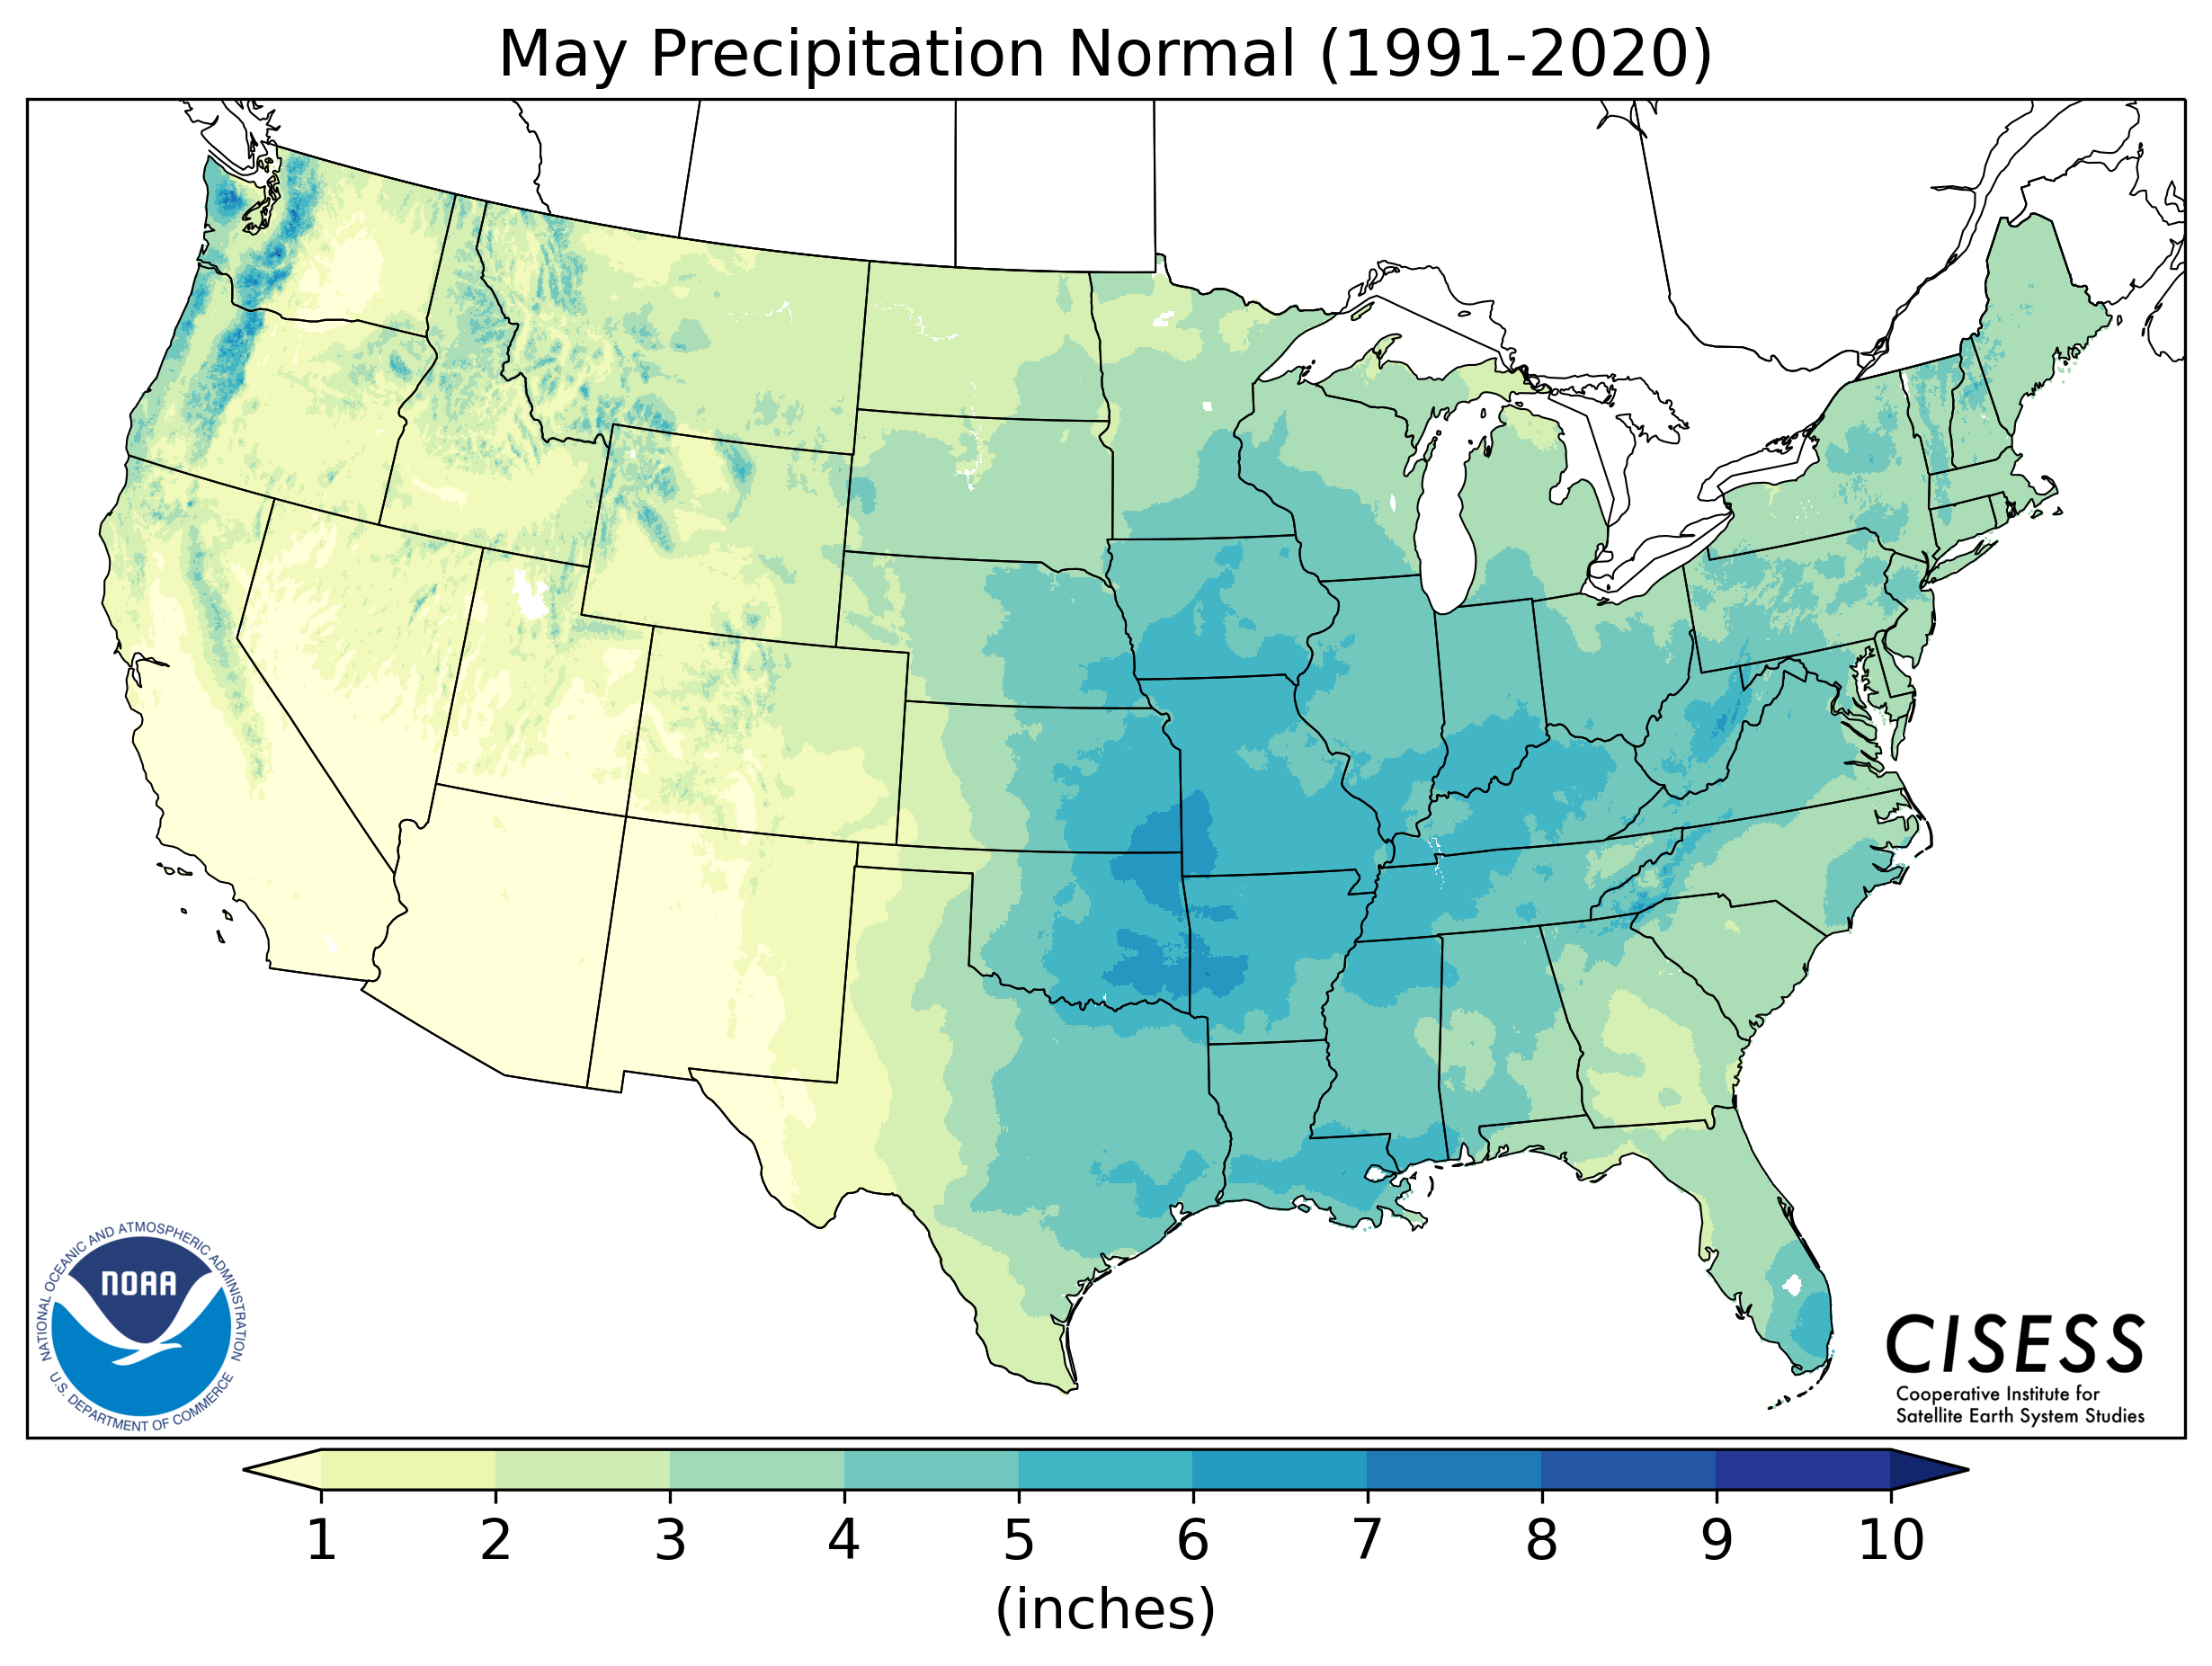
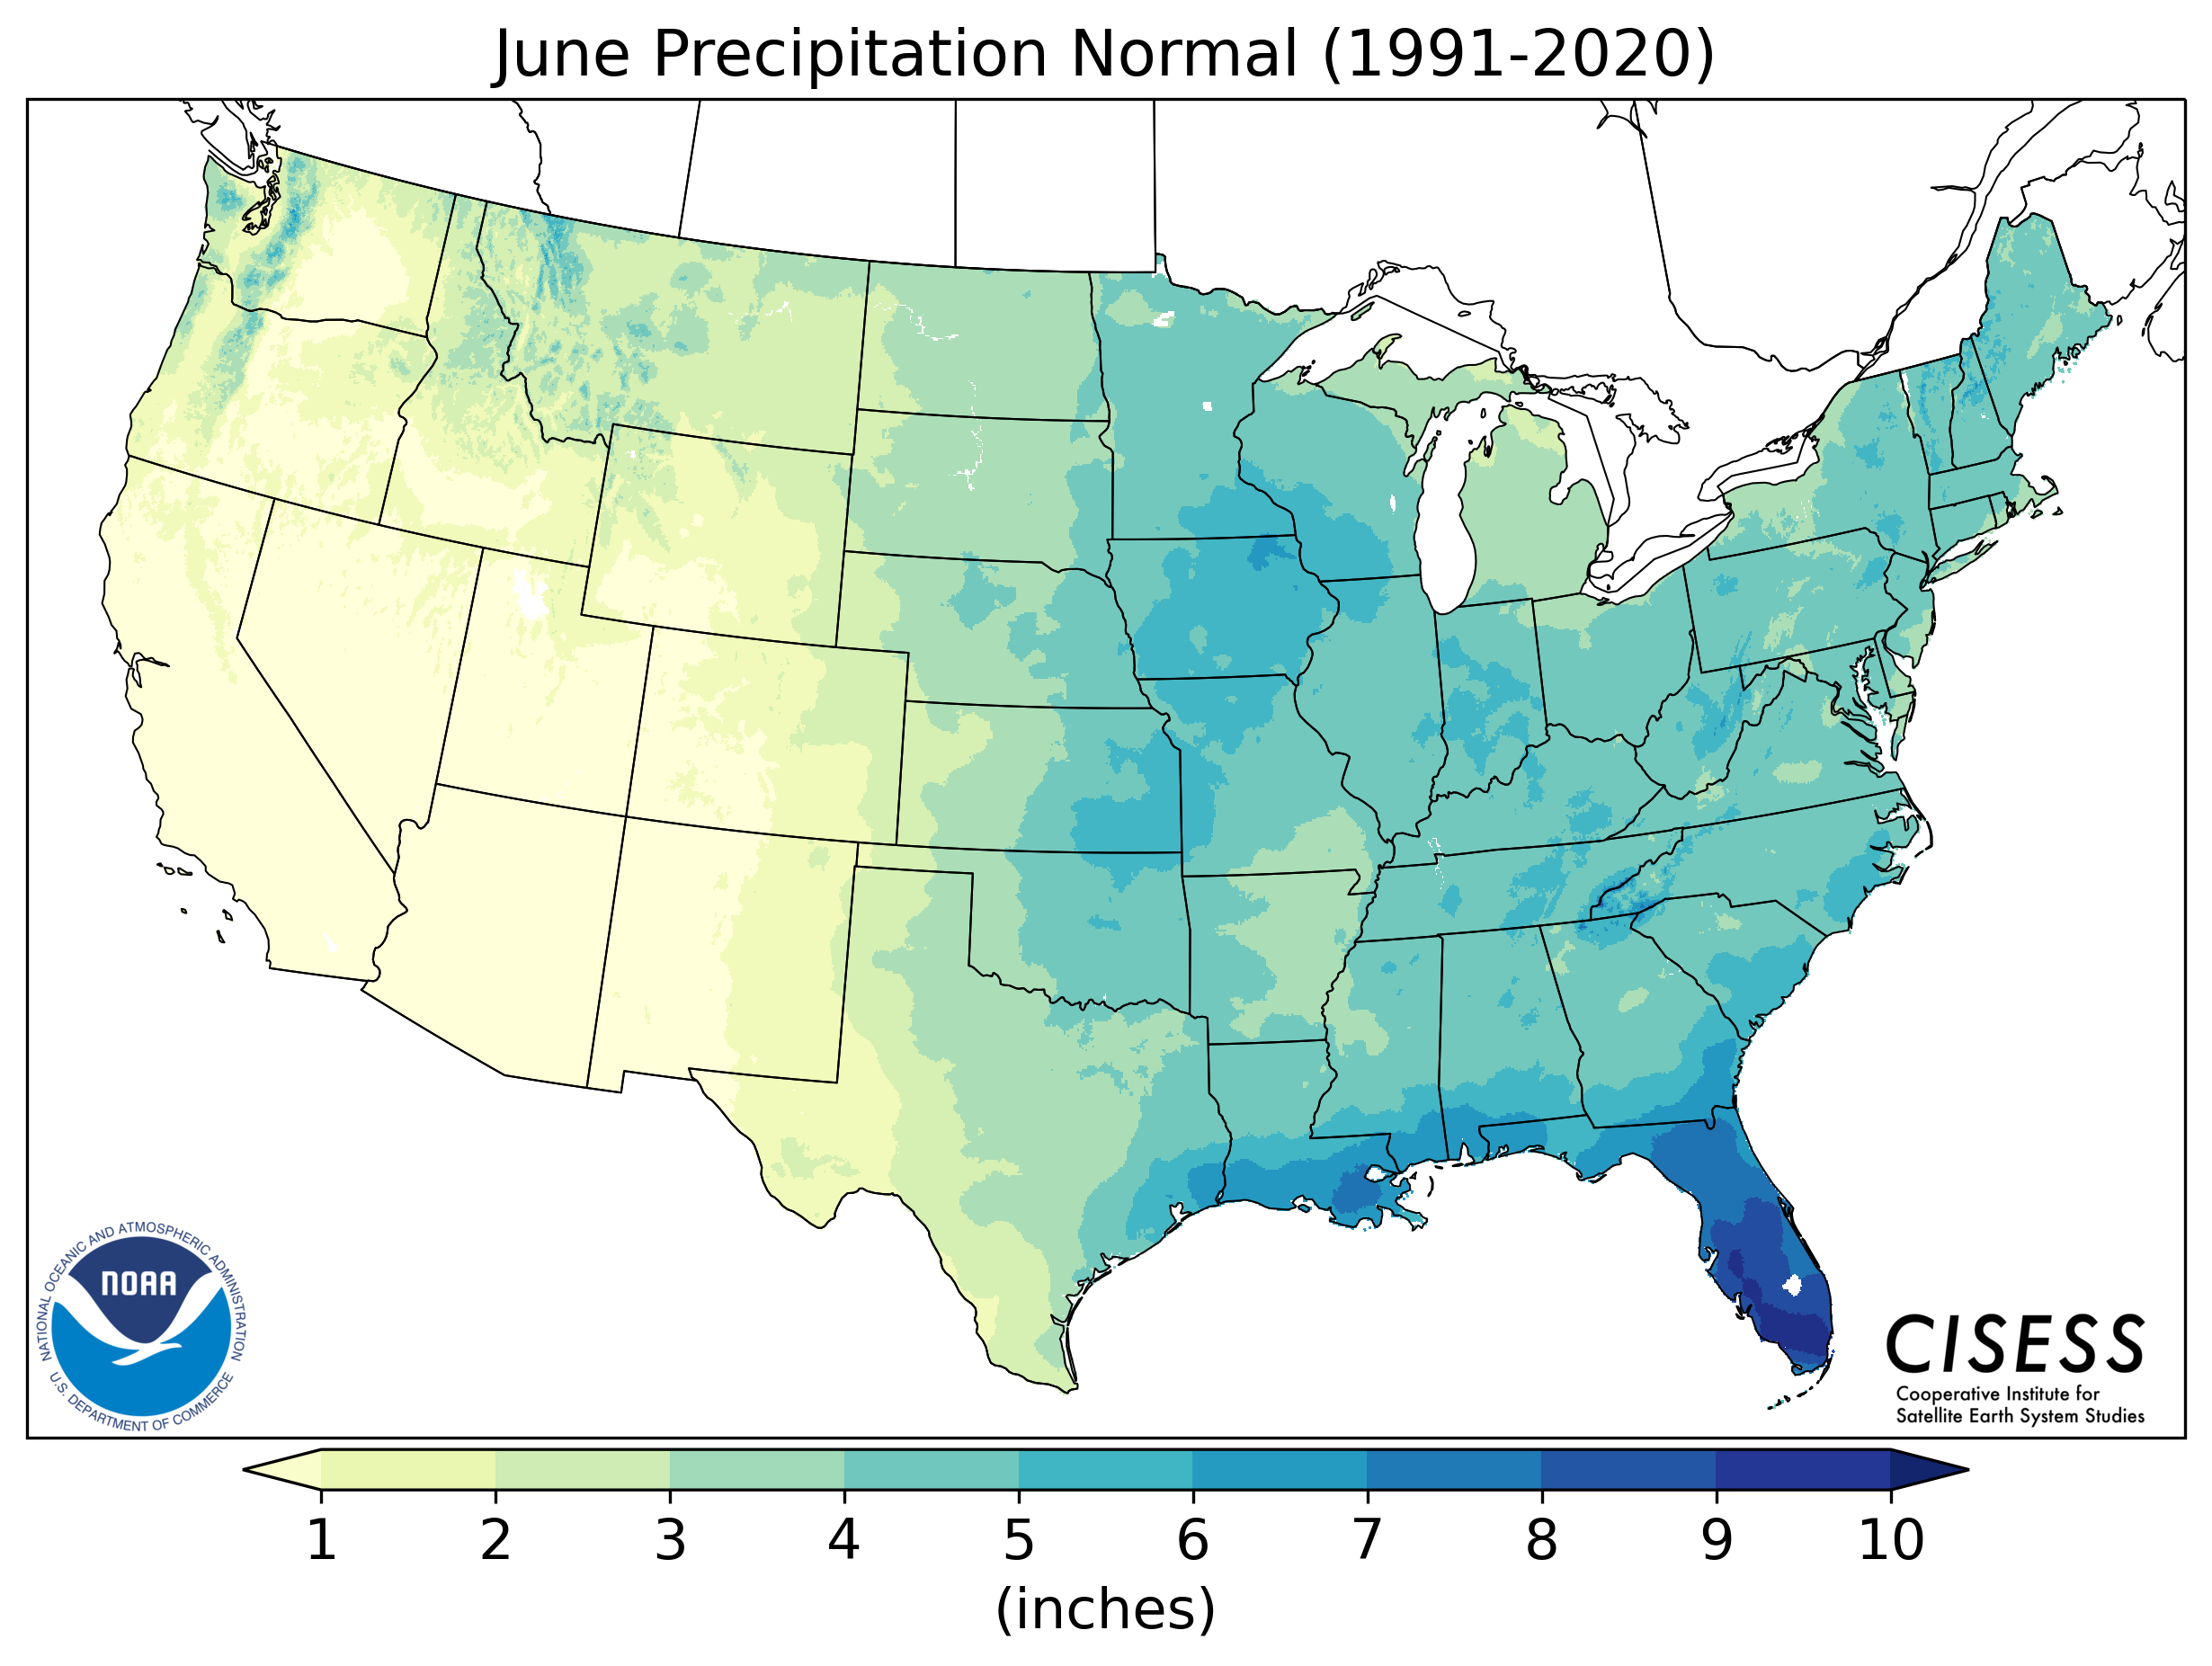
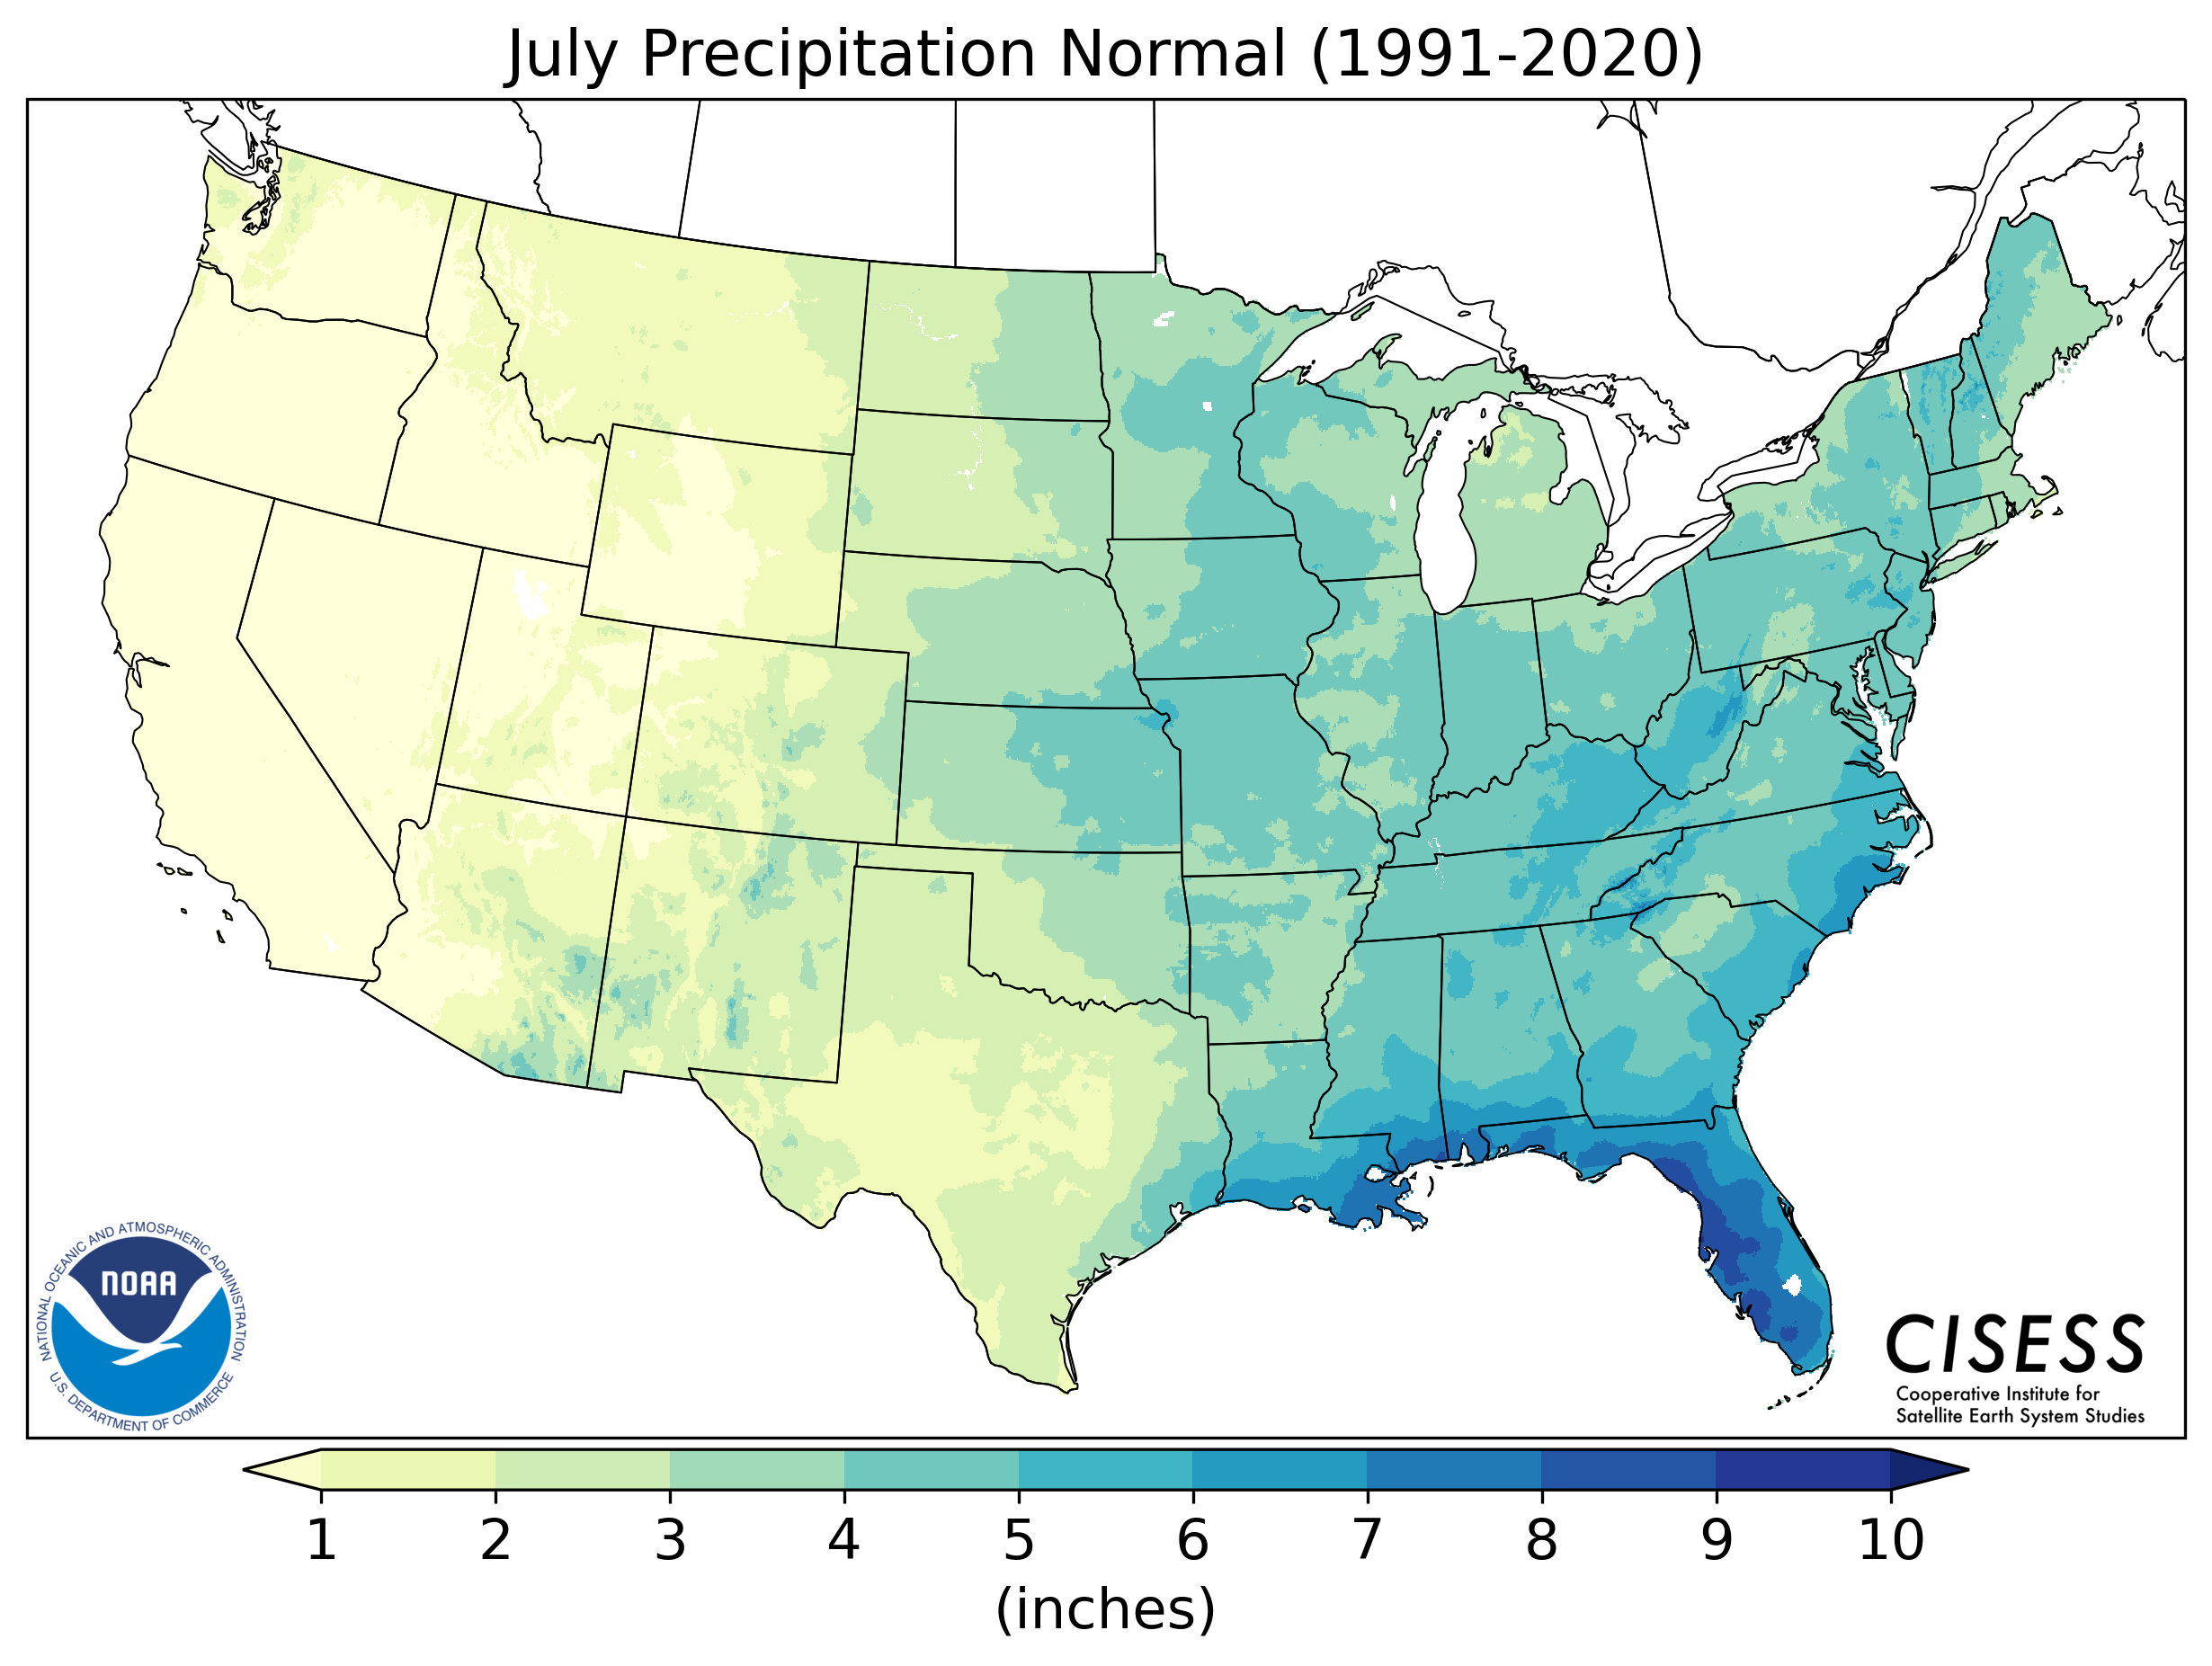
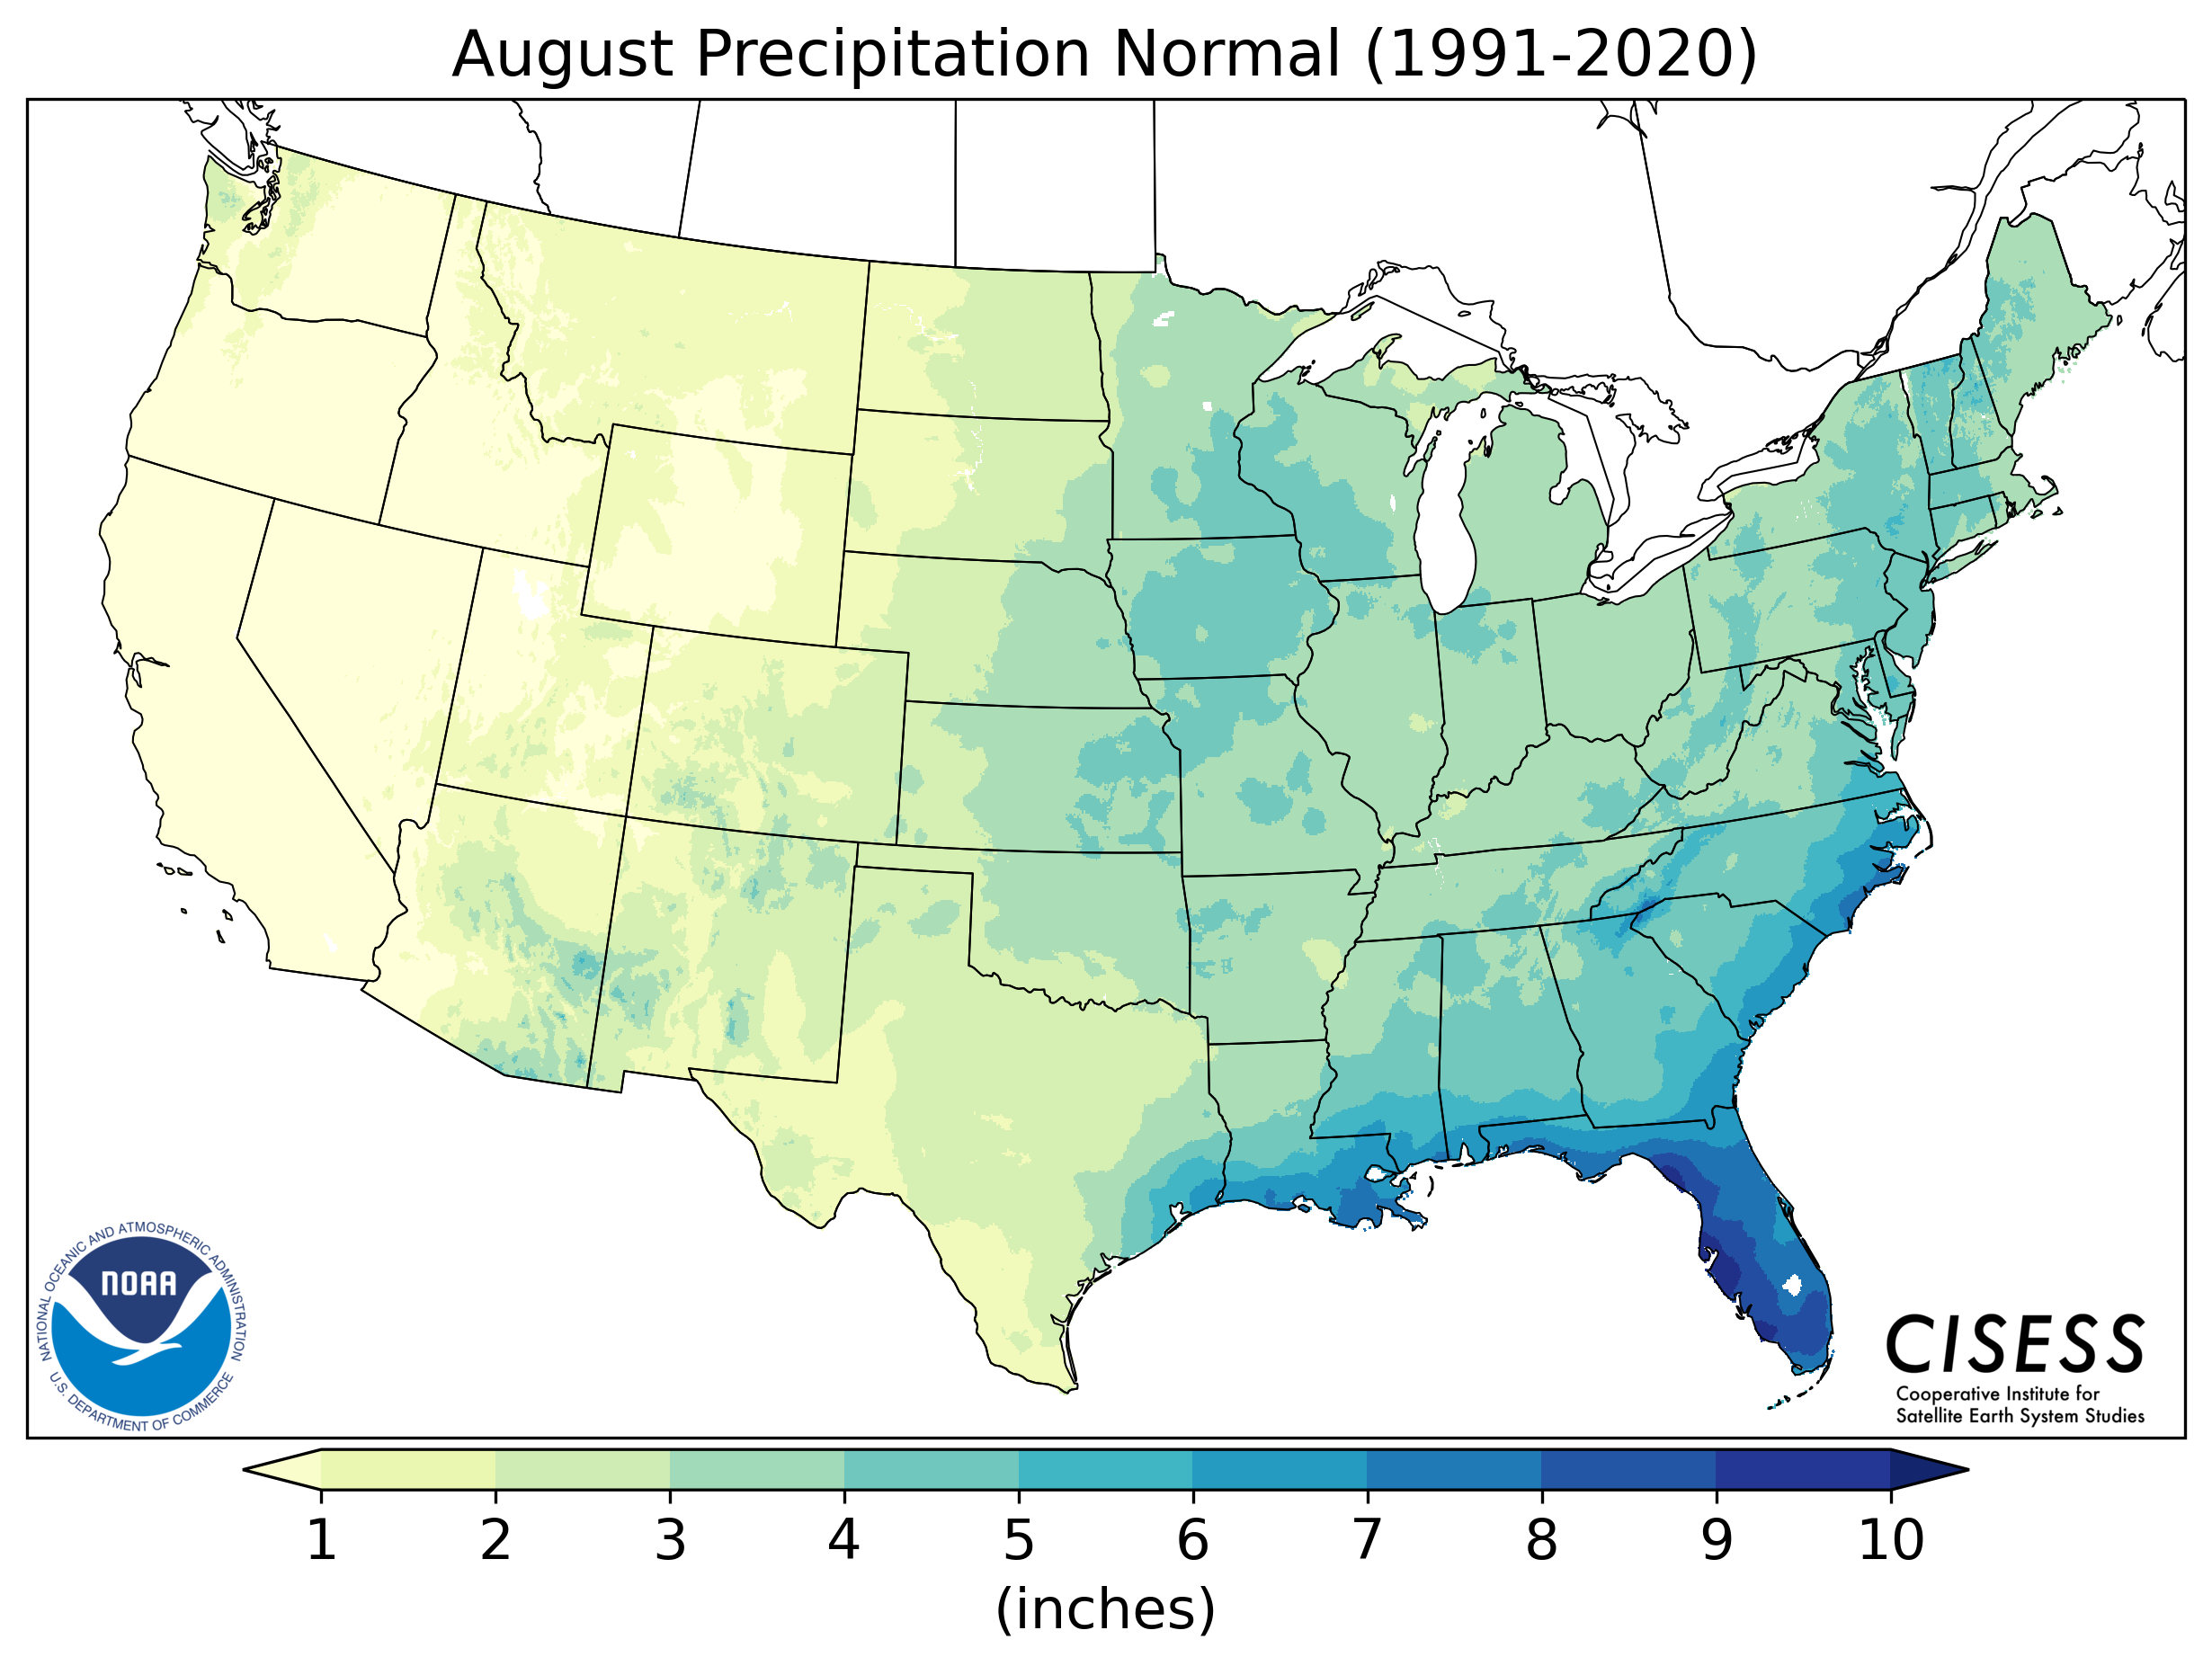
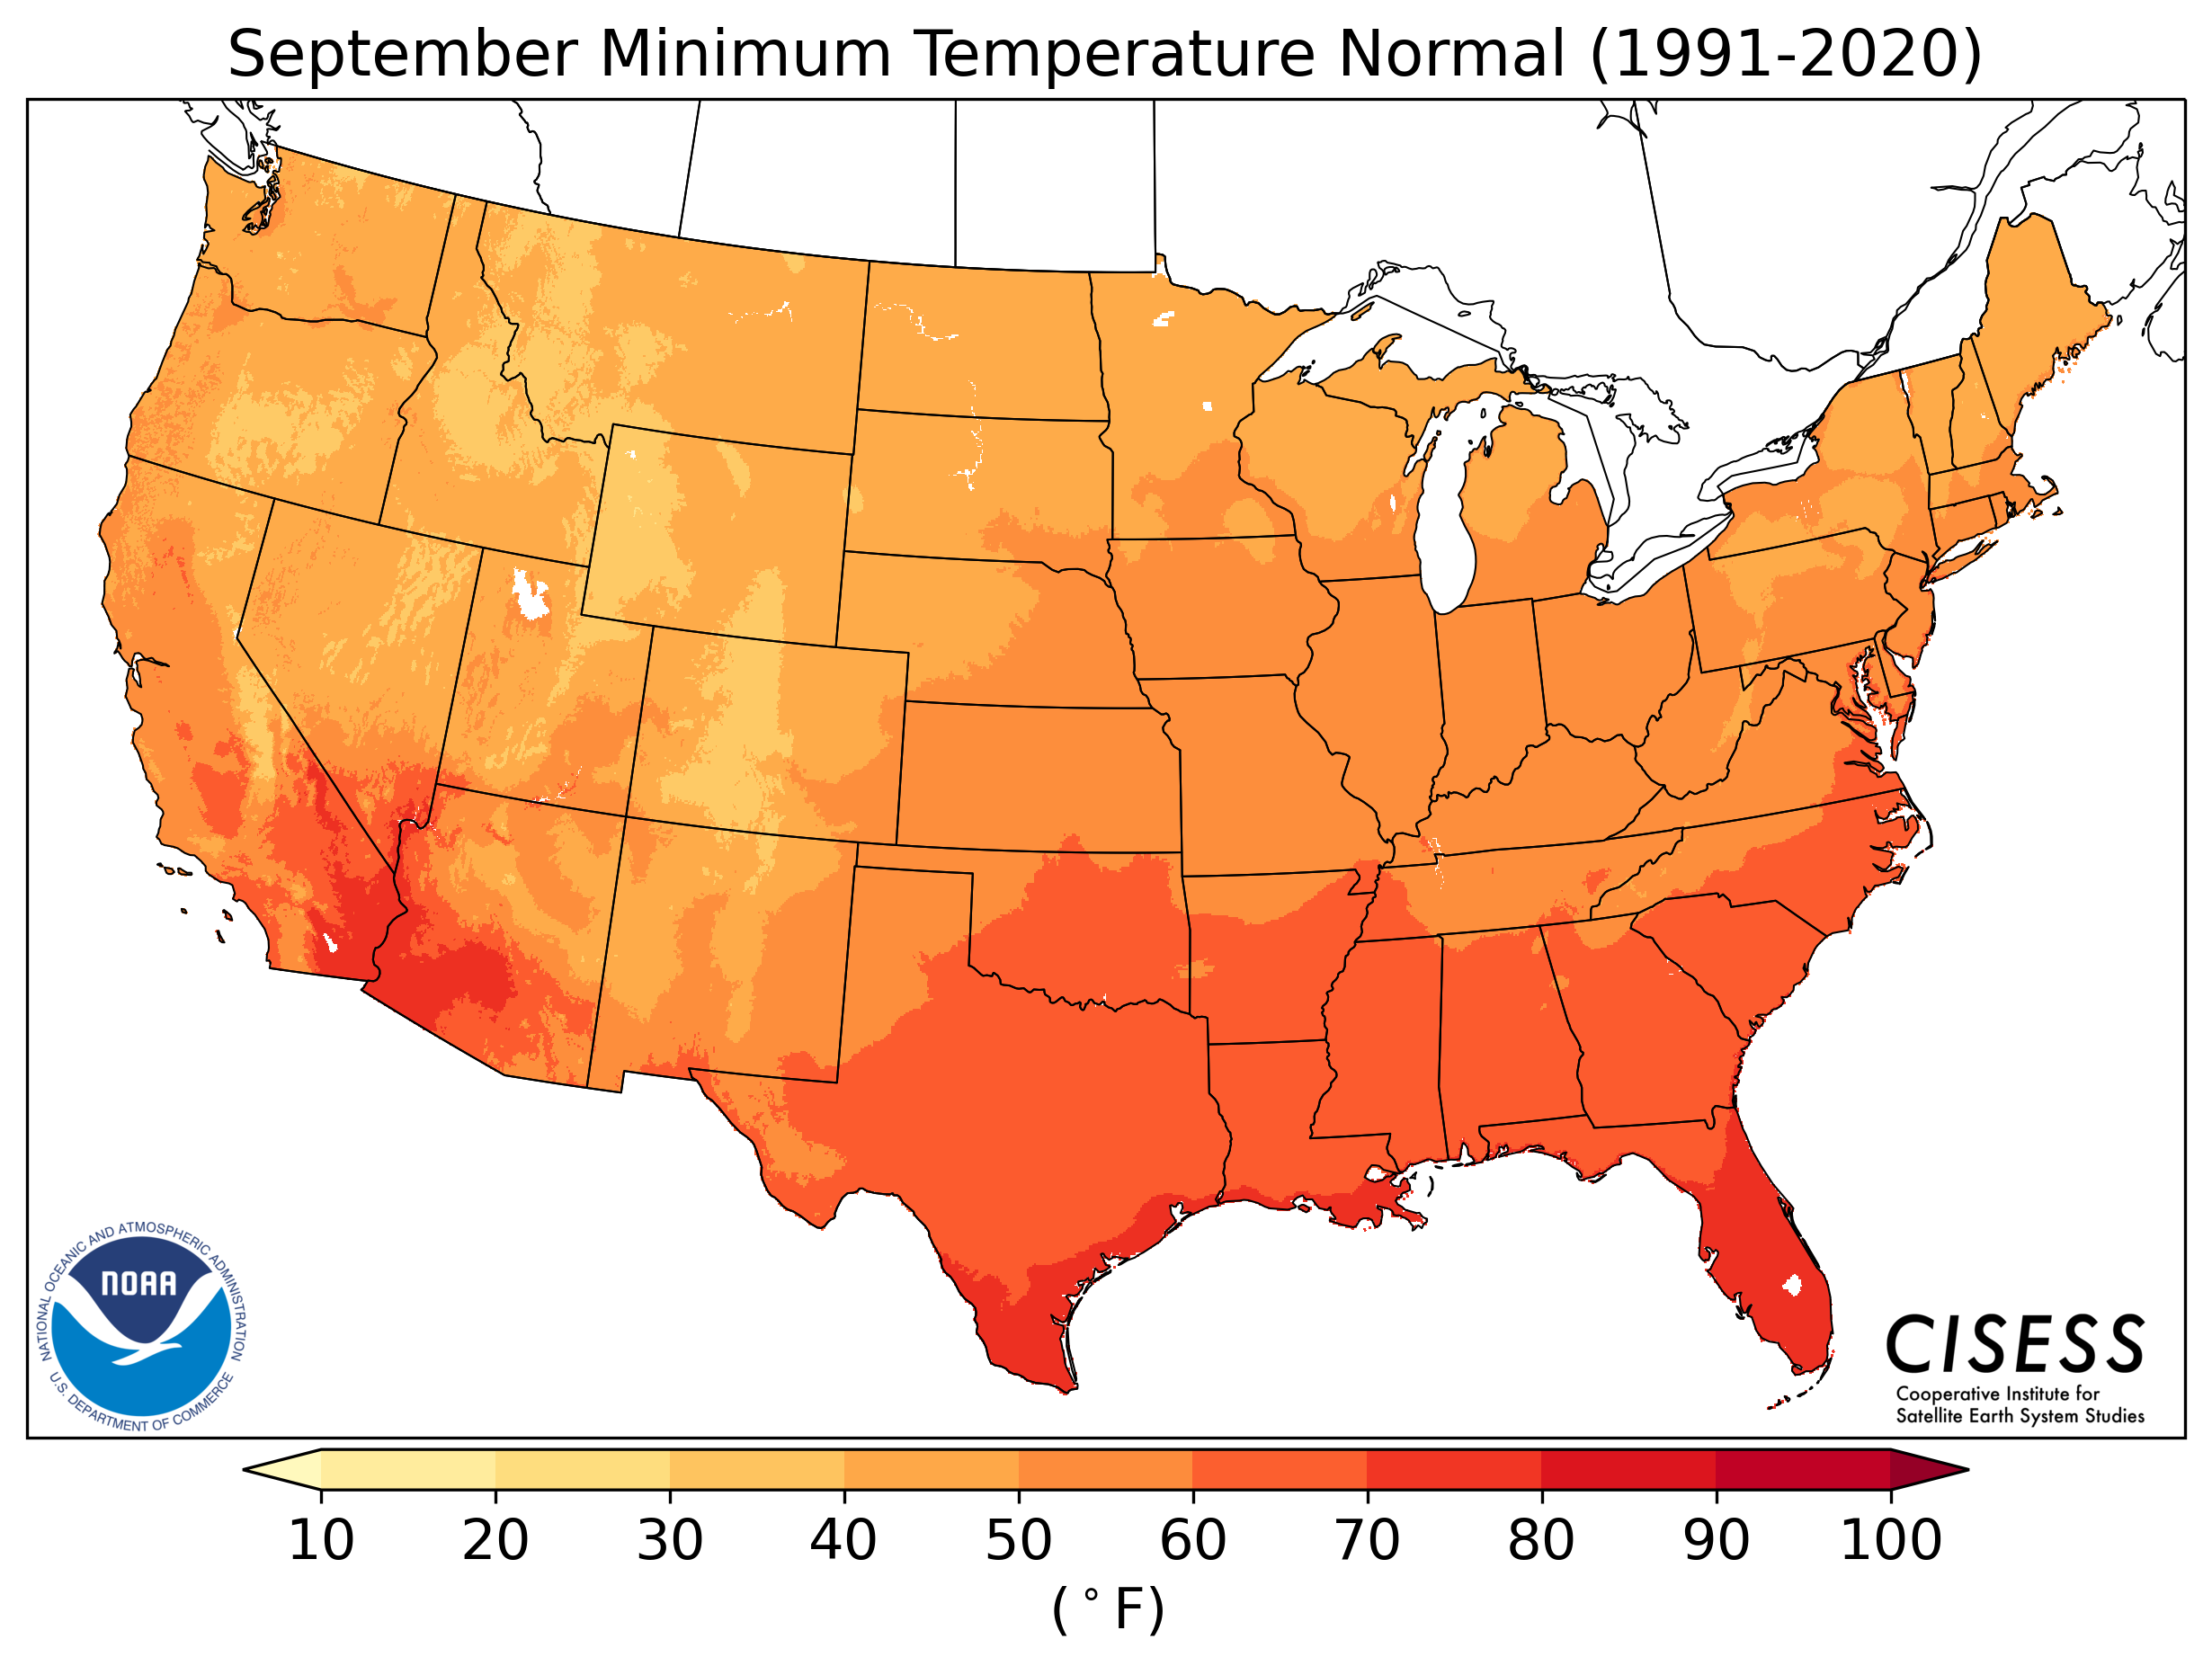
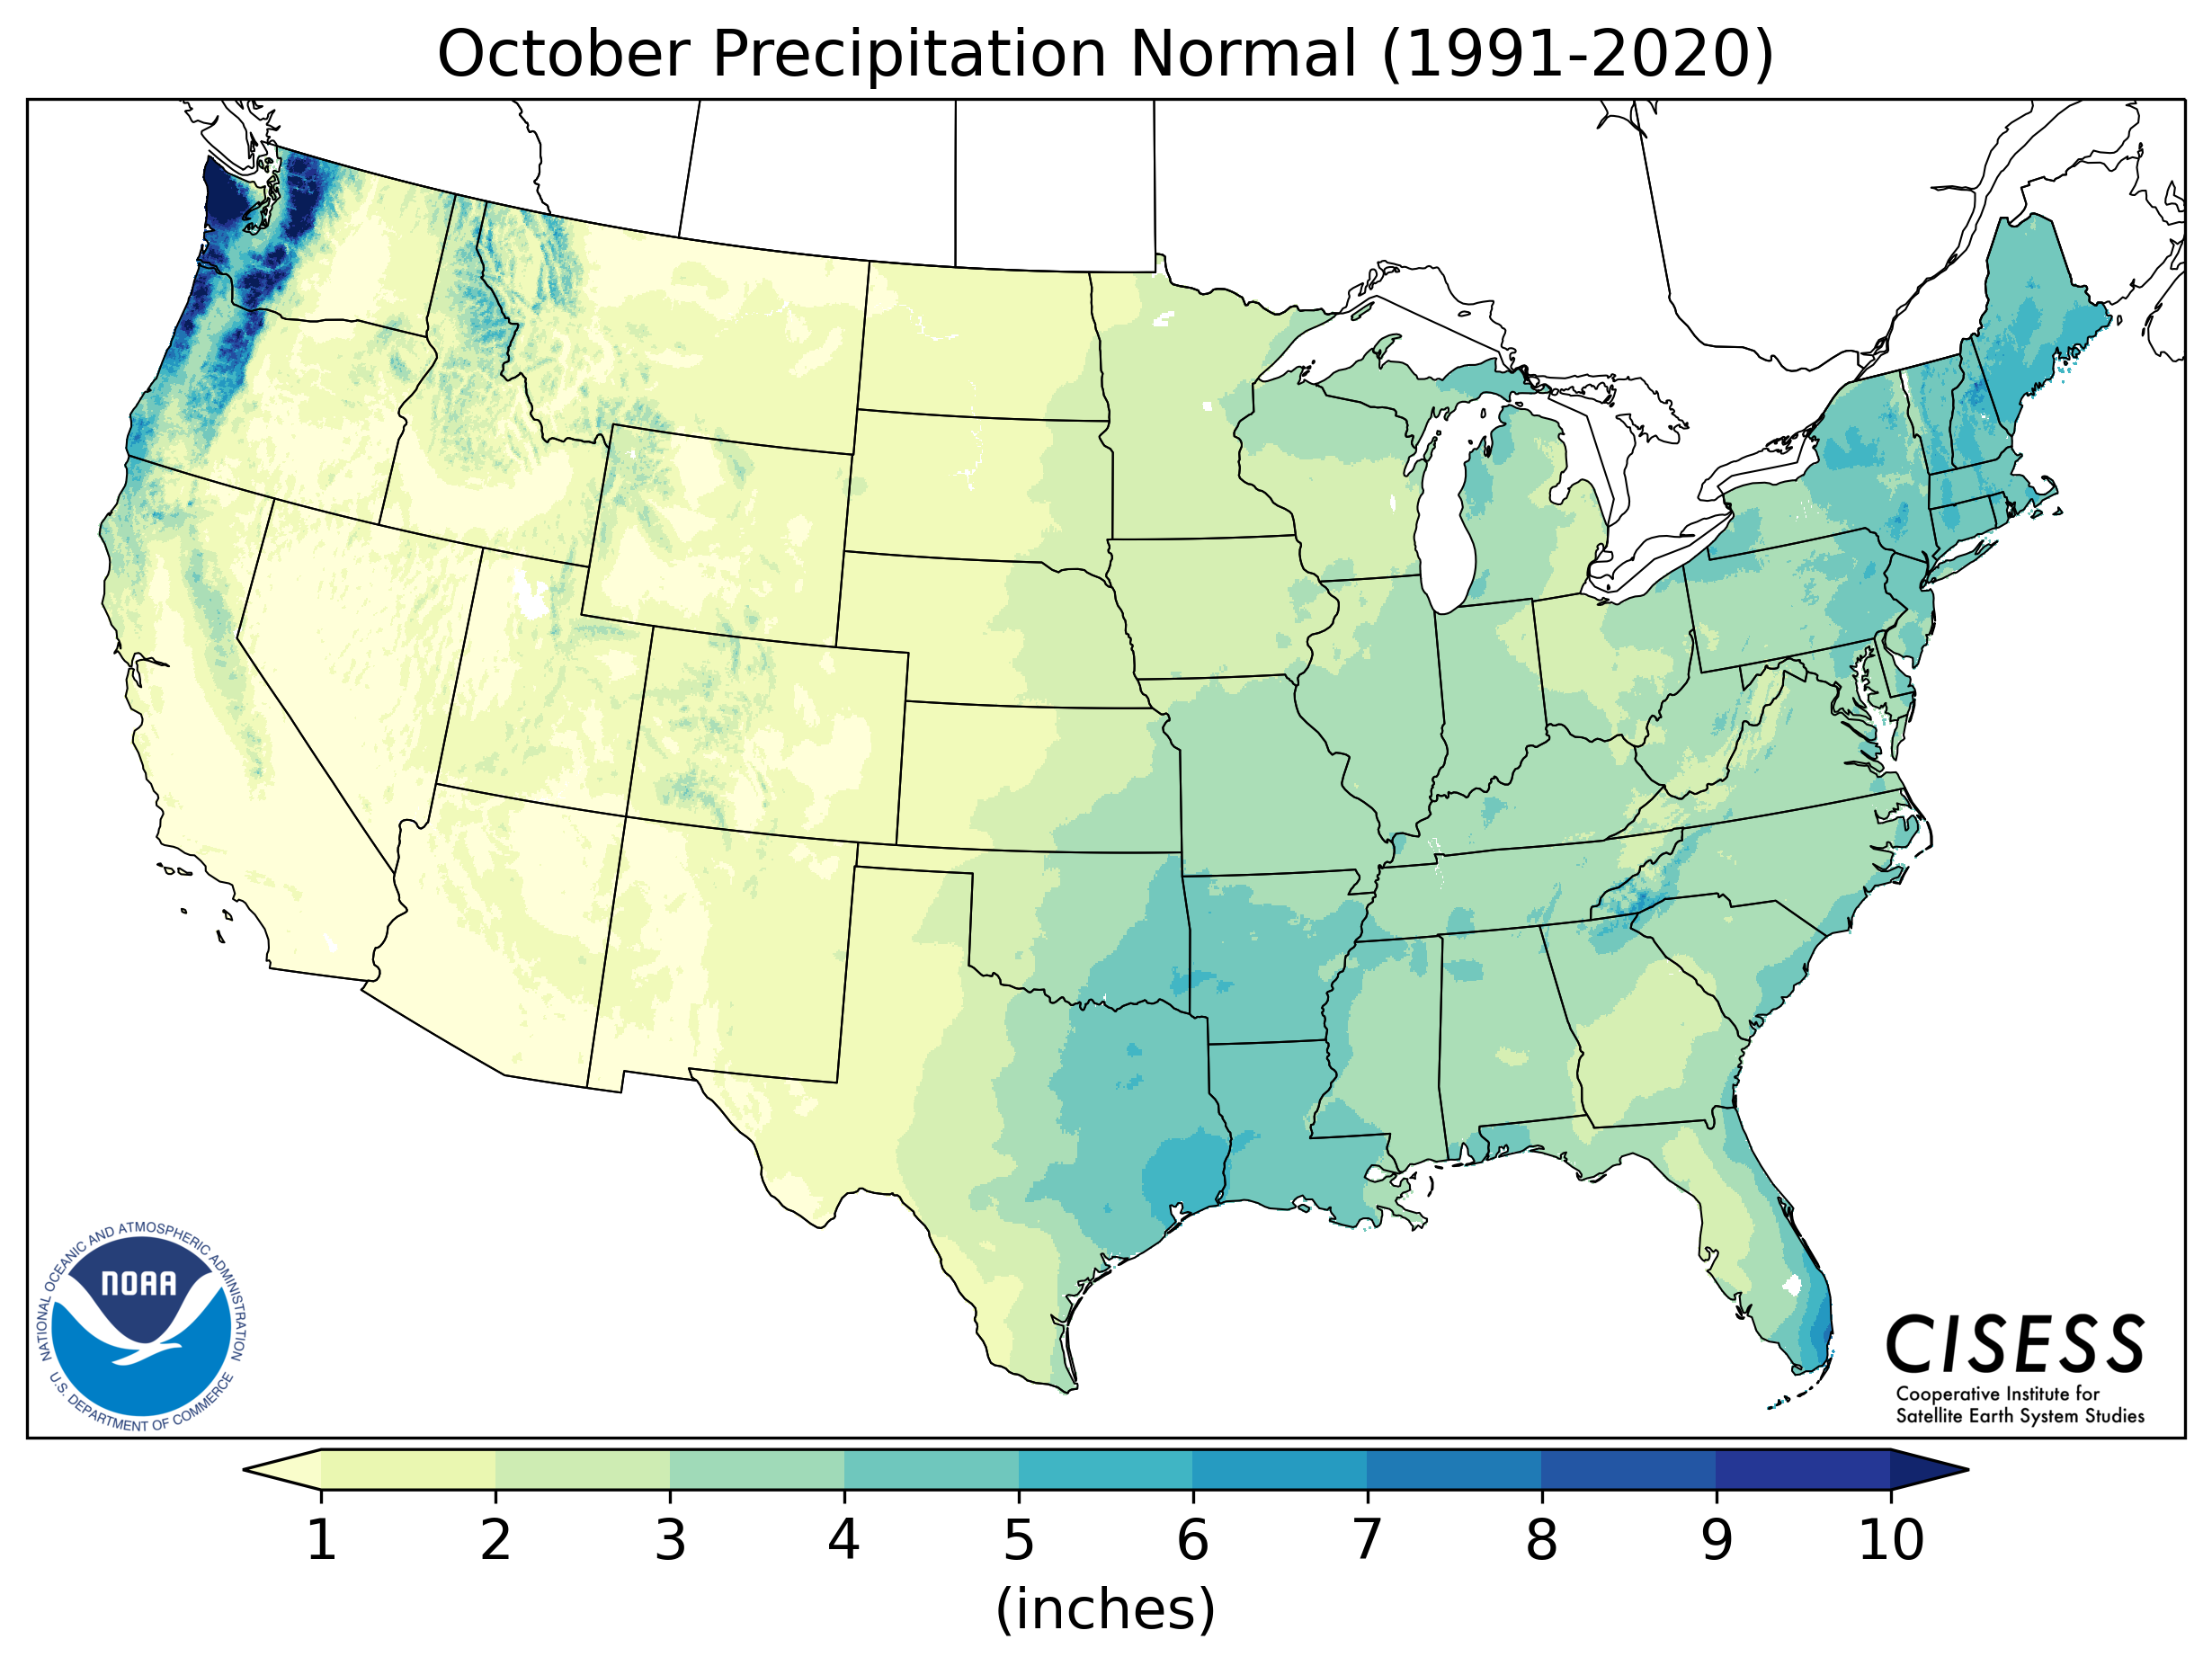
Normals serve two purposes: a reference period for monitoring current weather and climate, and a good description of the expected climate at a location over the seasons. They provide a basis for determining whether today’s weather is warmer or colder, wetter or drier. They also can be used to plan for conditions beyond the time span of reliable weather forecasts.
A 30-year time period was chosen by the governing body of international meteorology in the 1930s, so the first normals were for 1901-1930, the longest period for which most countries had reliable climate records. International normals were called for in 1931-1960 and 1961-1990, but many countries updated normals more frequently, every 10 years, so as to keep them up to date. In 2015 this was made the WMO standard, so all countries will be creating normals for 1991-2020.
Are there normals for periods other than 30 years?
There will be one set of alternative normals provided by NOAA NCEI for the 15-year period from 2006-2020. However, instead of being available for temperature only, this will be a full set of normals for all variables for those users needing a representation of climate based on more recent conditions. We are also working with one of our partners, the High Plains Regional Climate Center at the University of Nebraska, Lincoln, to replace the static Supplemental Monthly Temperature Normals product that exists now at NCEI with a dynamic tool. This application will allow users to generate a normal-style average for any recent period of time from a chosen start date to a chosen end date from the special underlying data set that is used to generate official normals, including corrections for station discontinuities and time of observation changes.
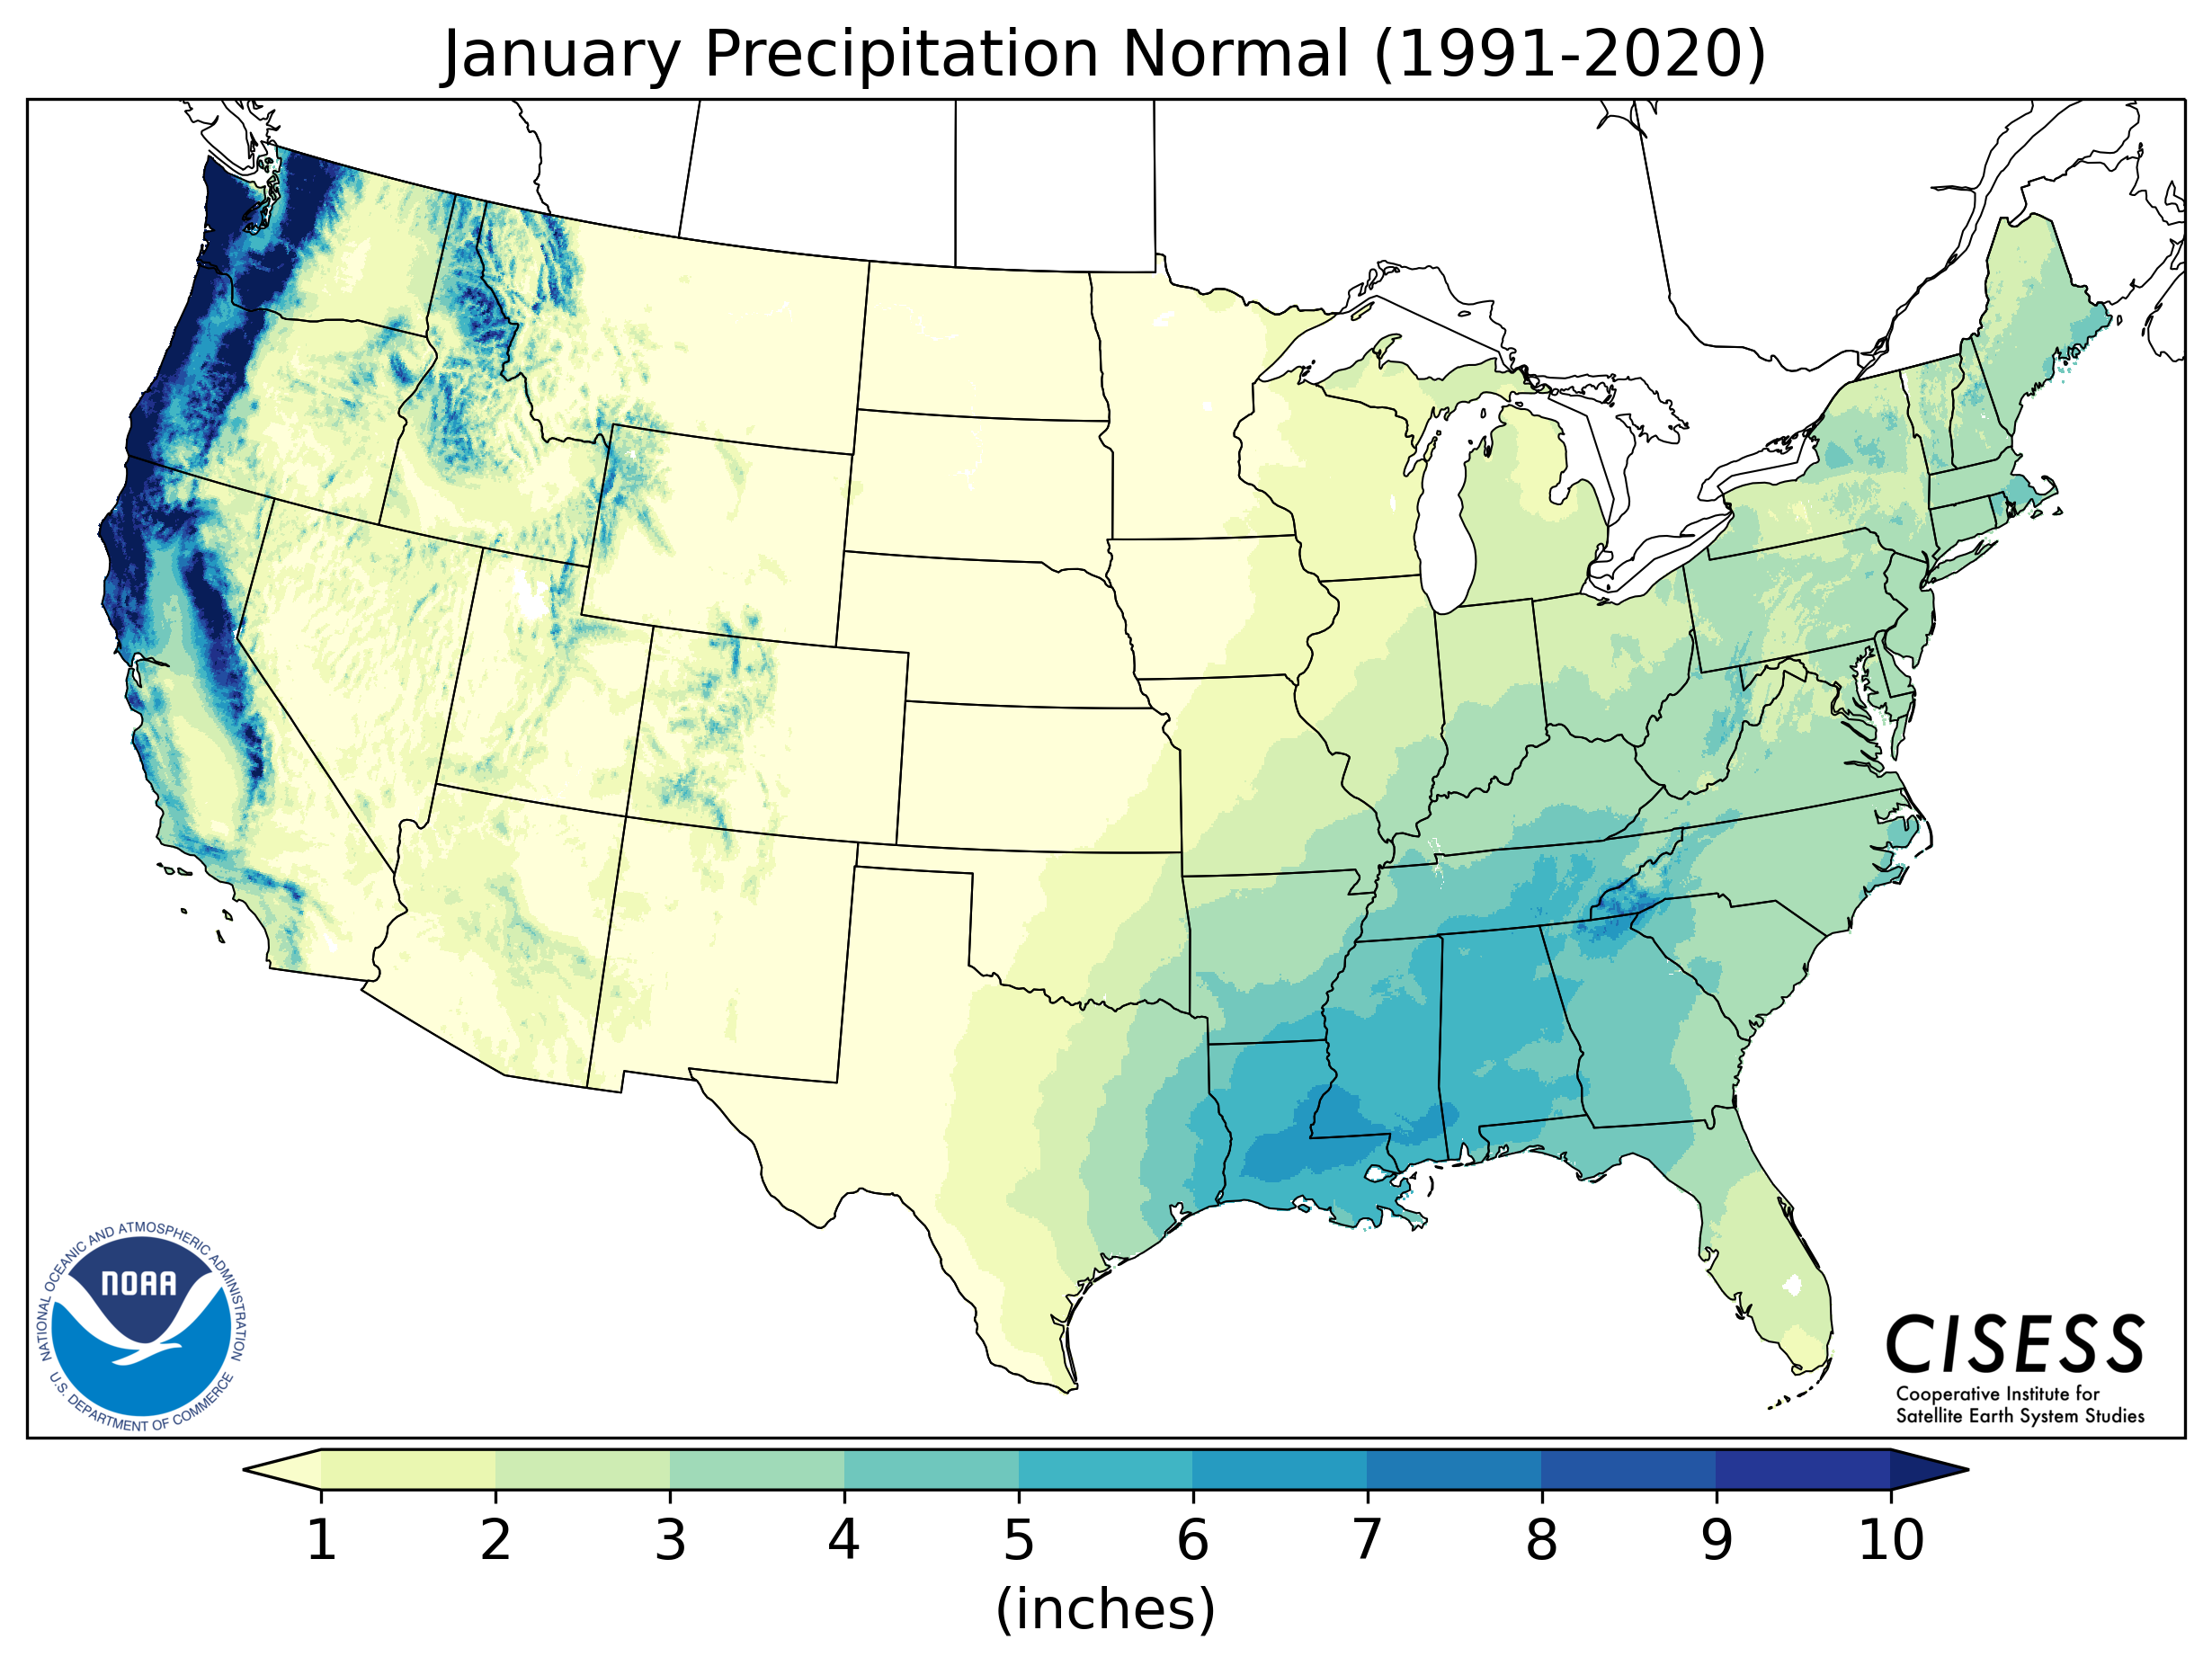
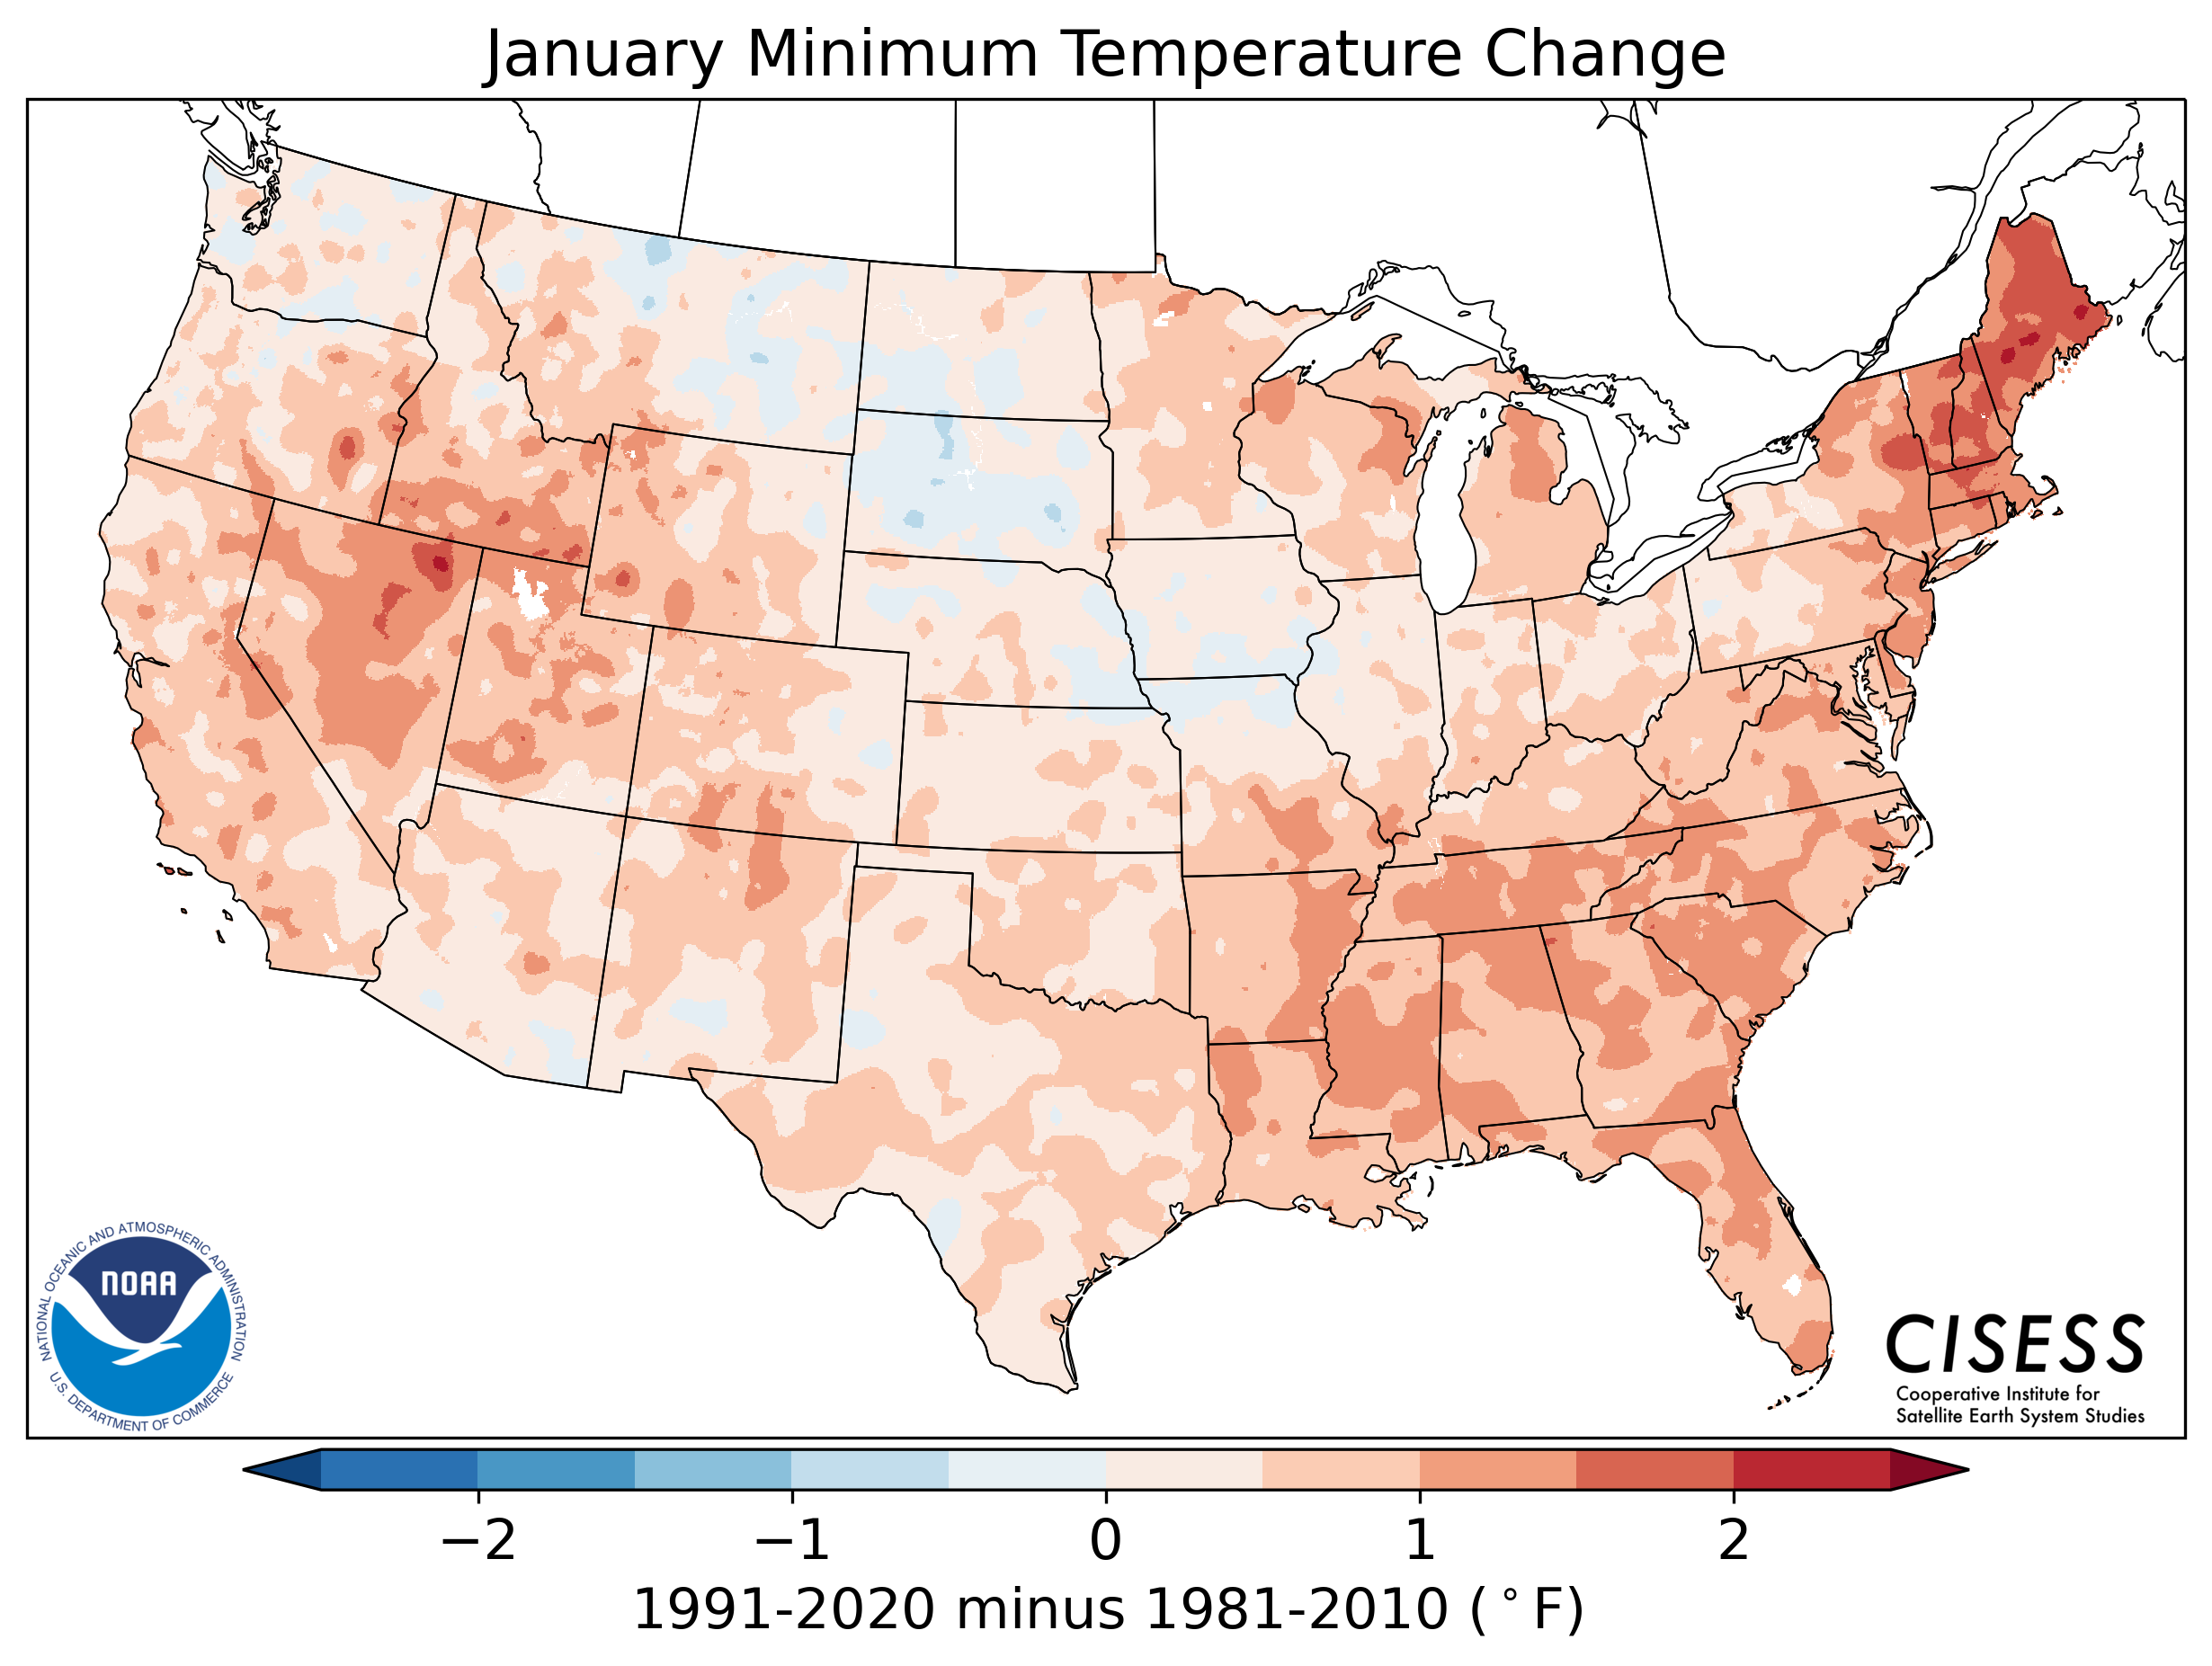
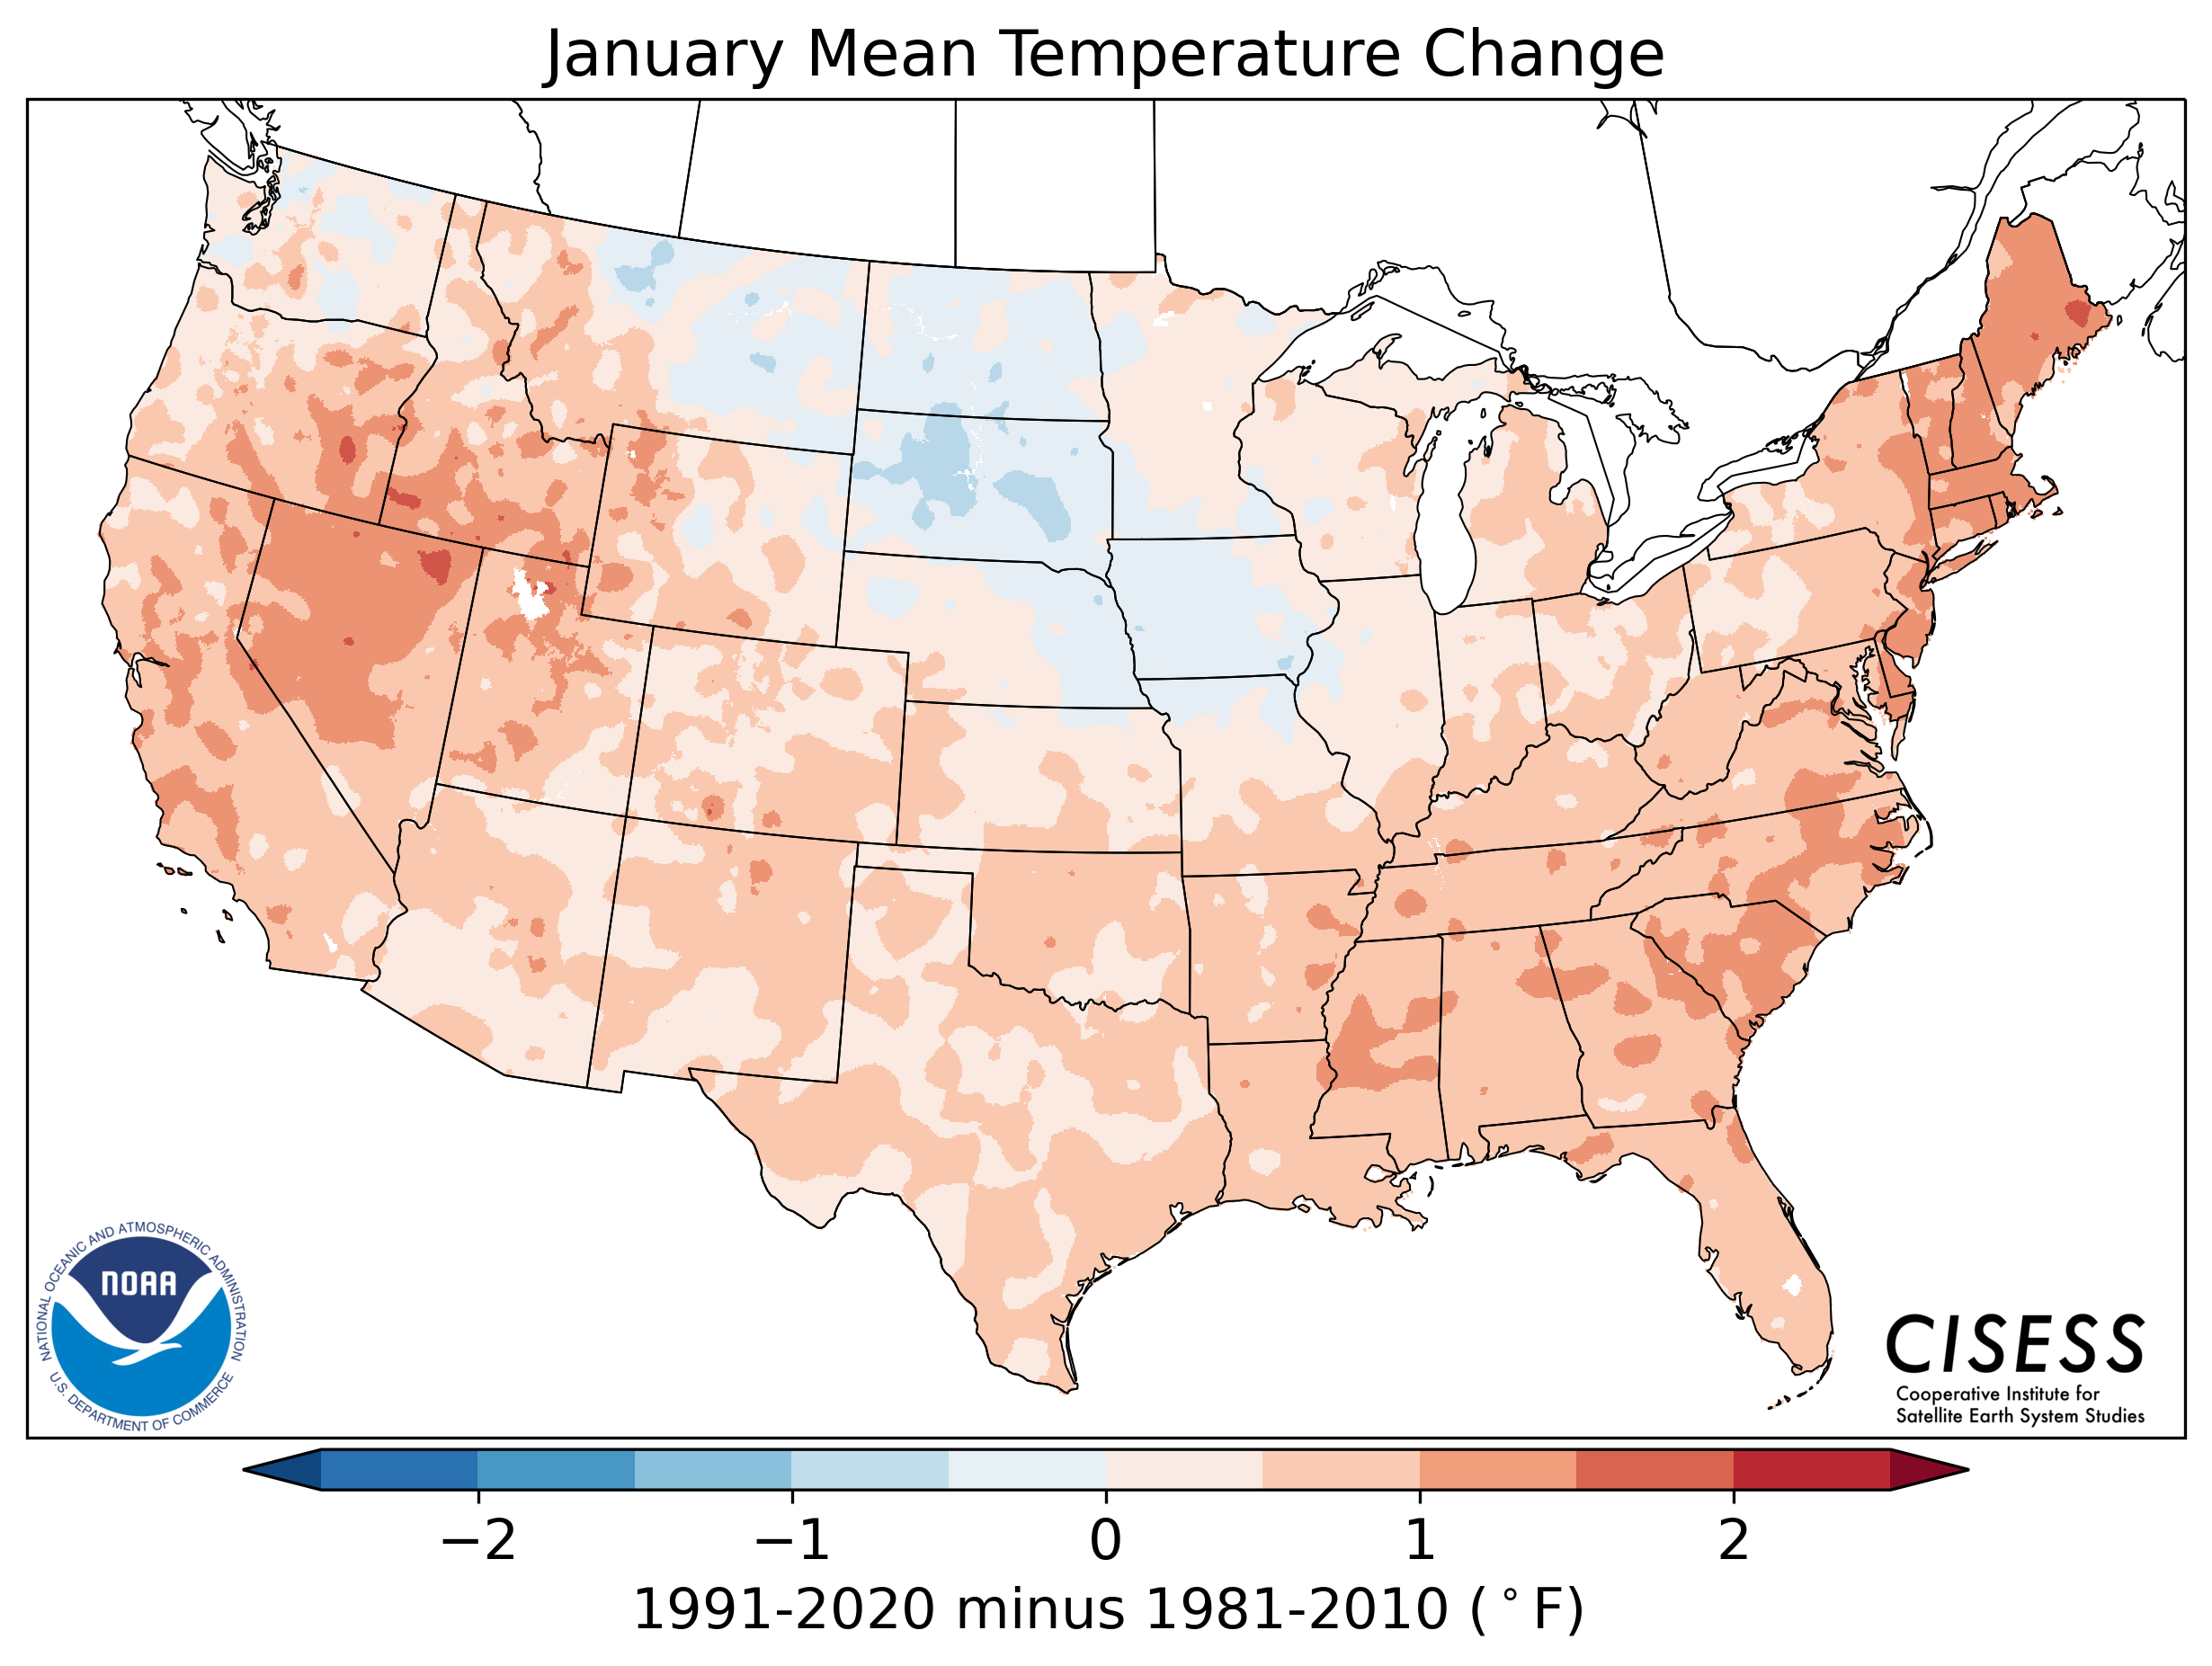
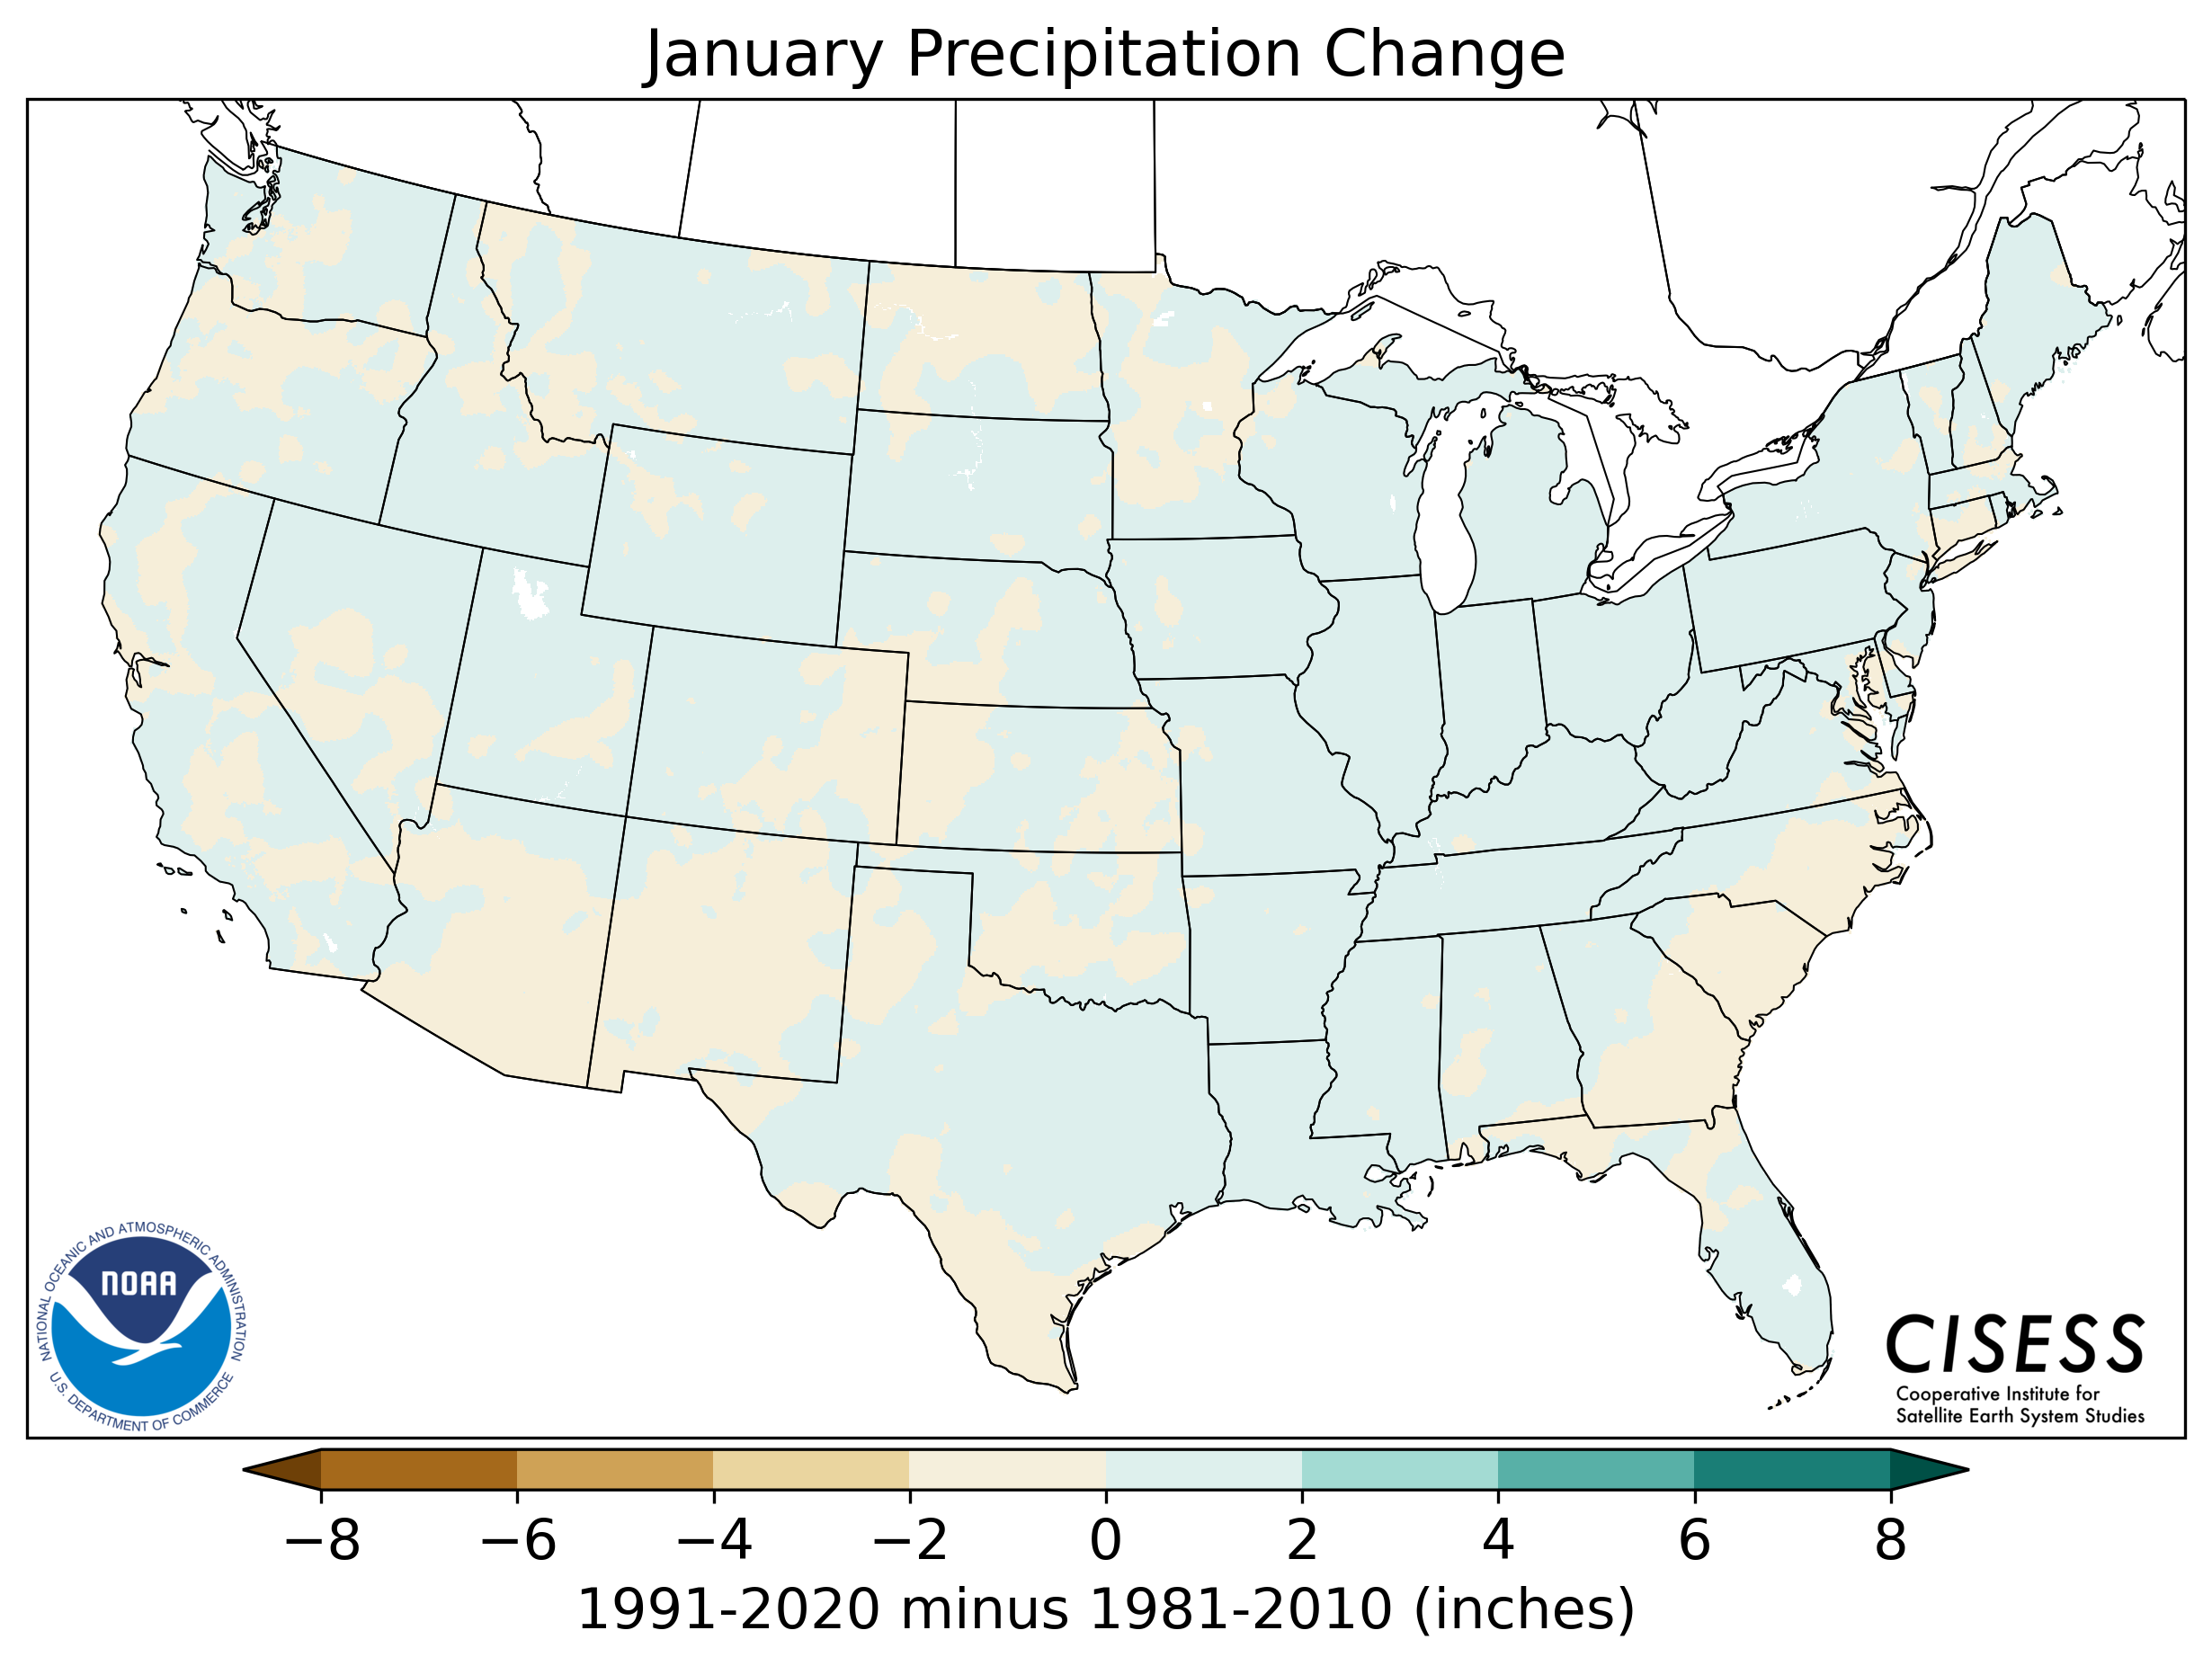
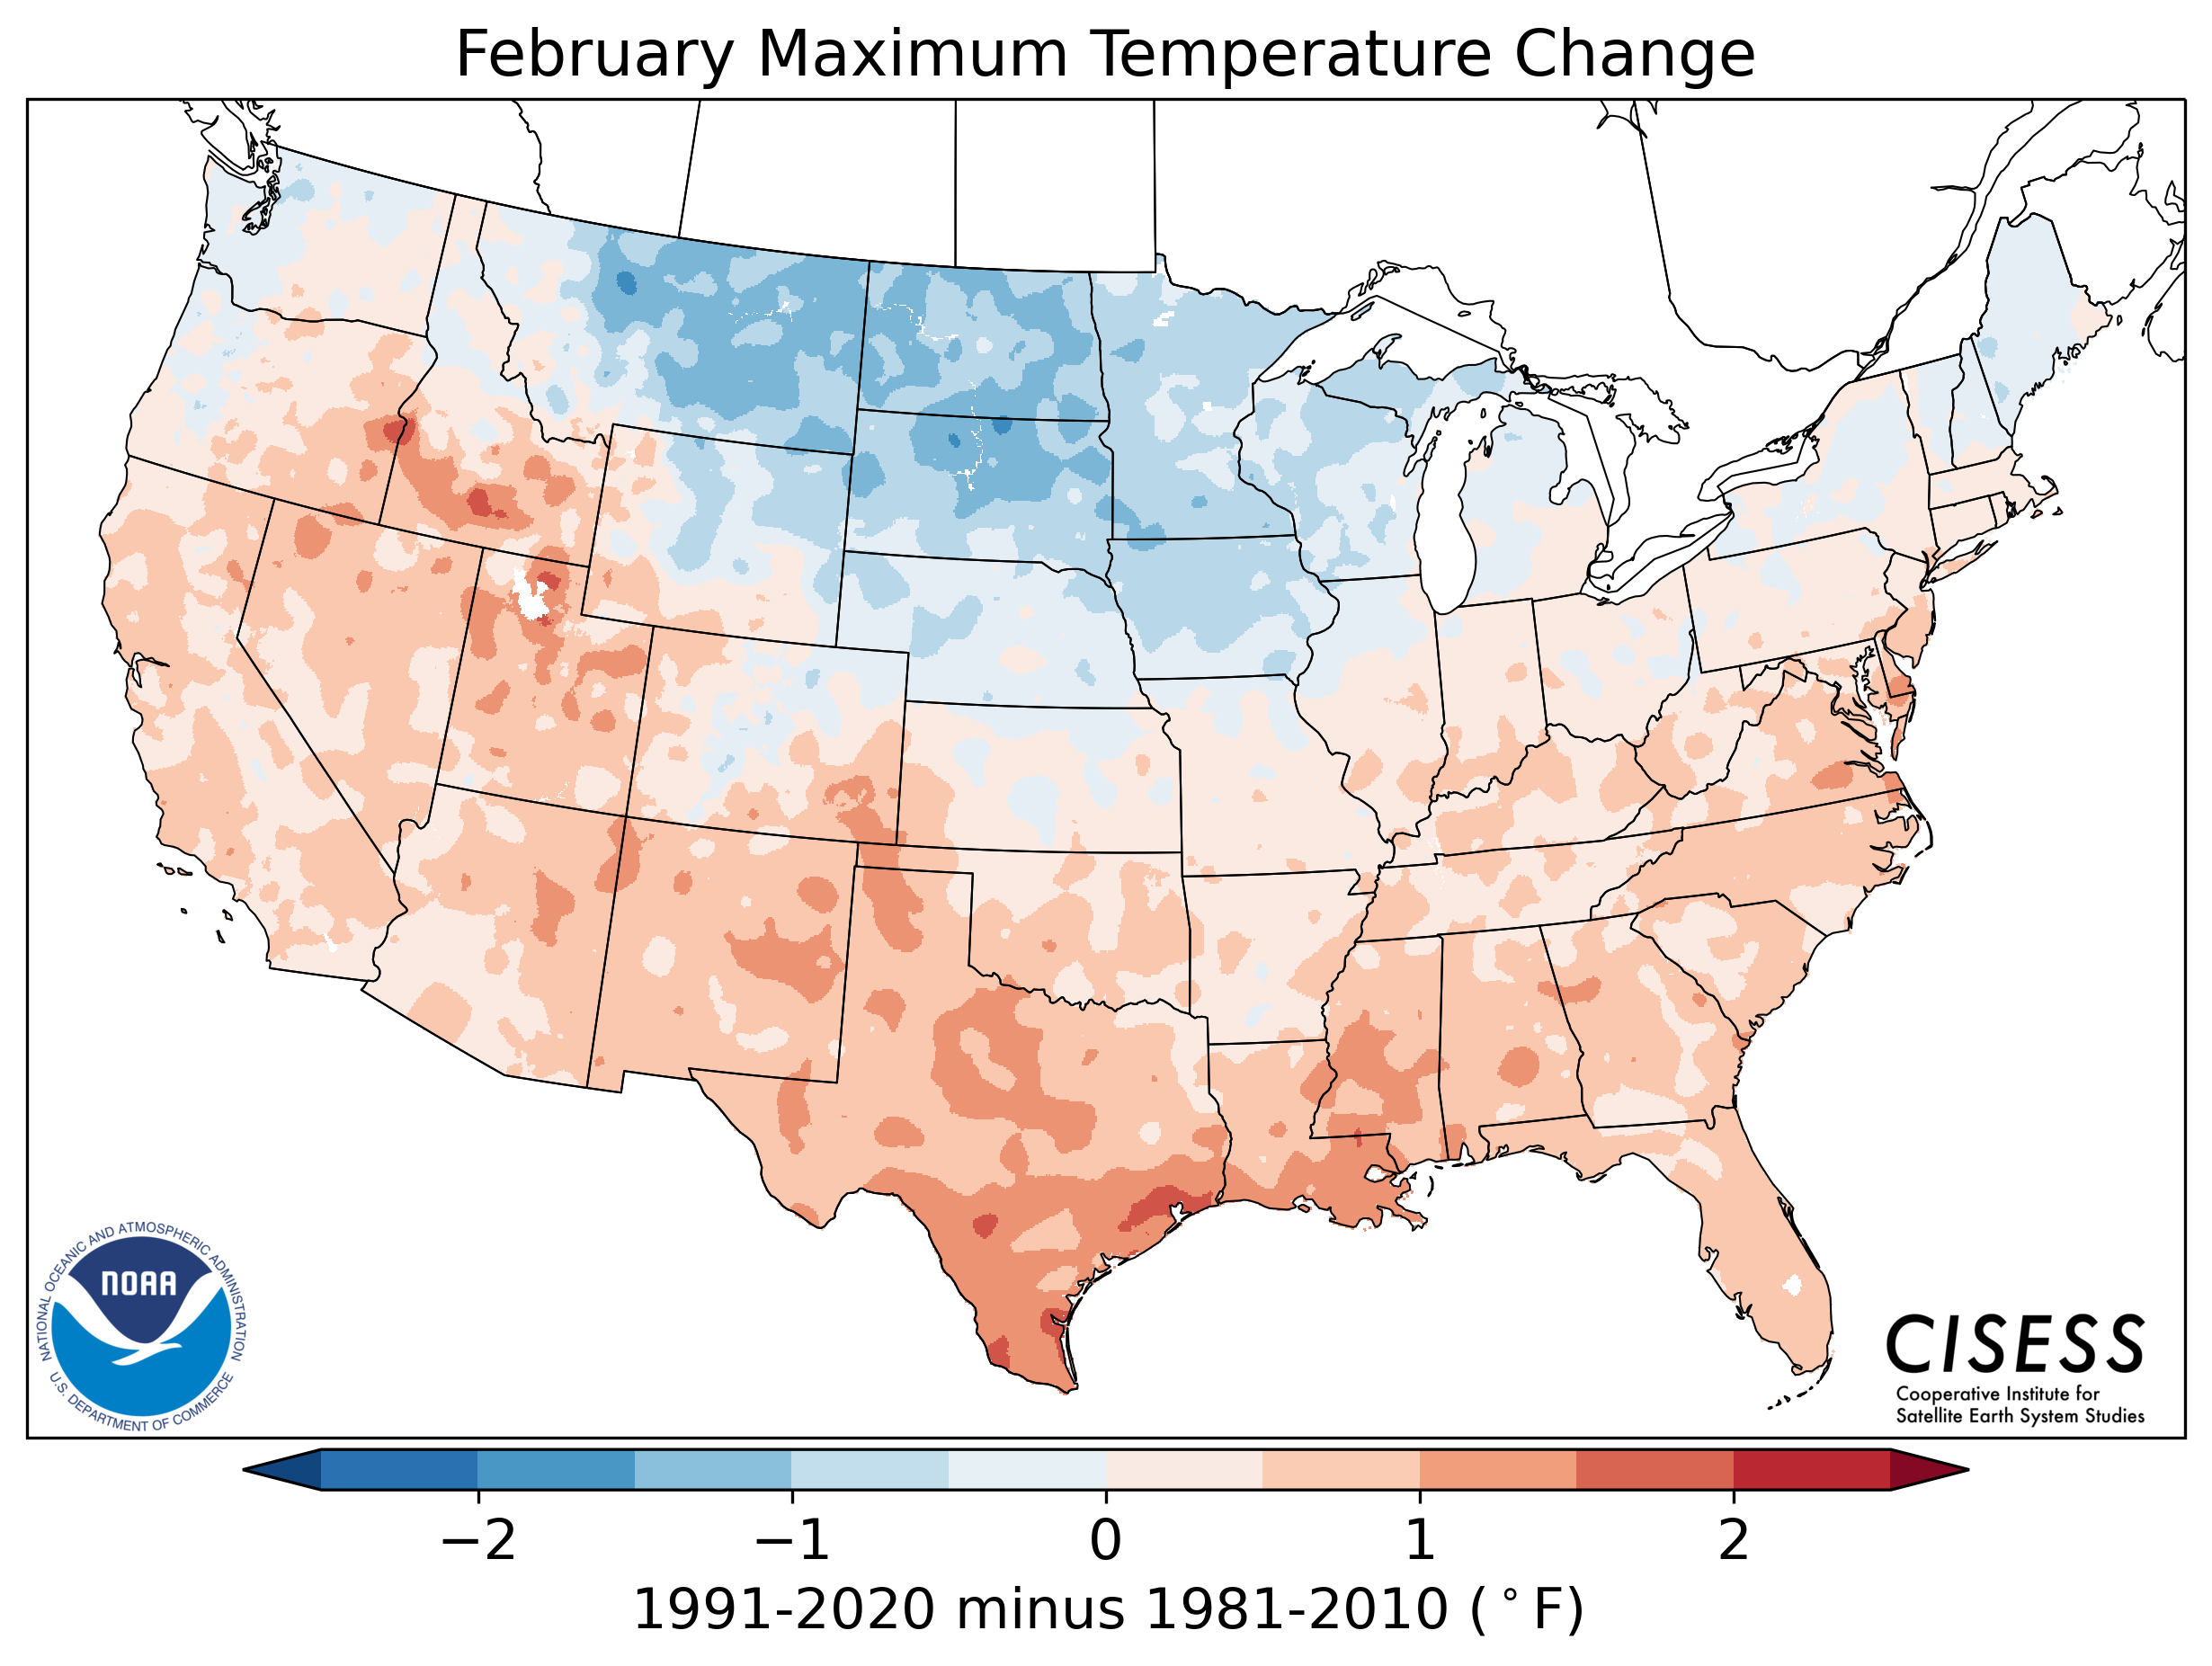
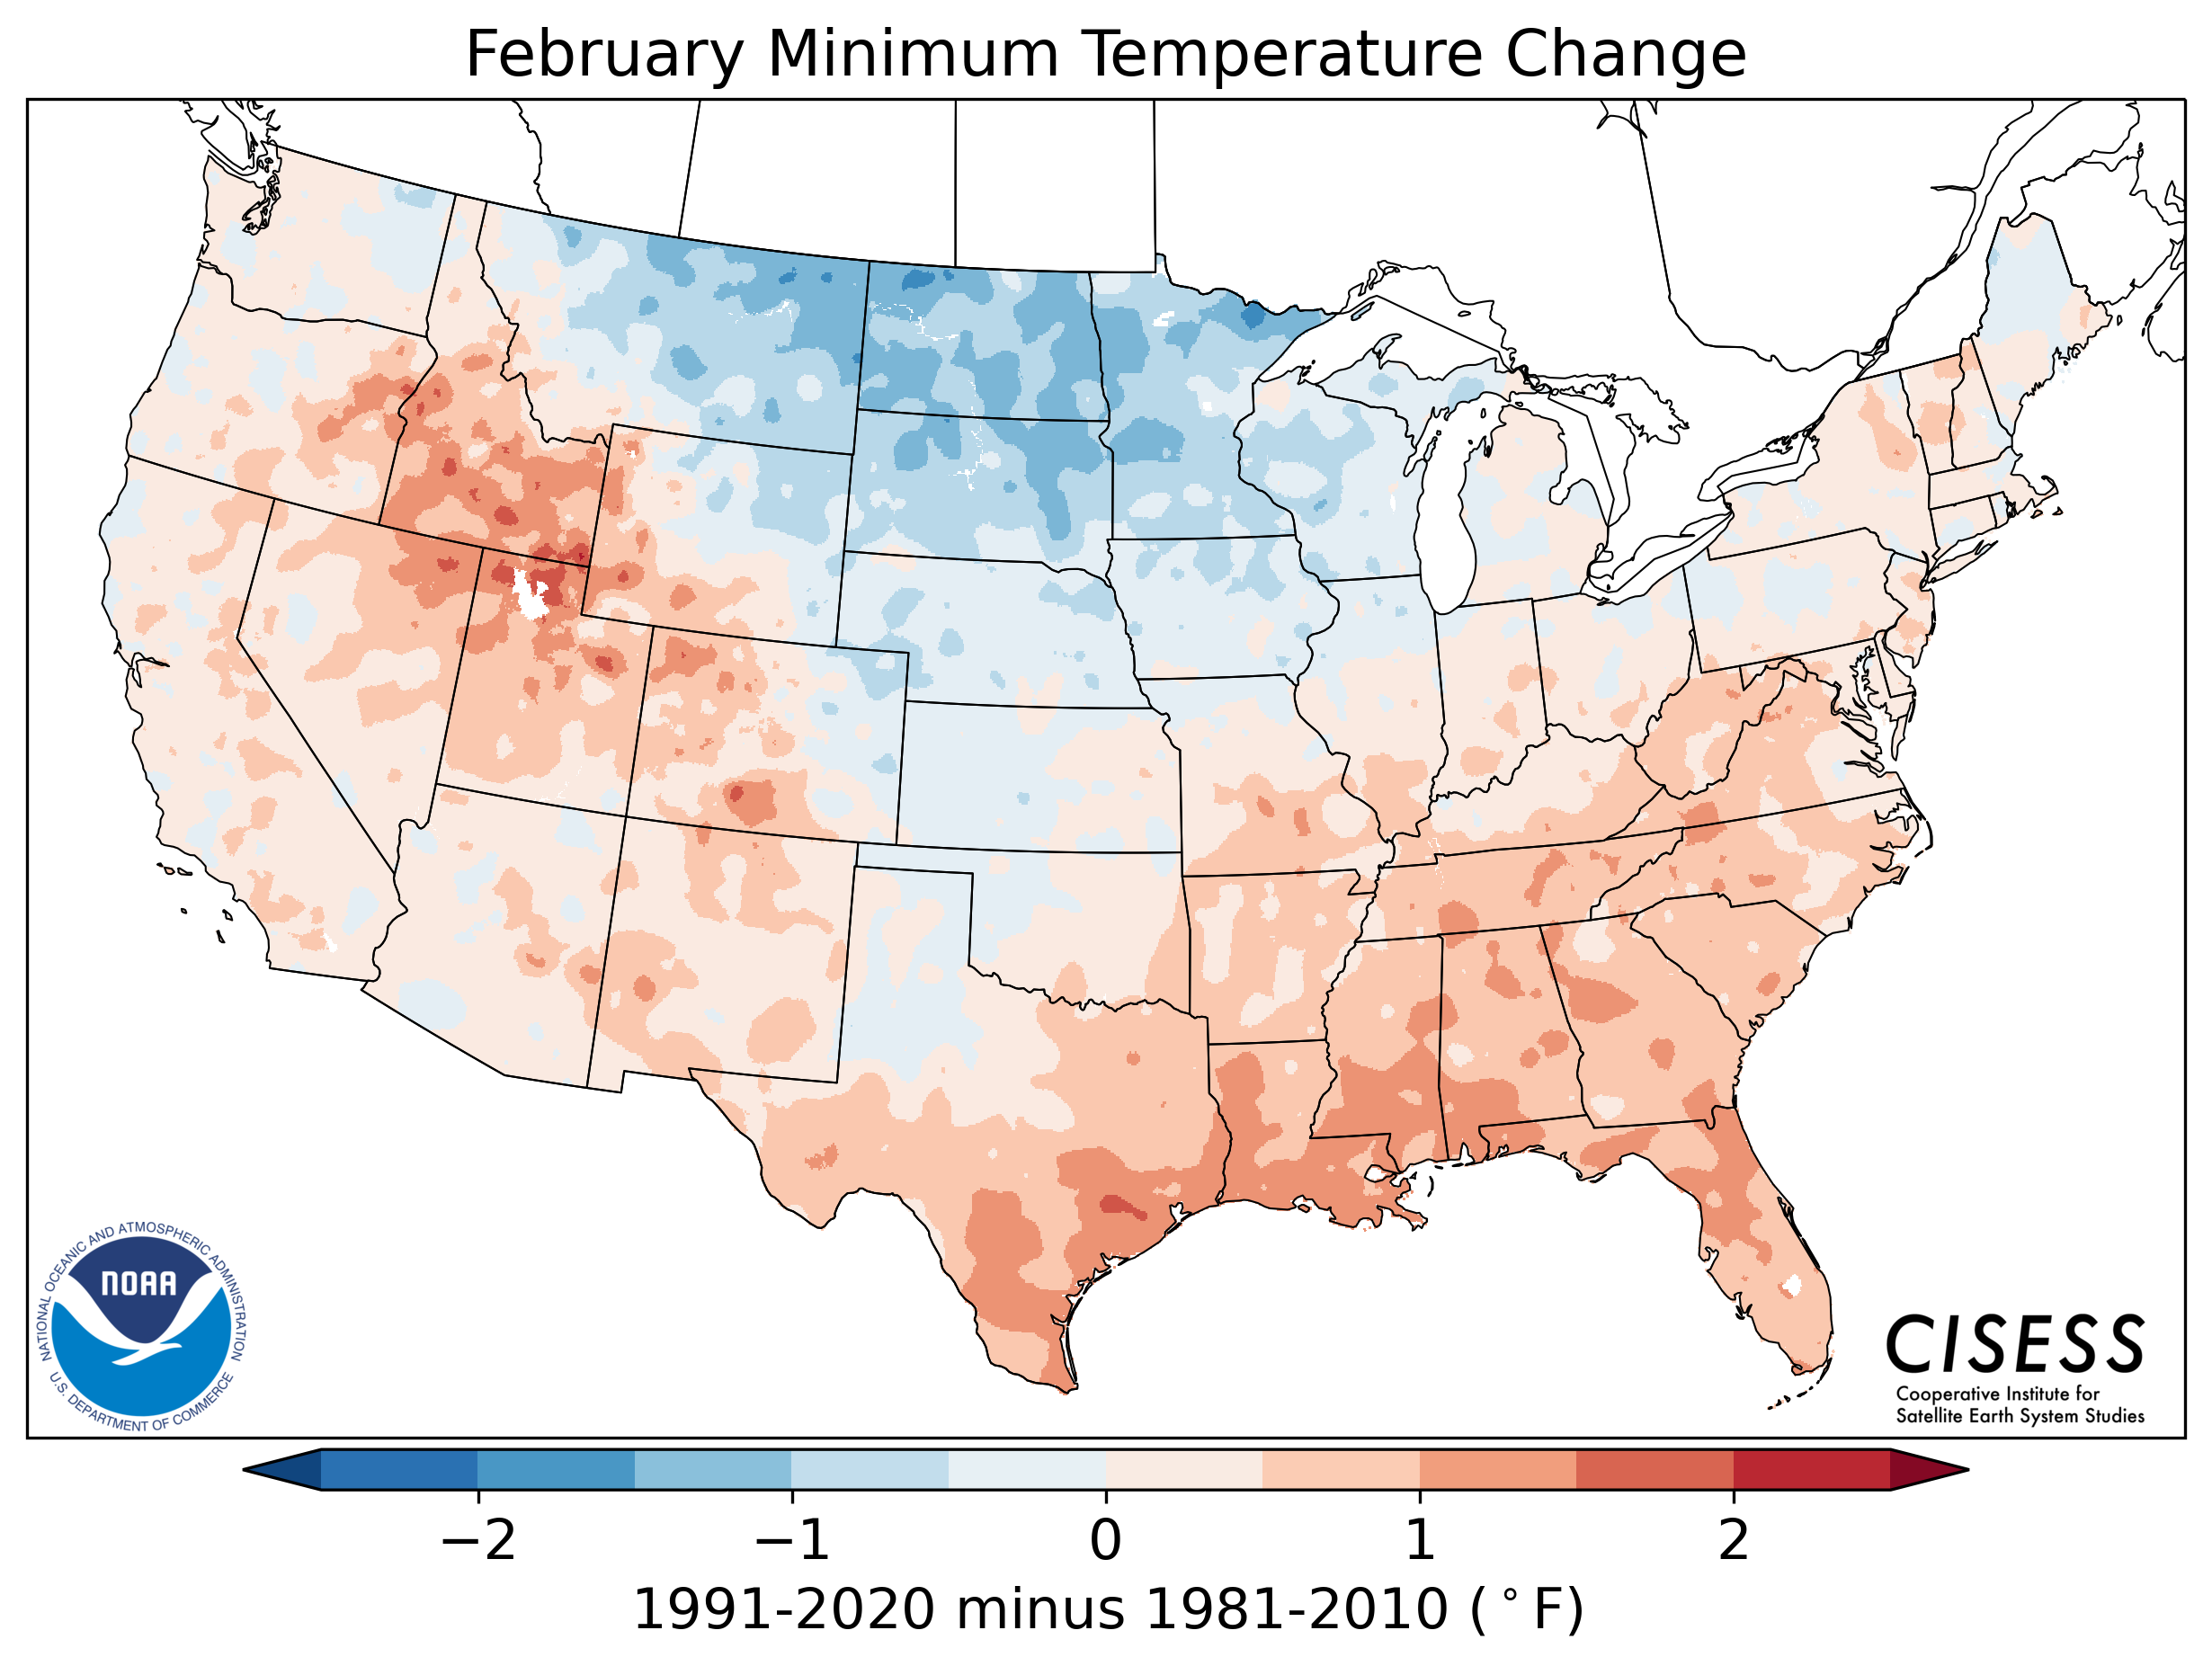
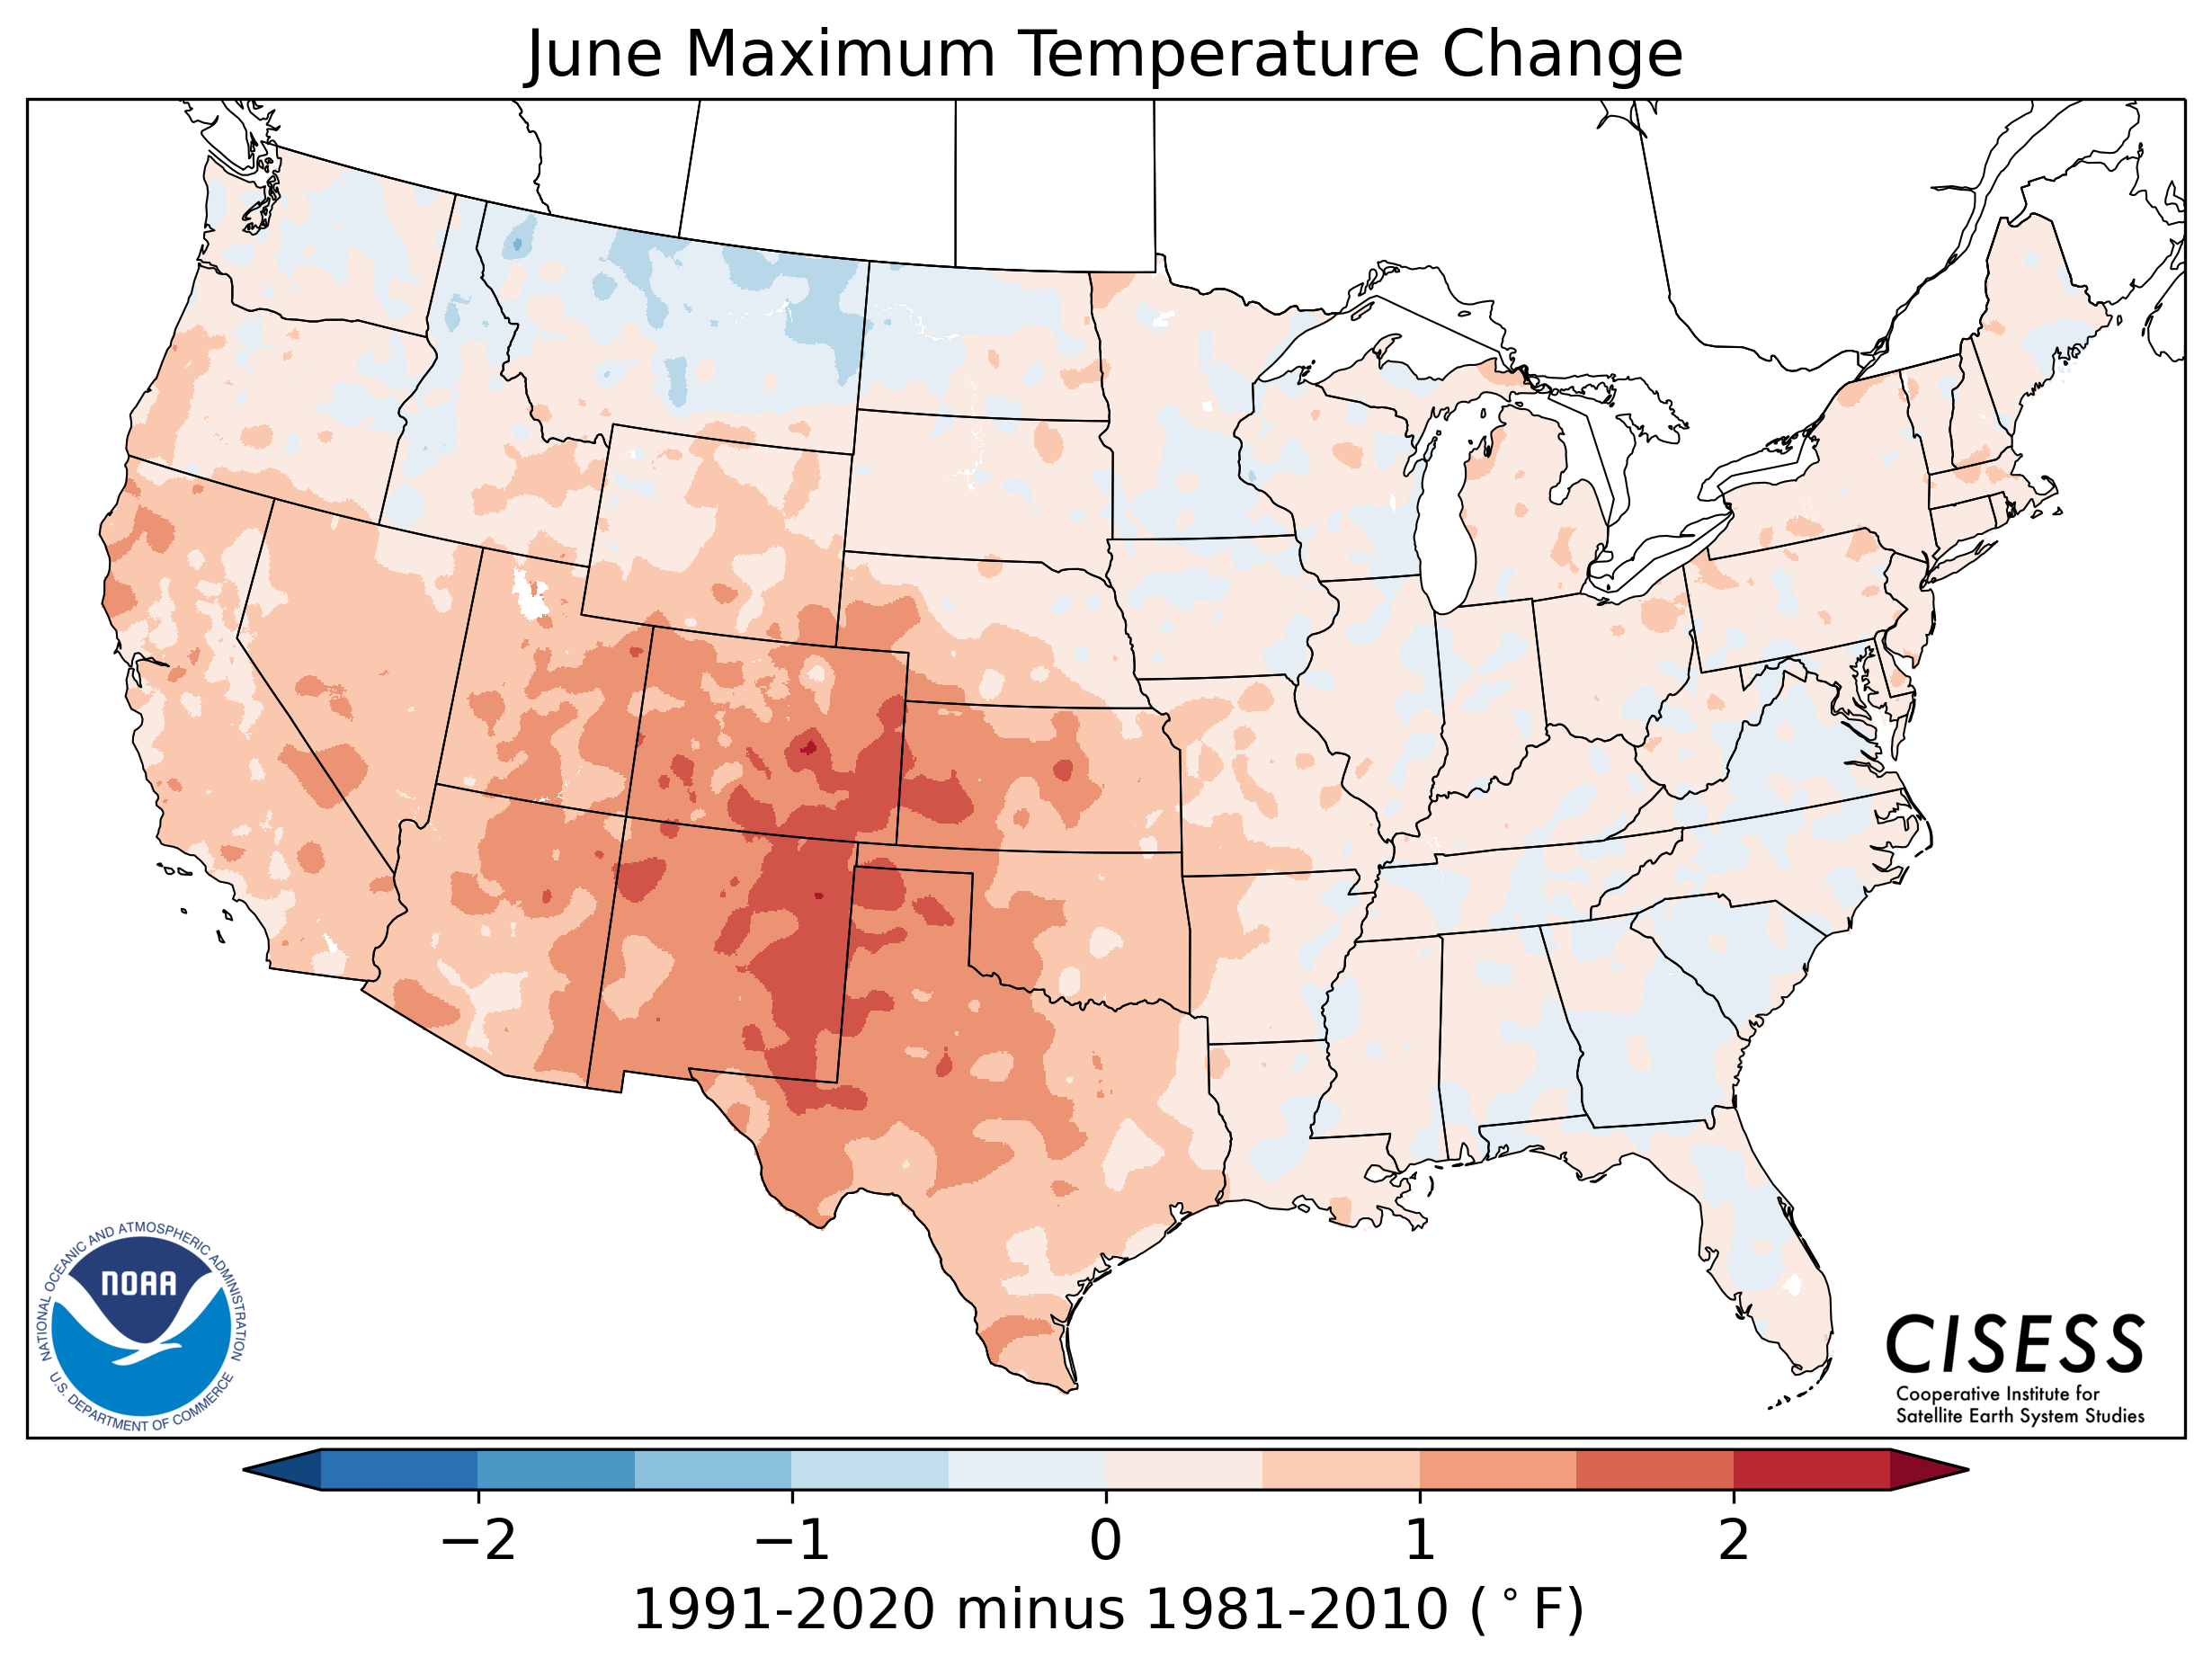
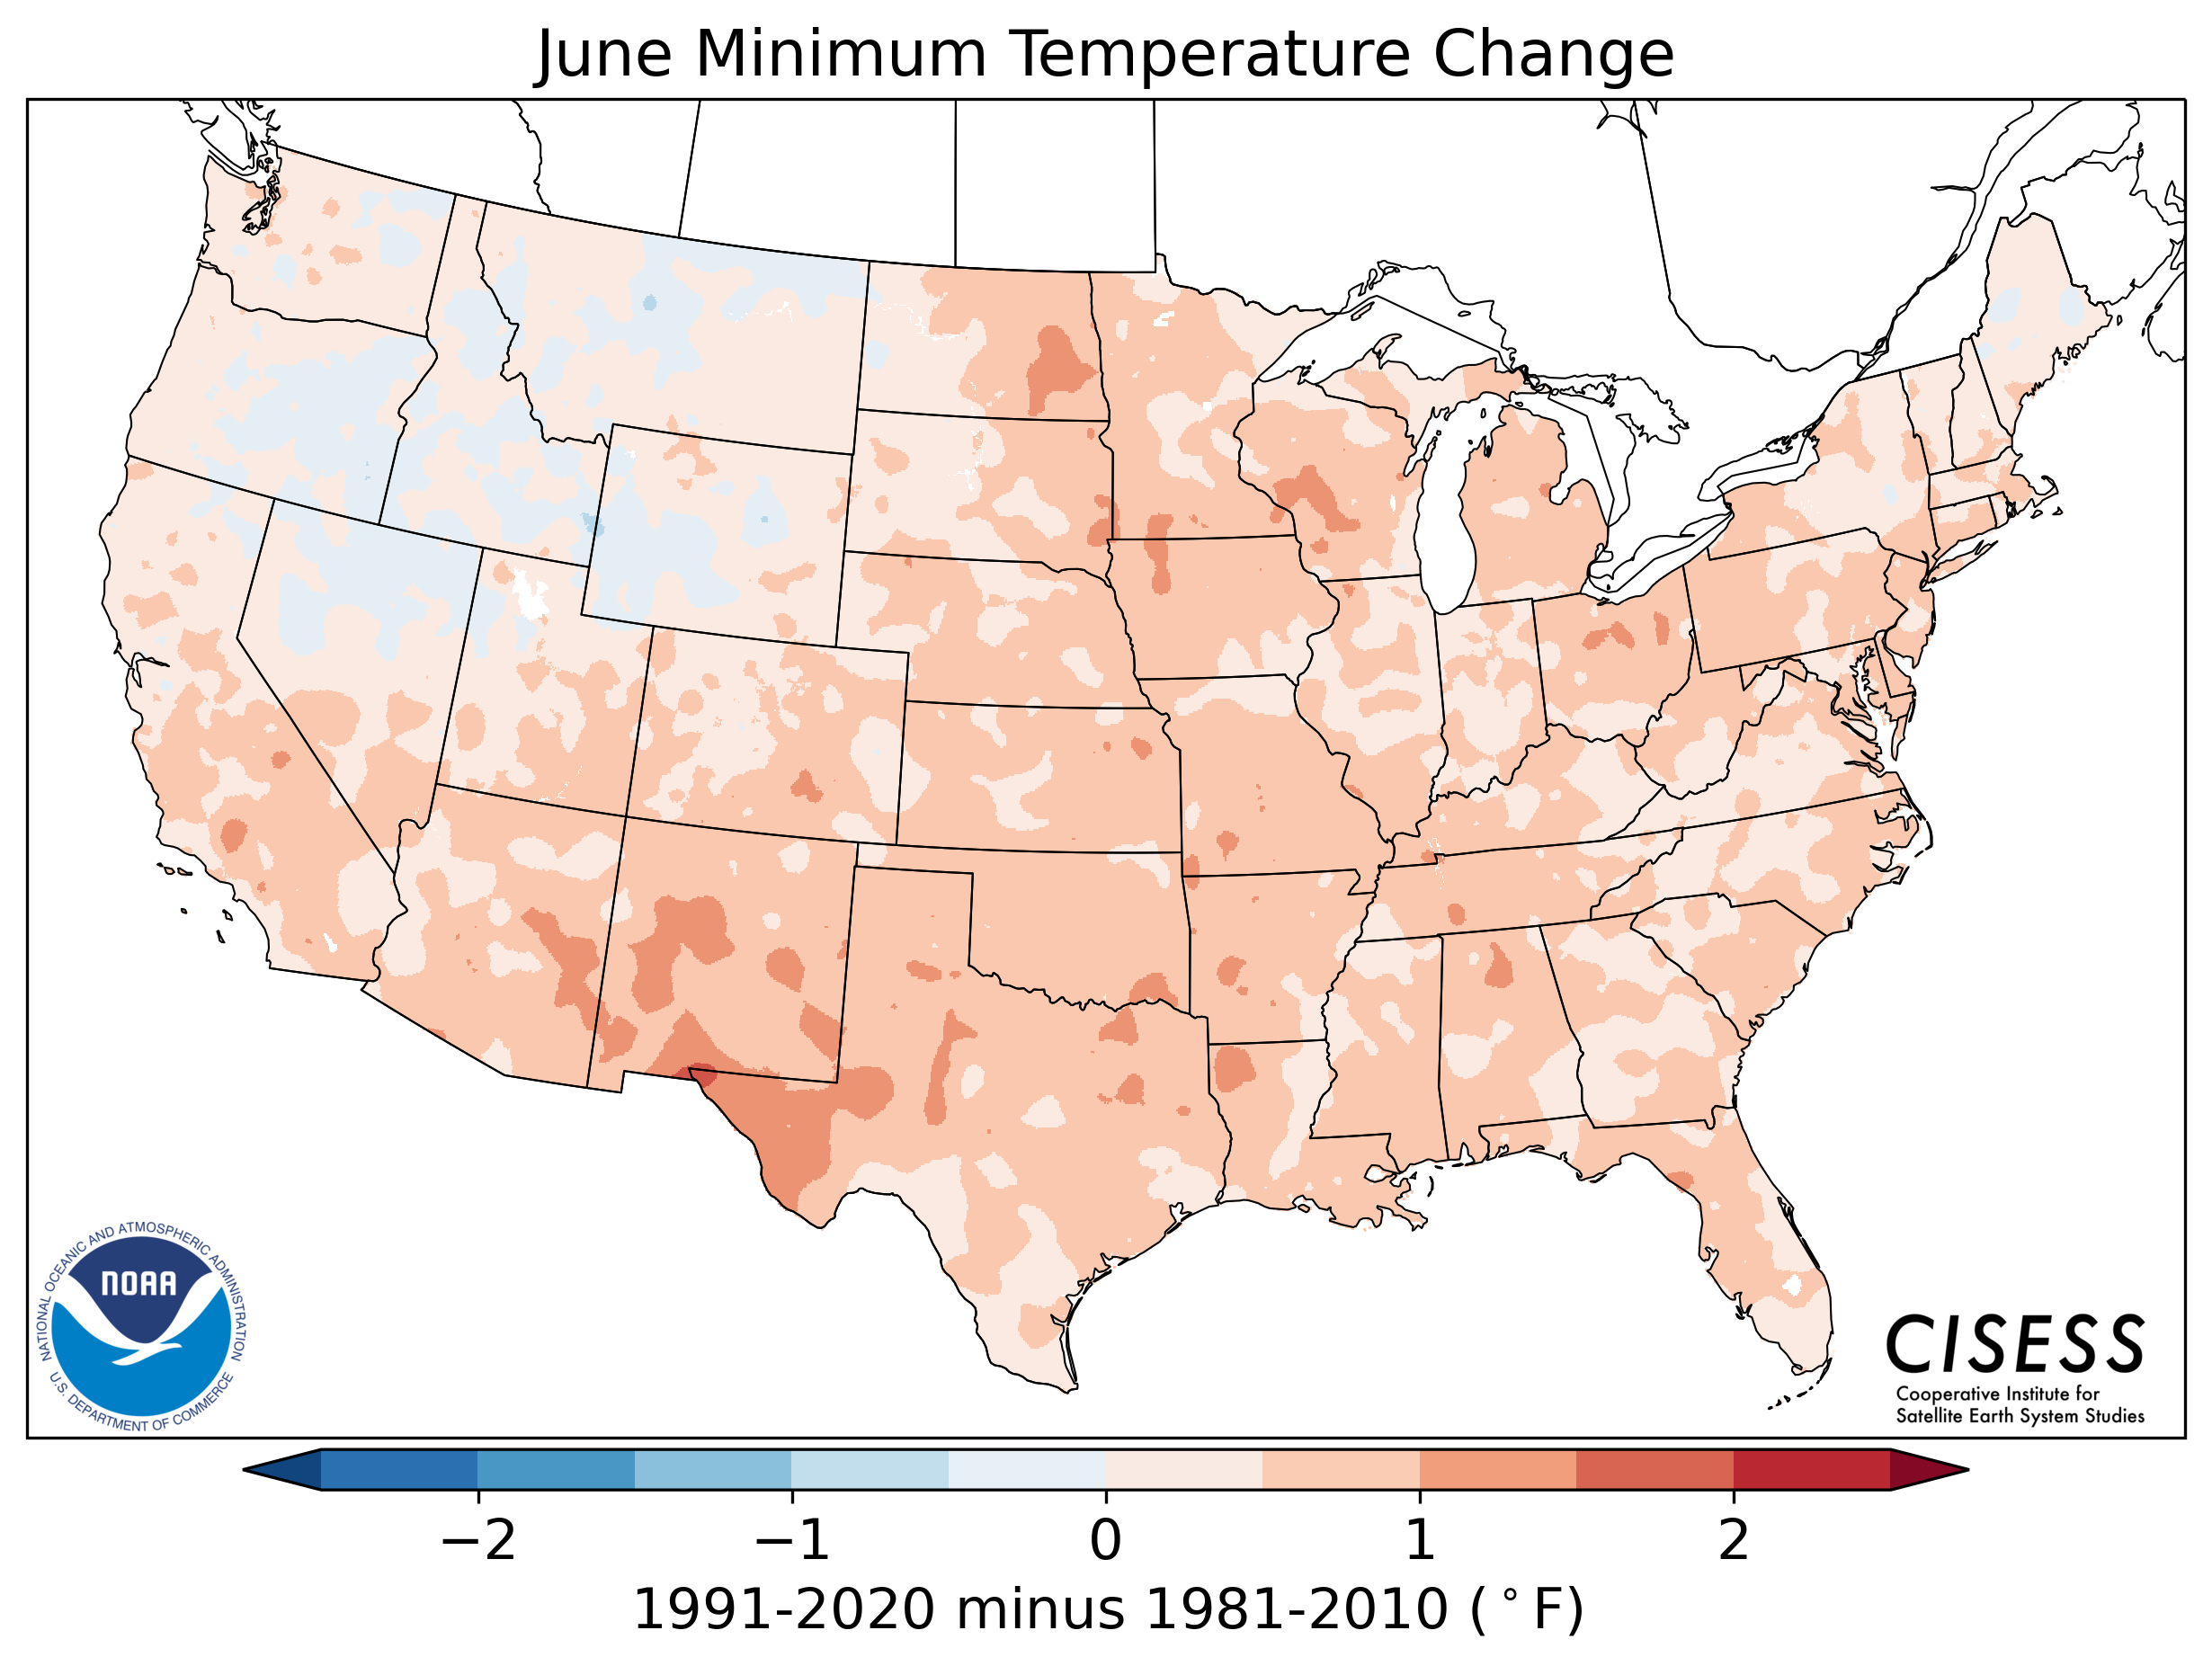
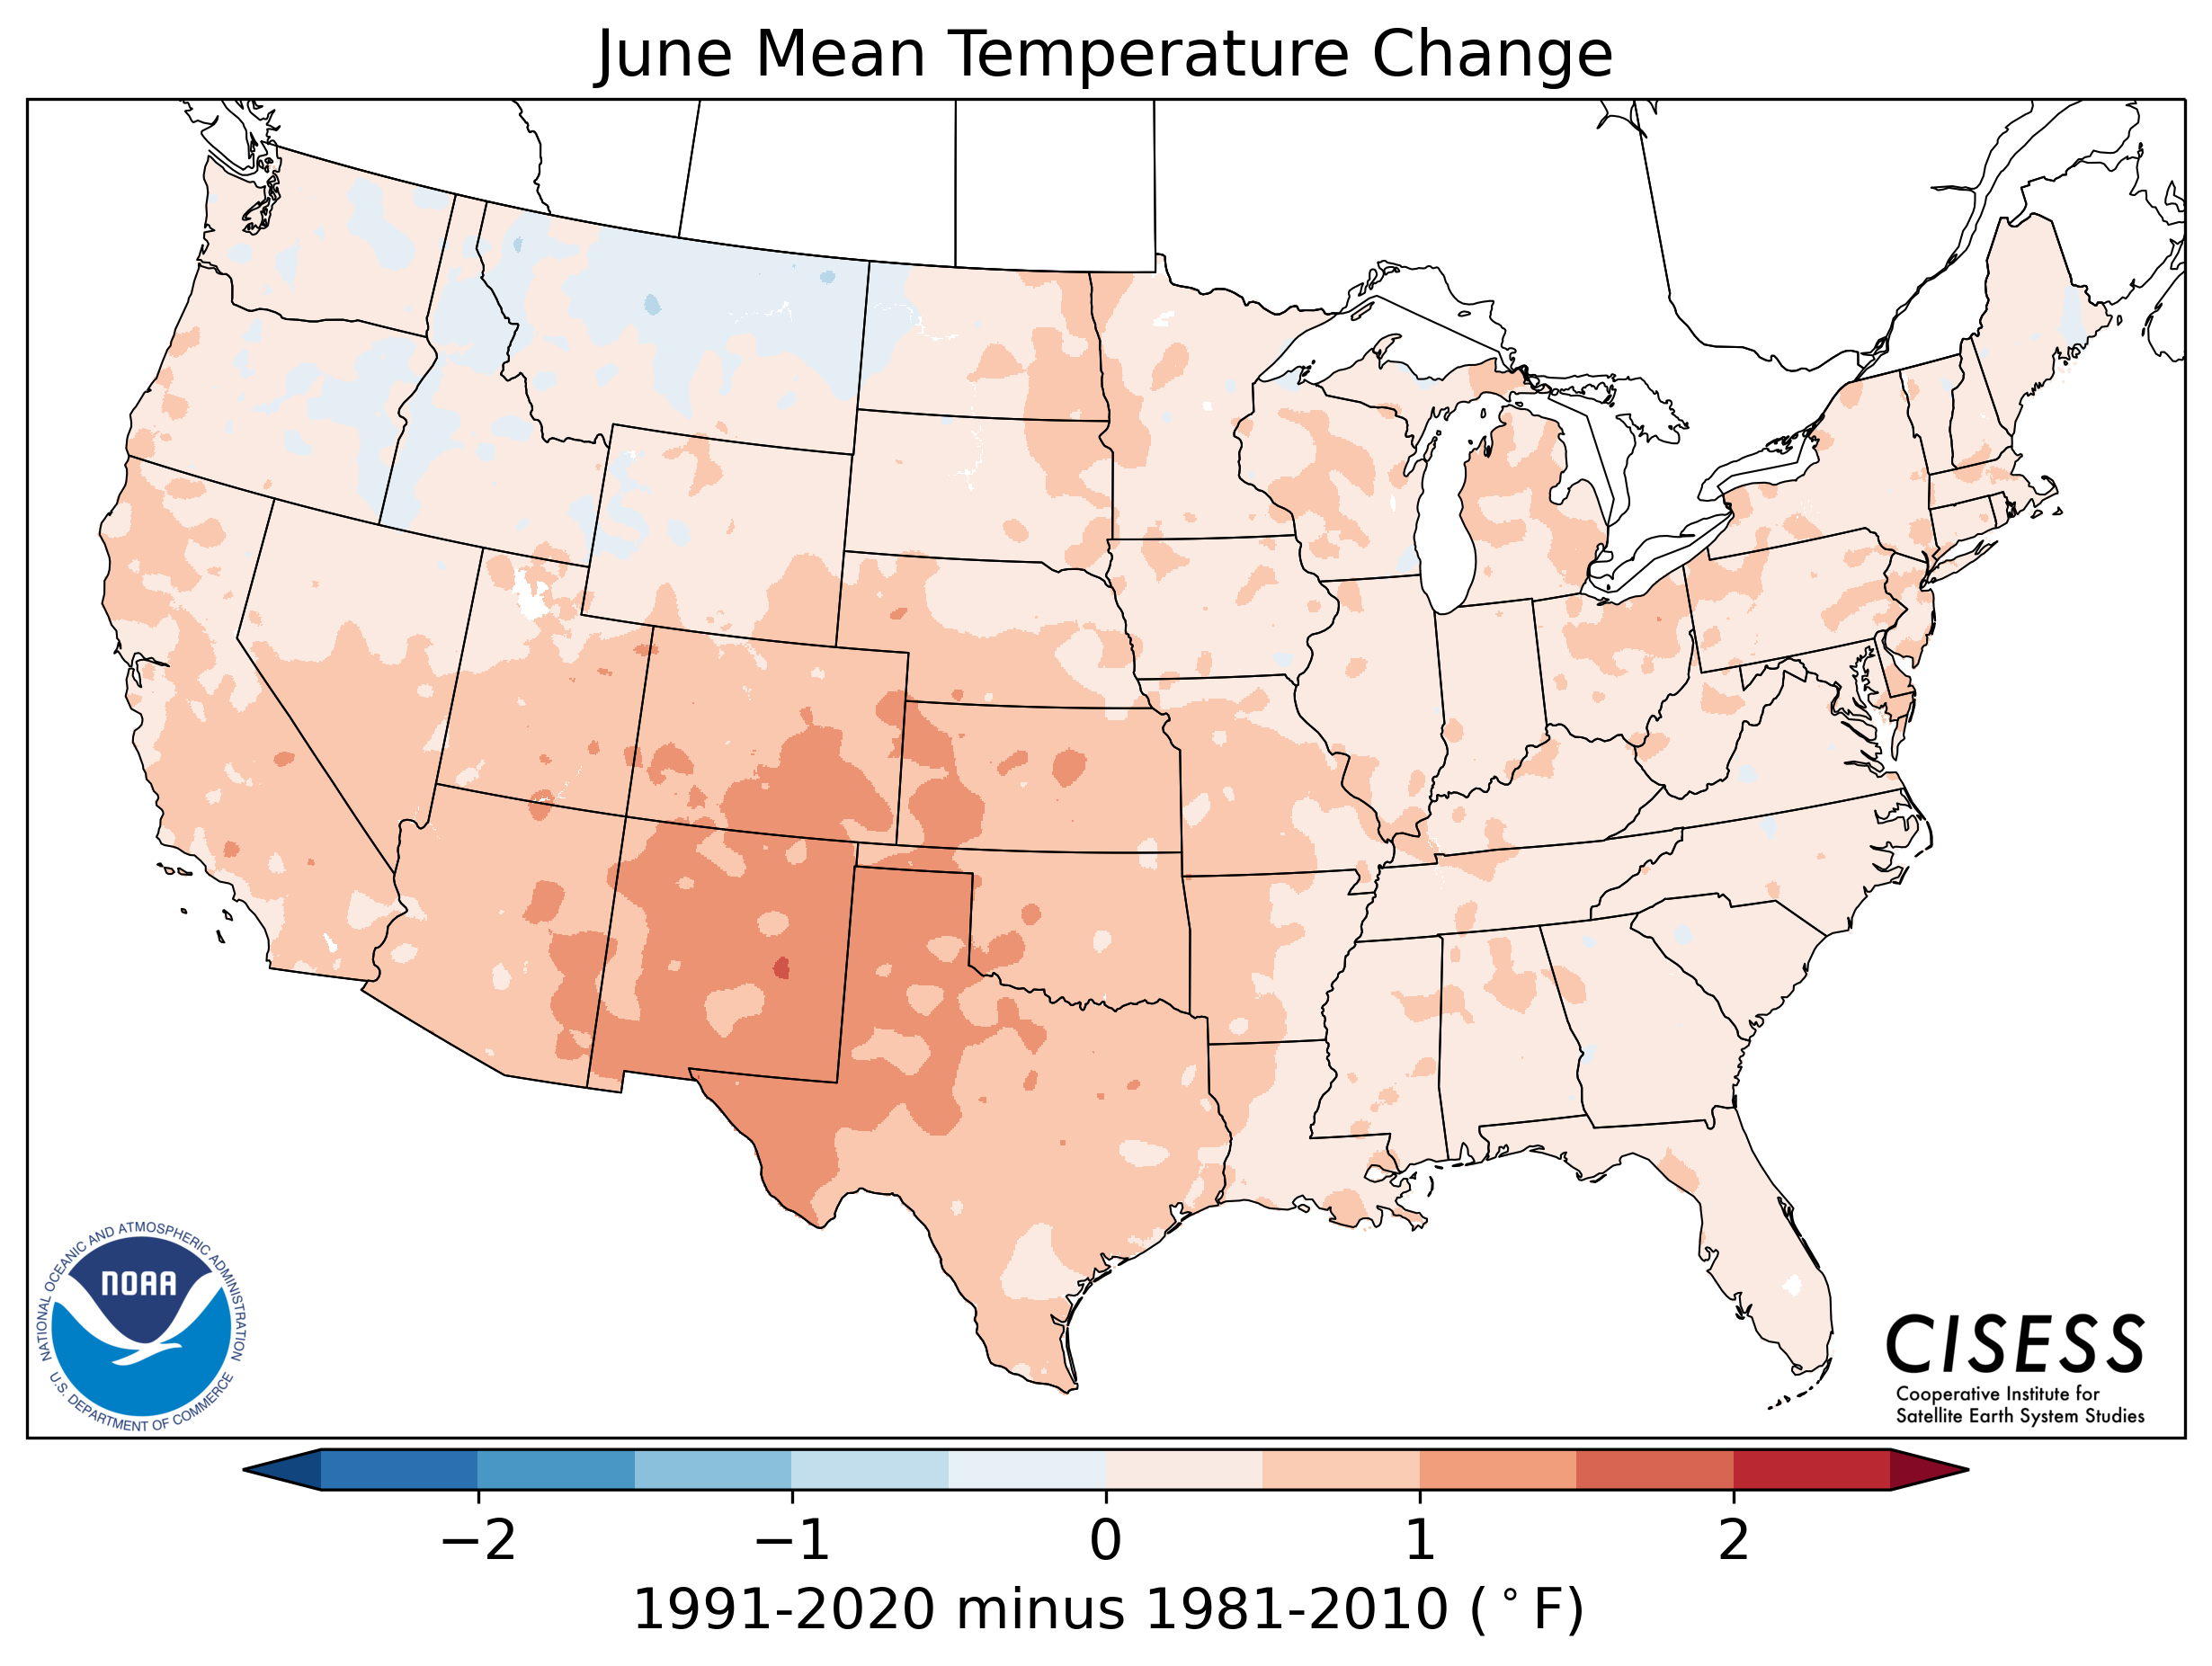
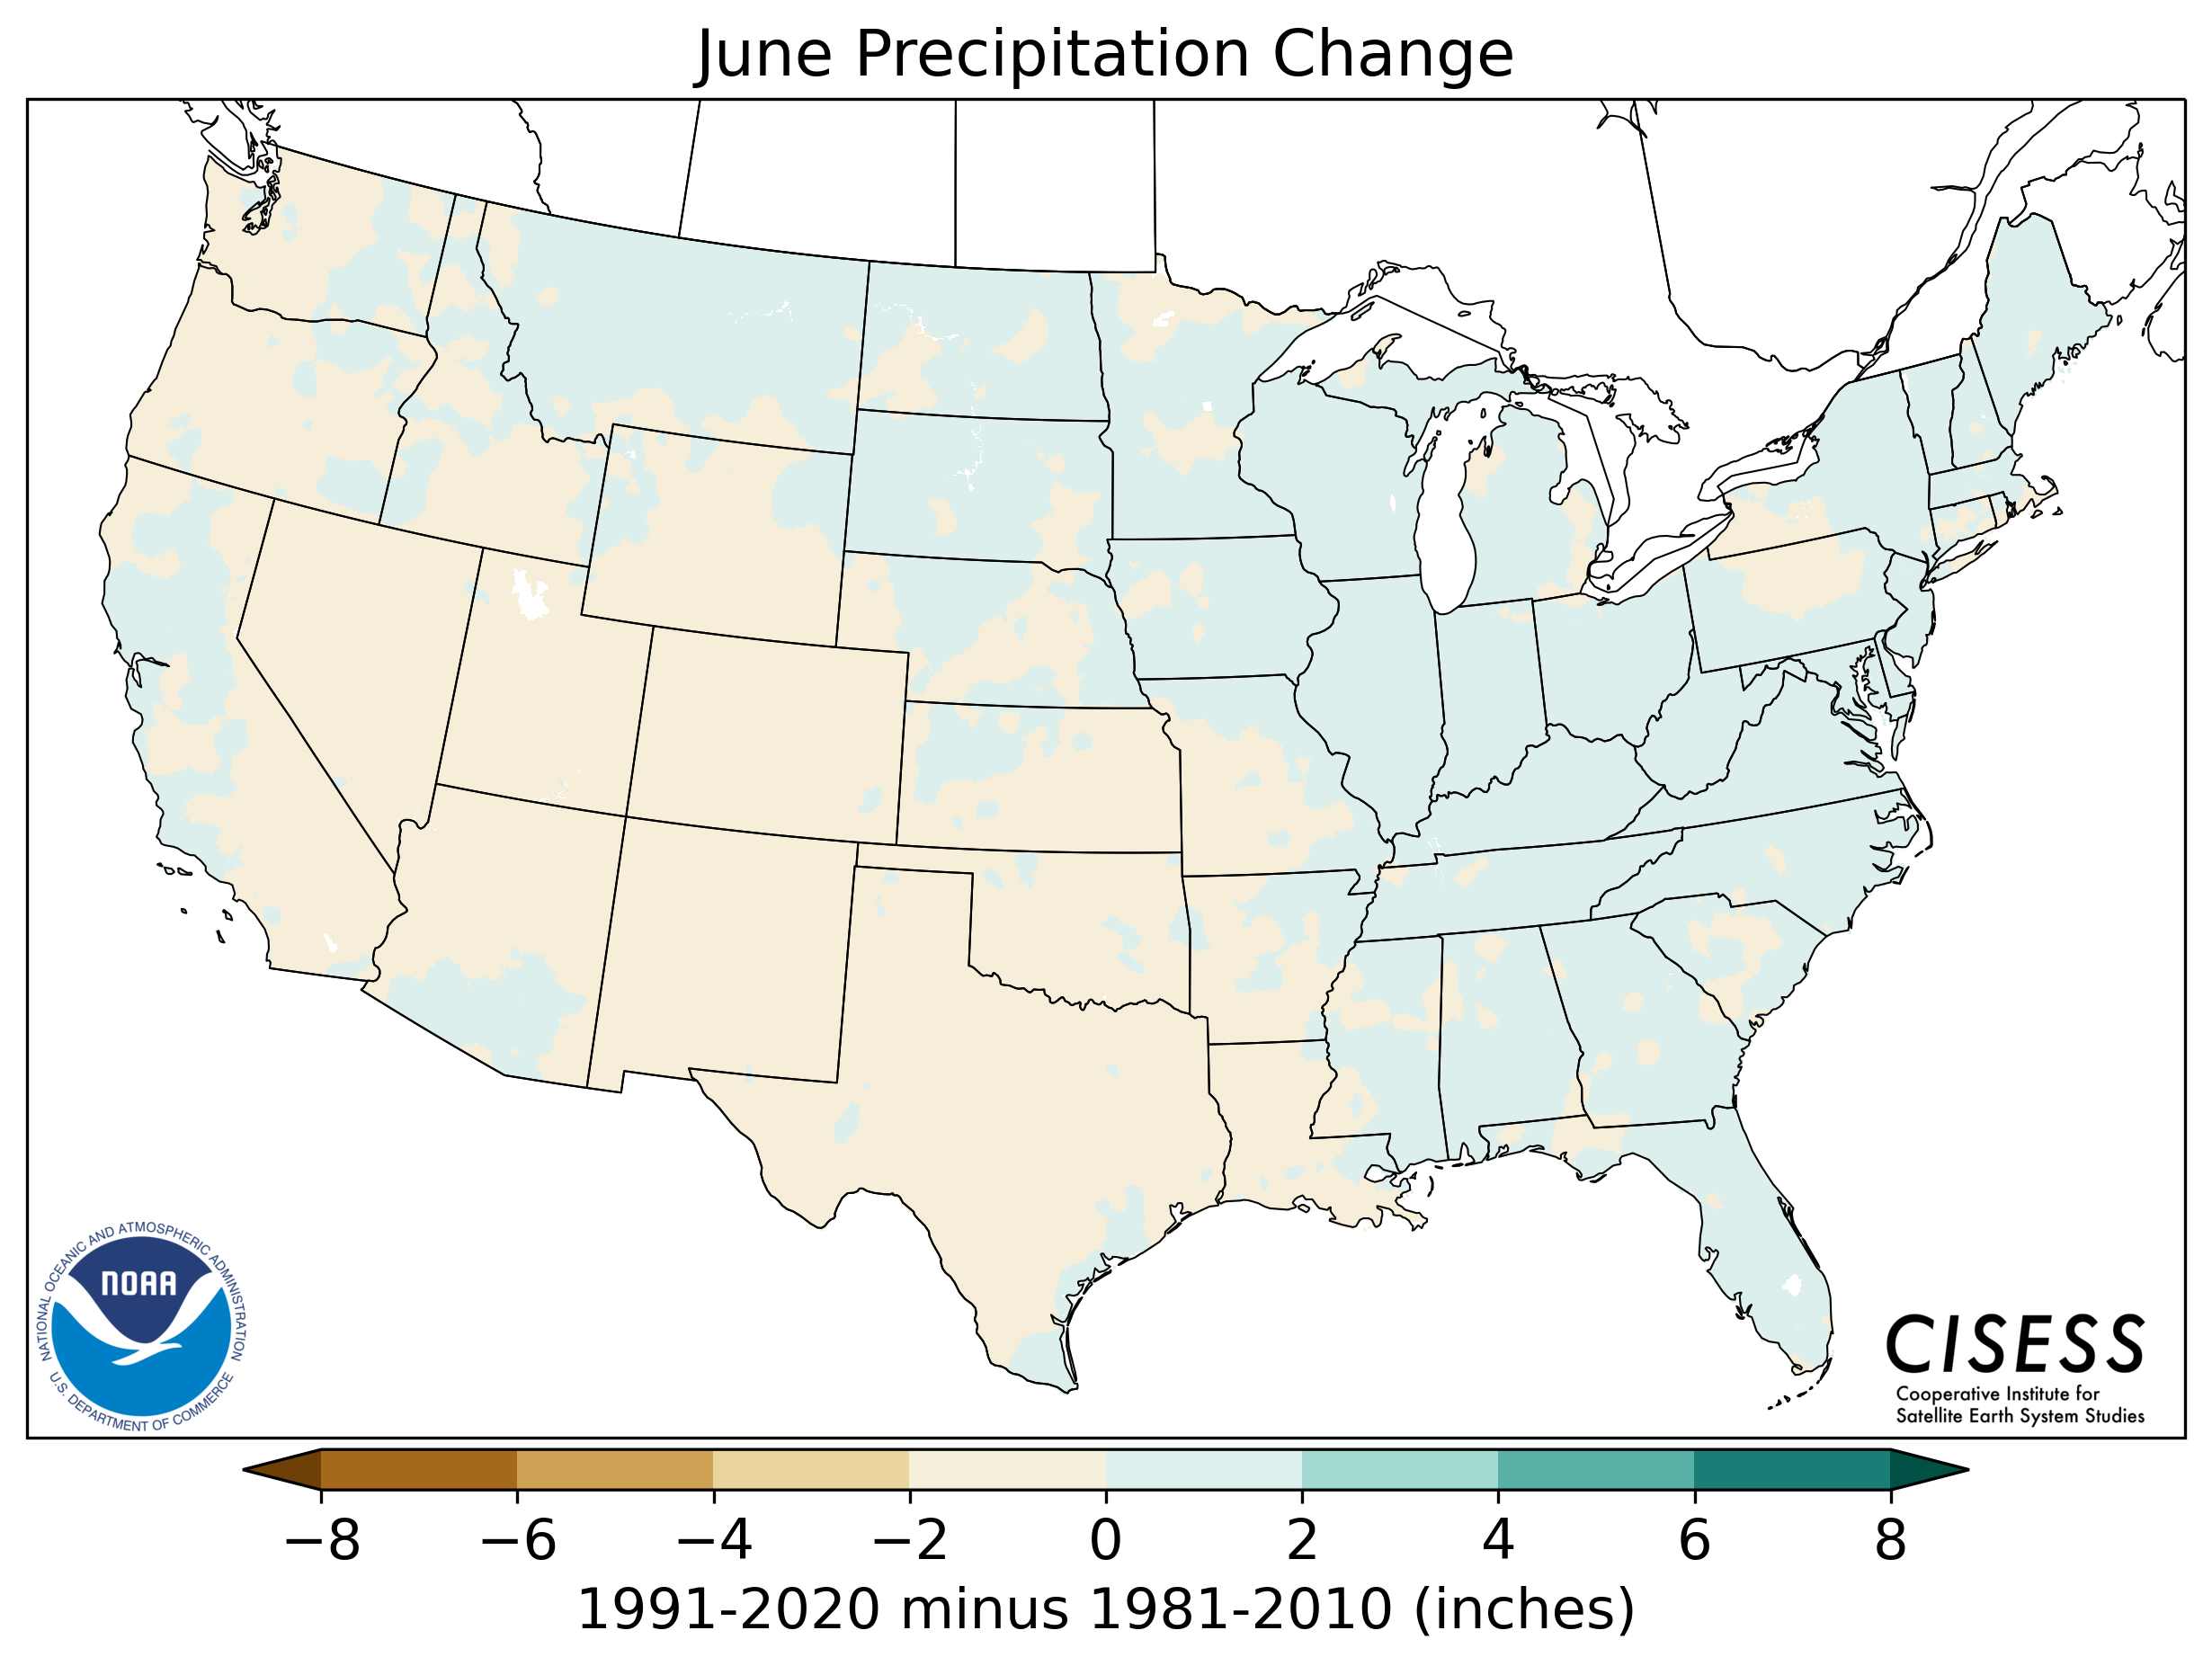
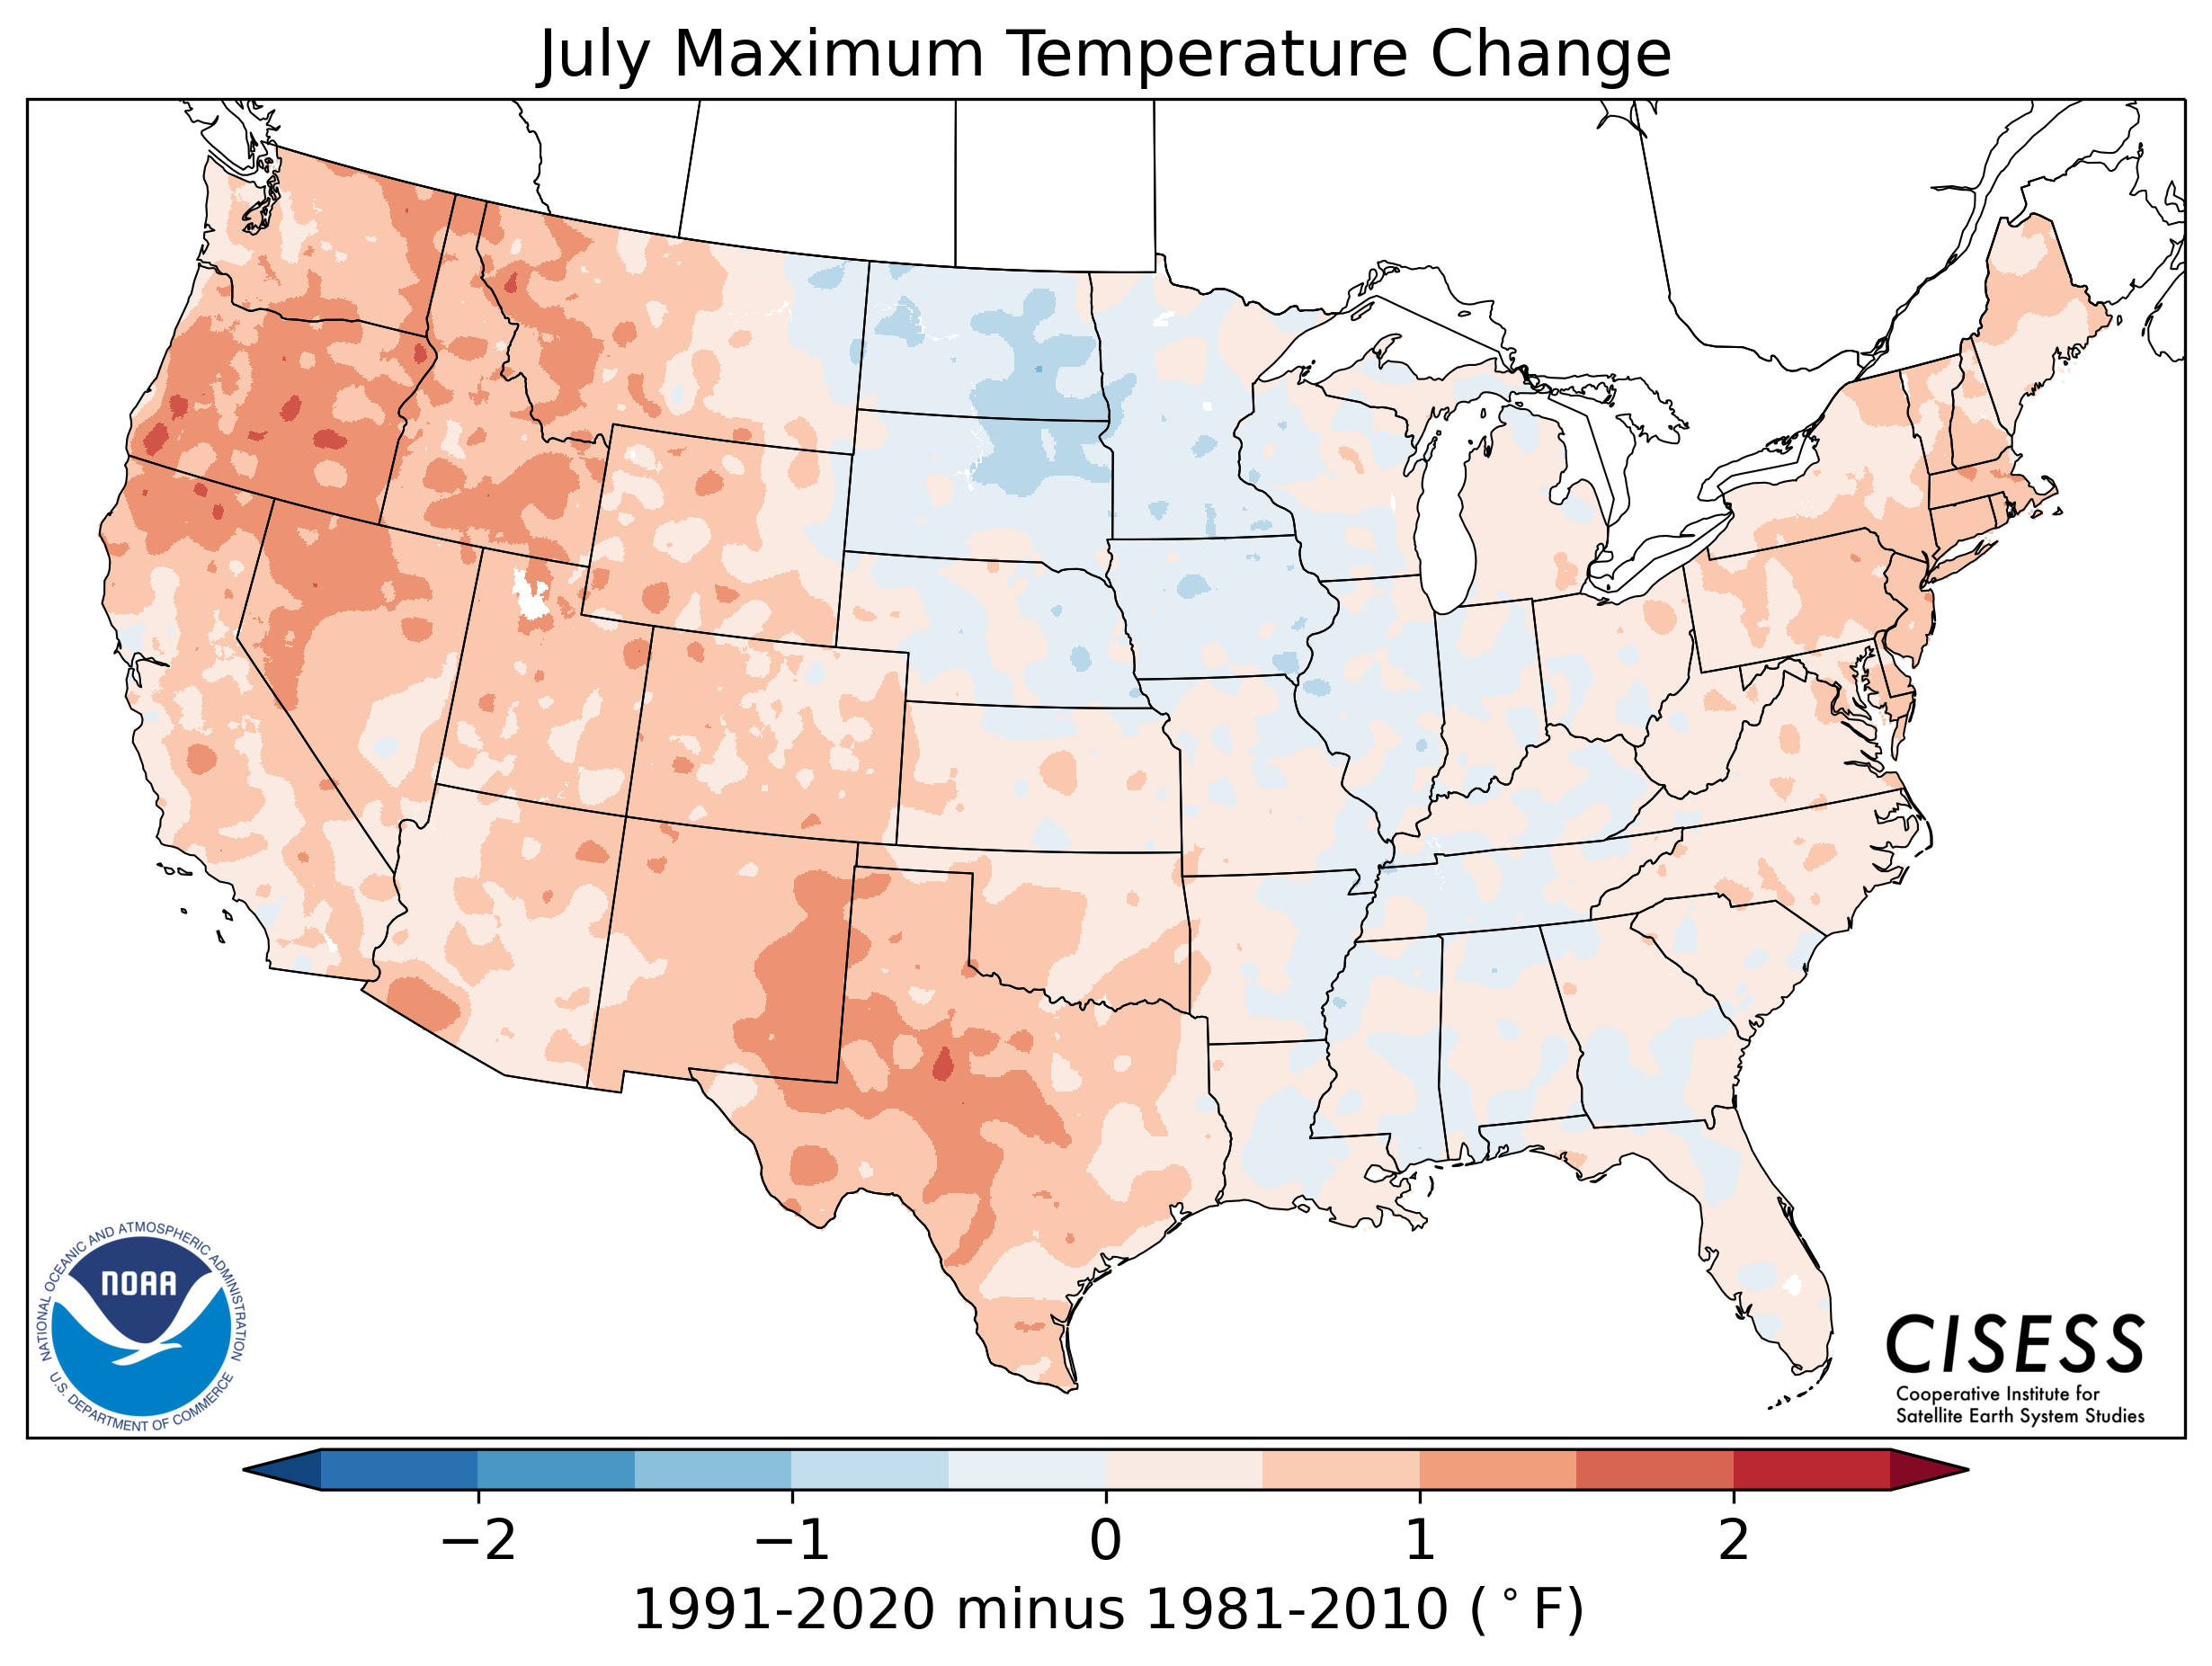
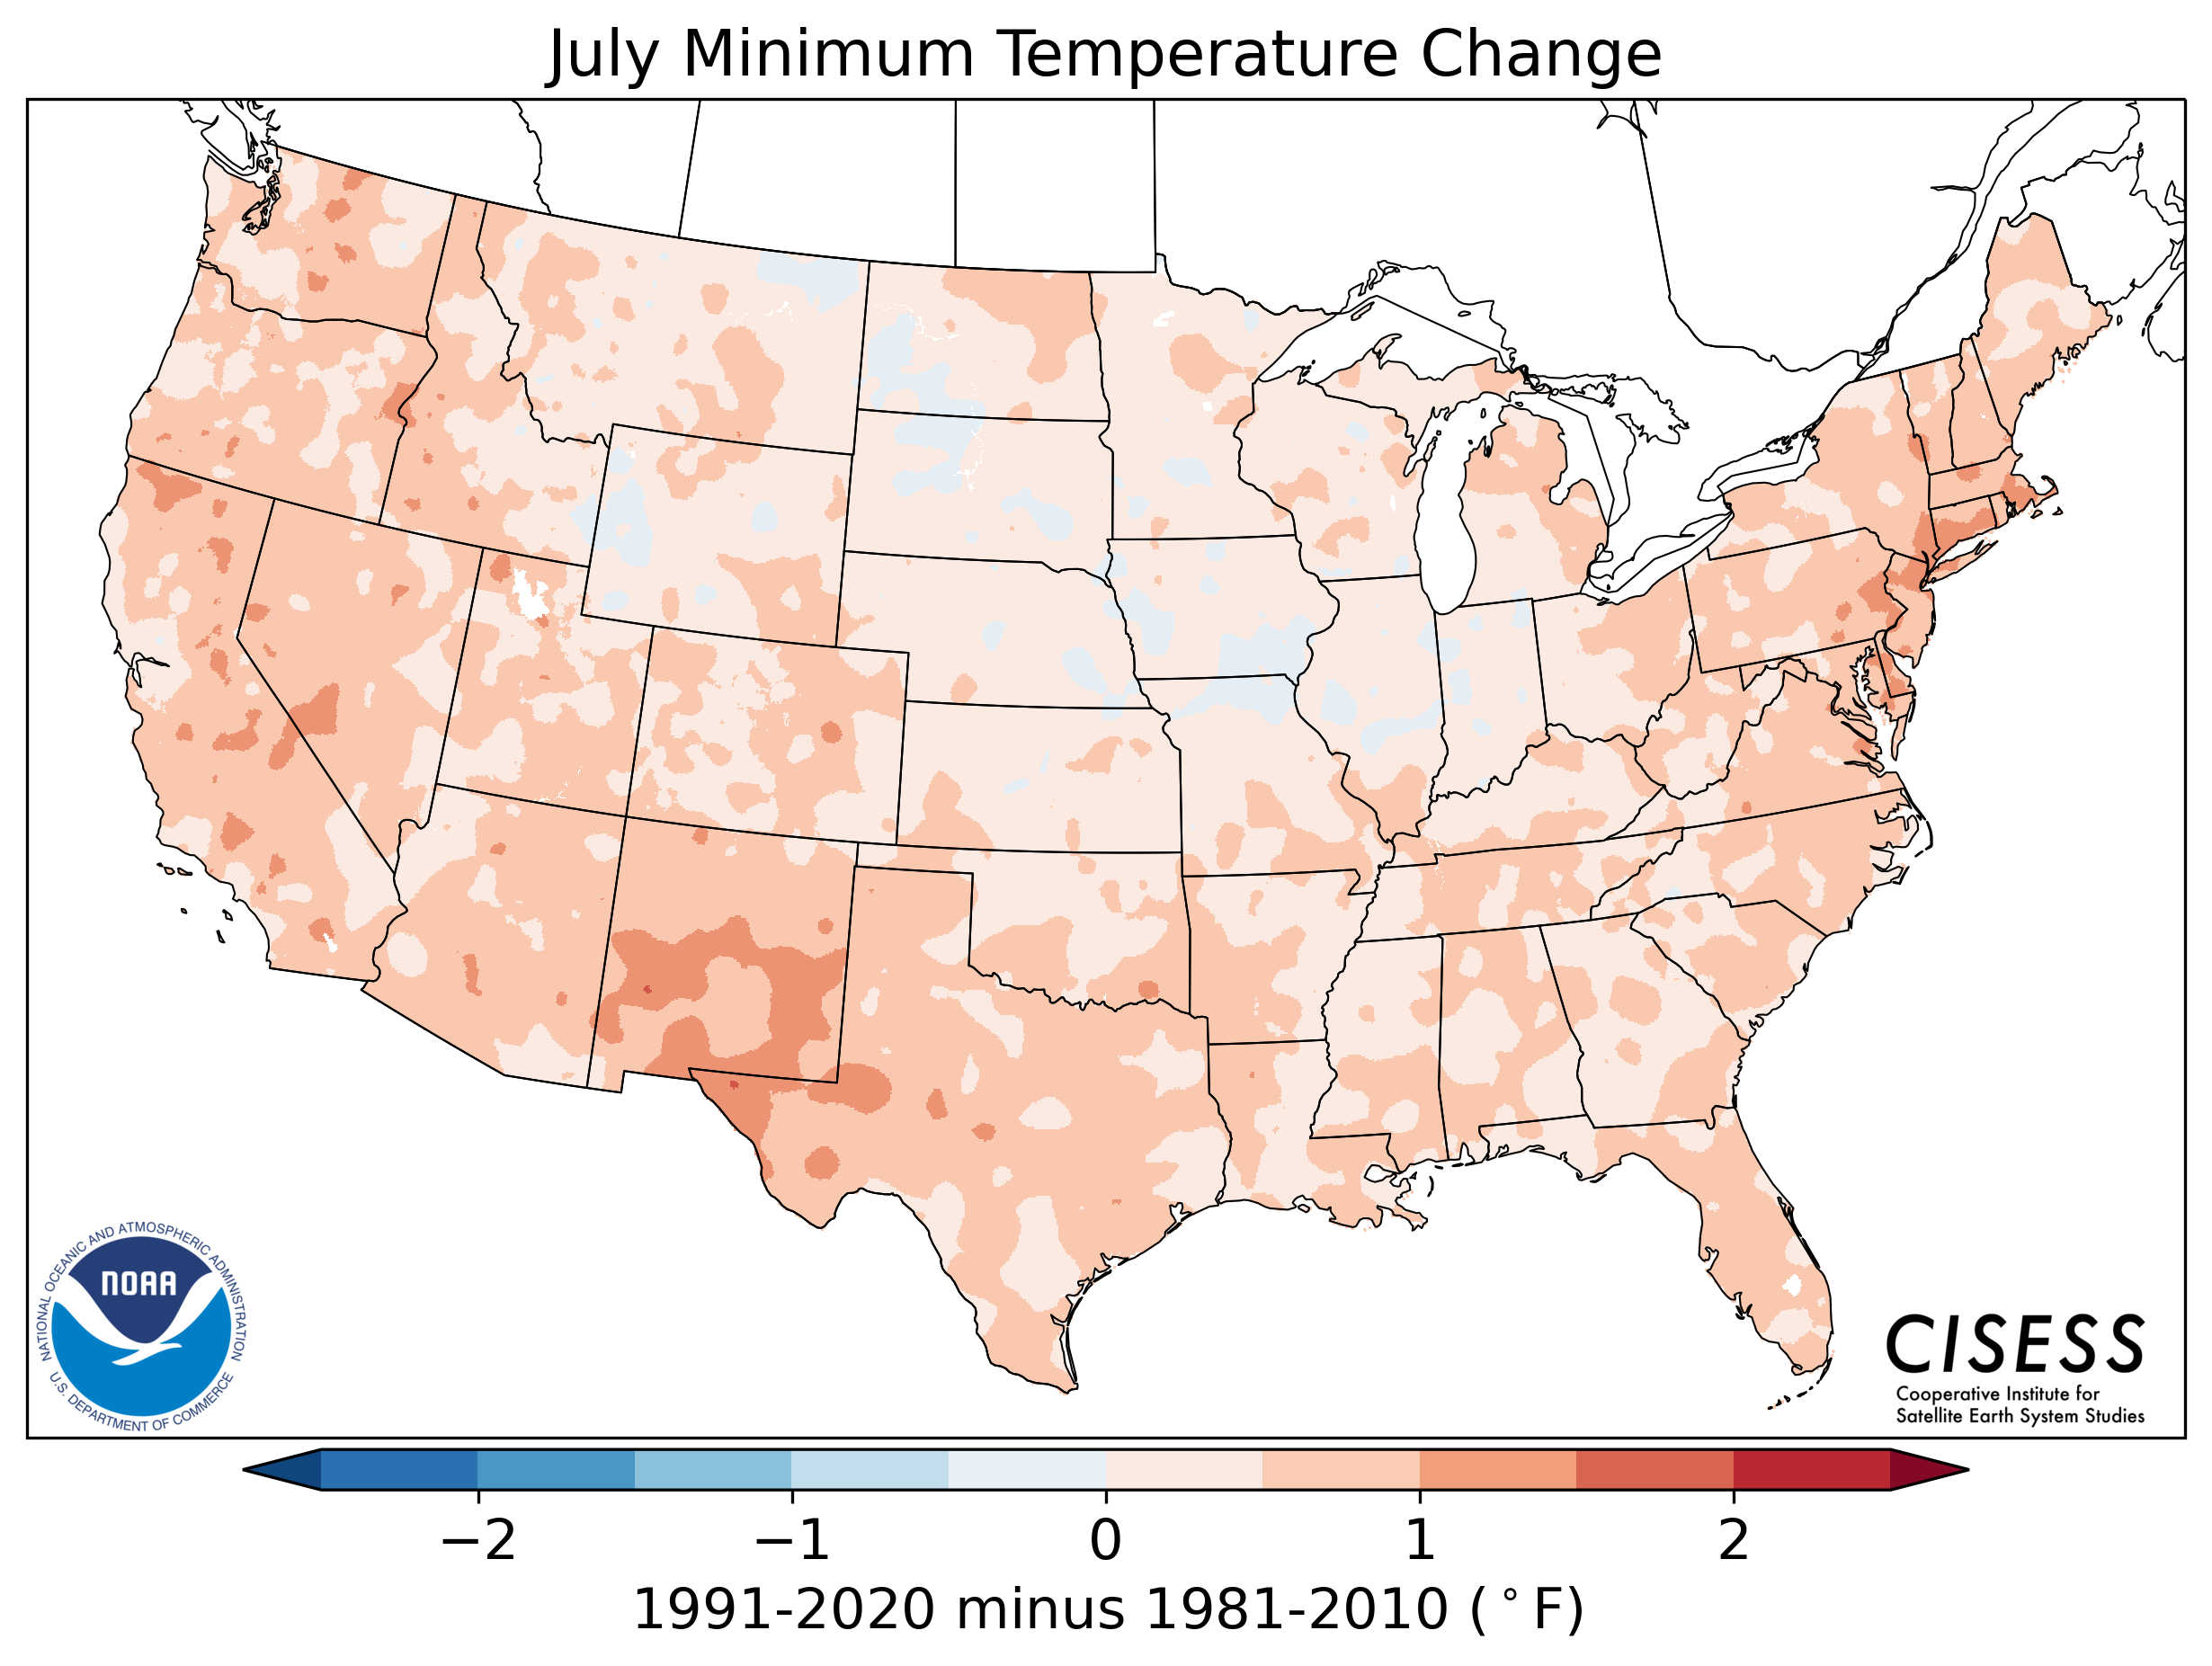
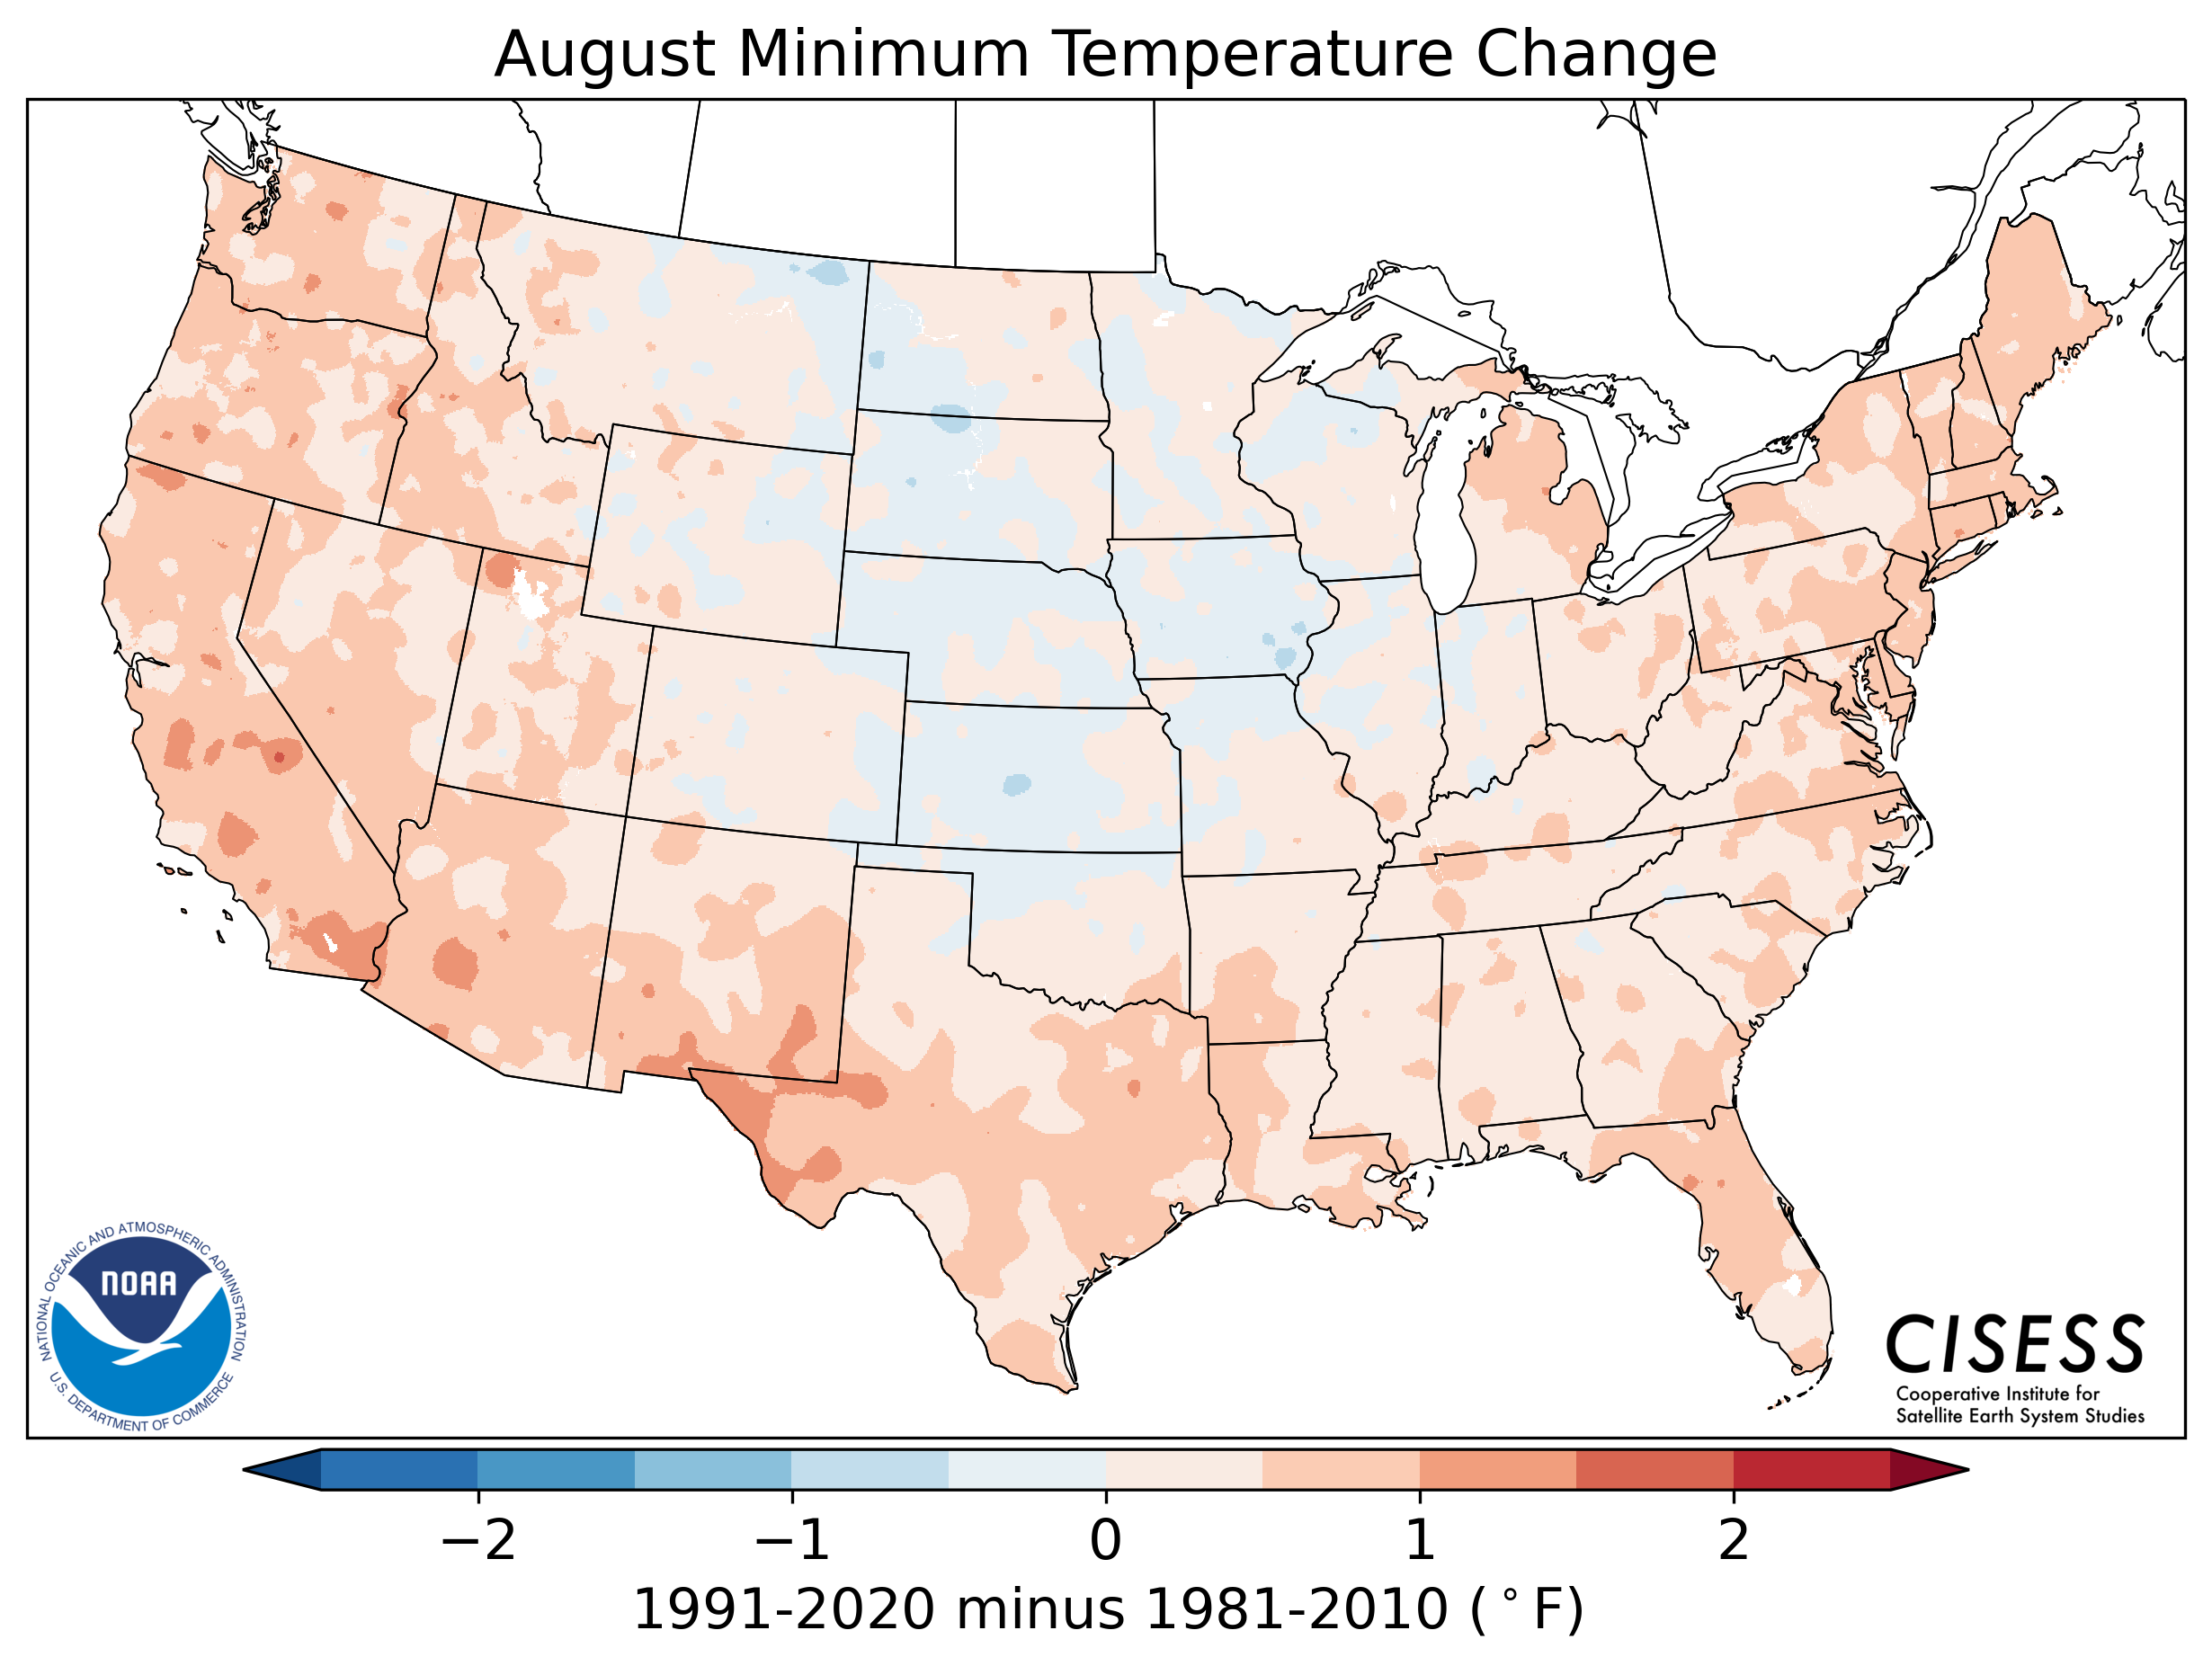
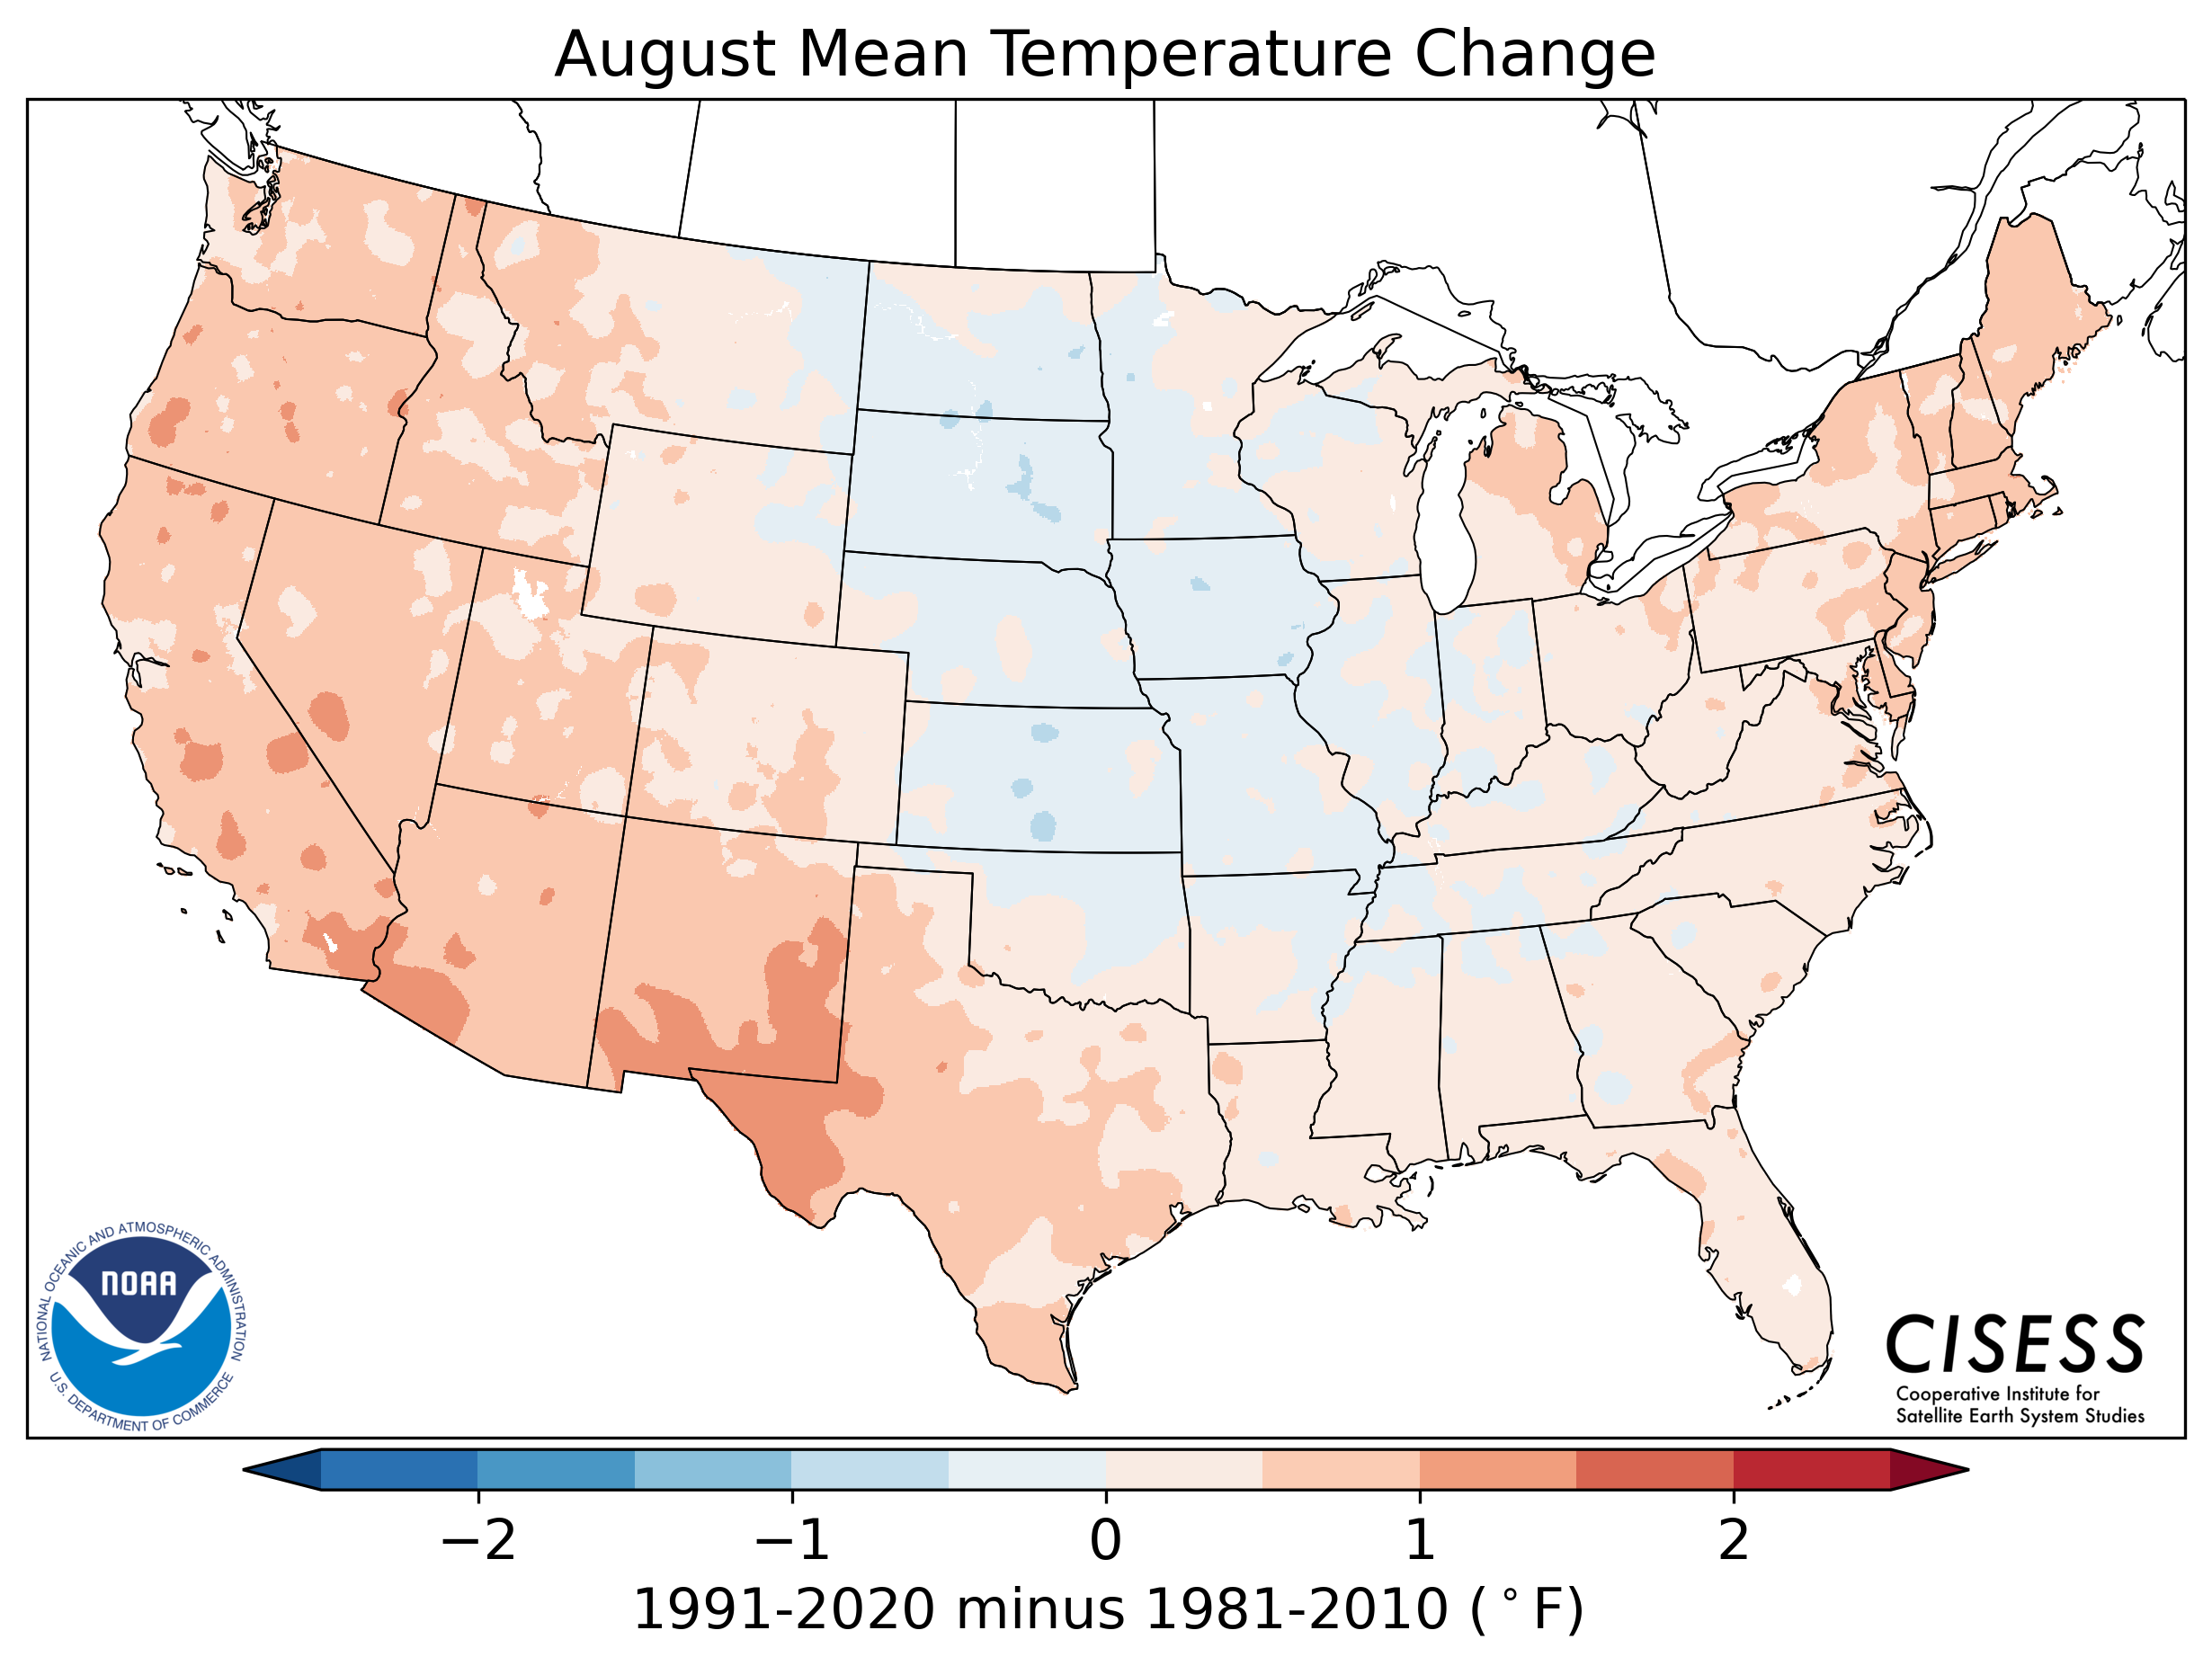
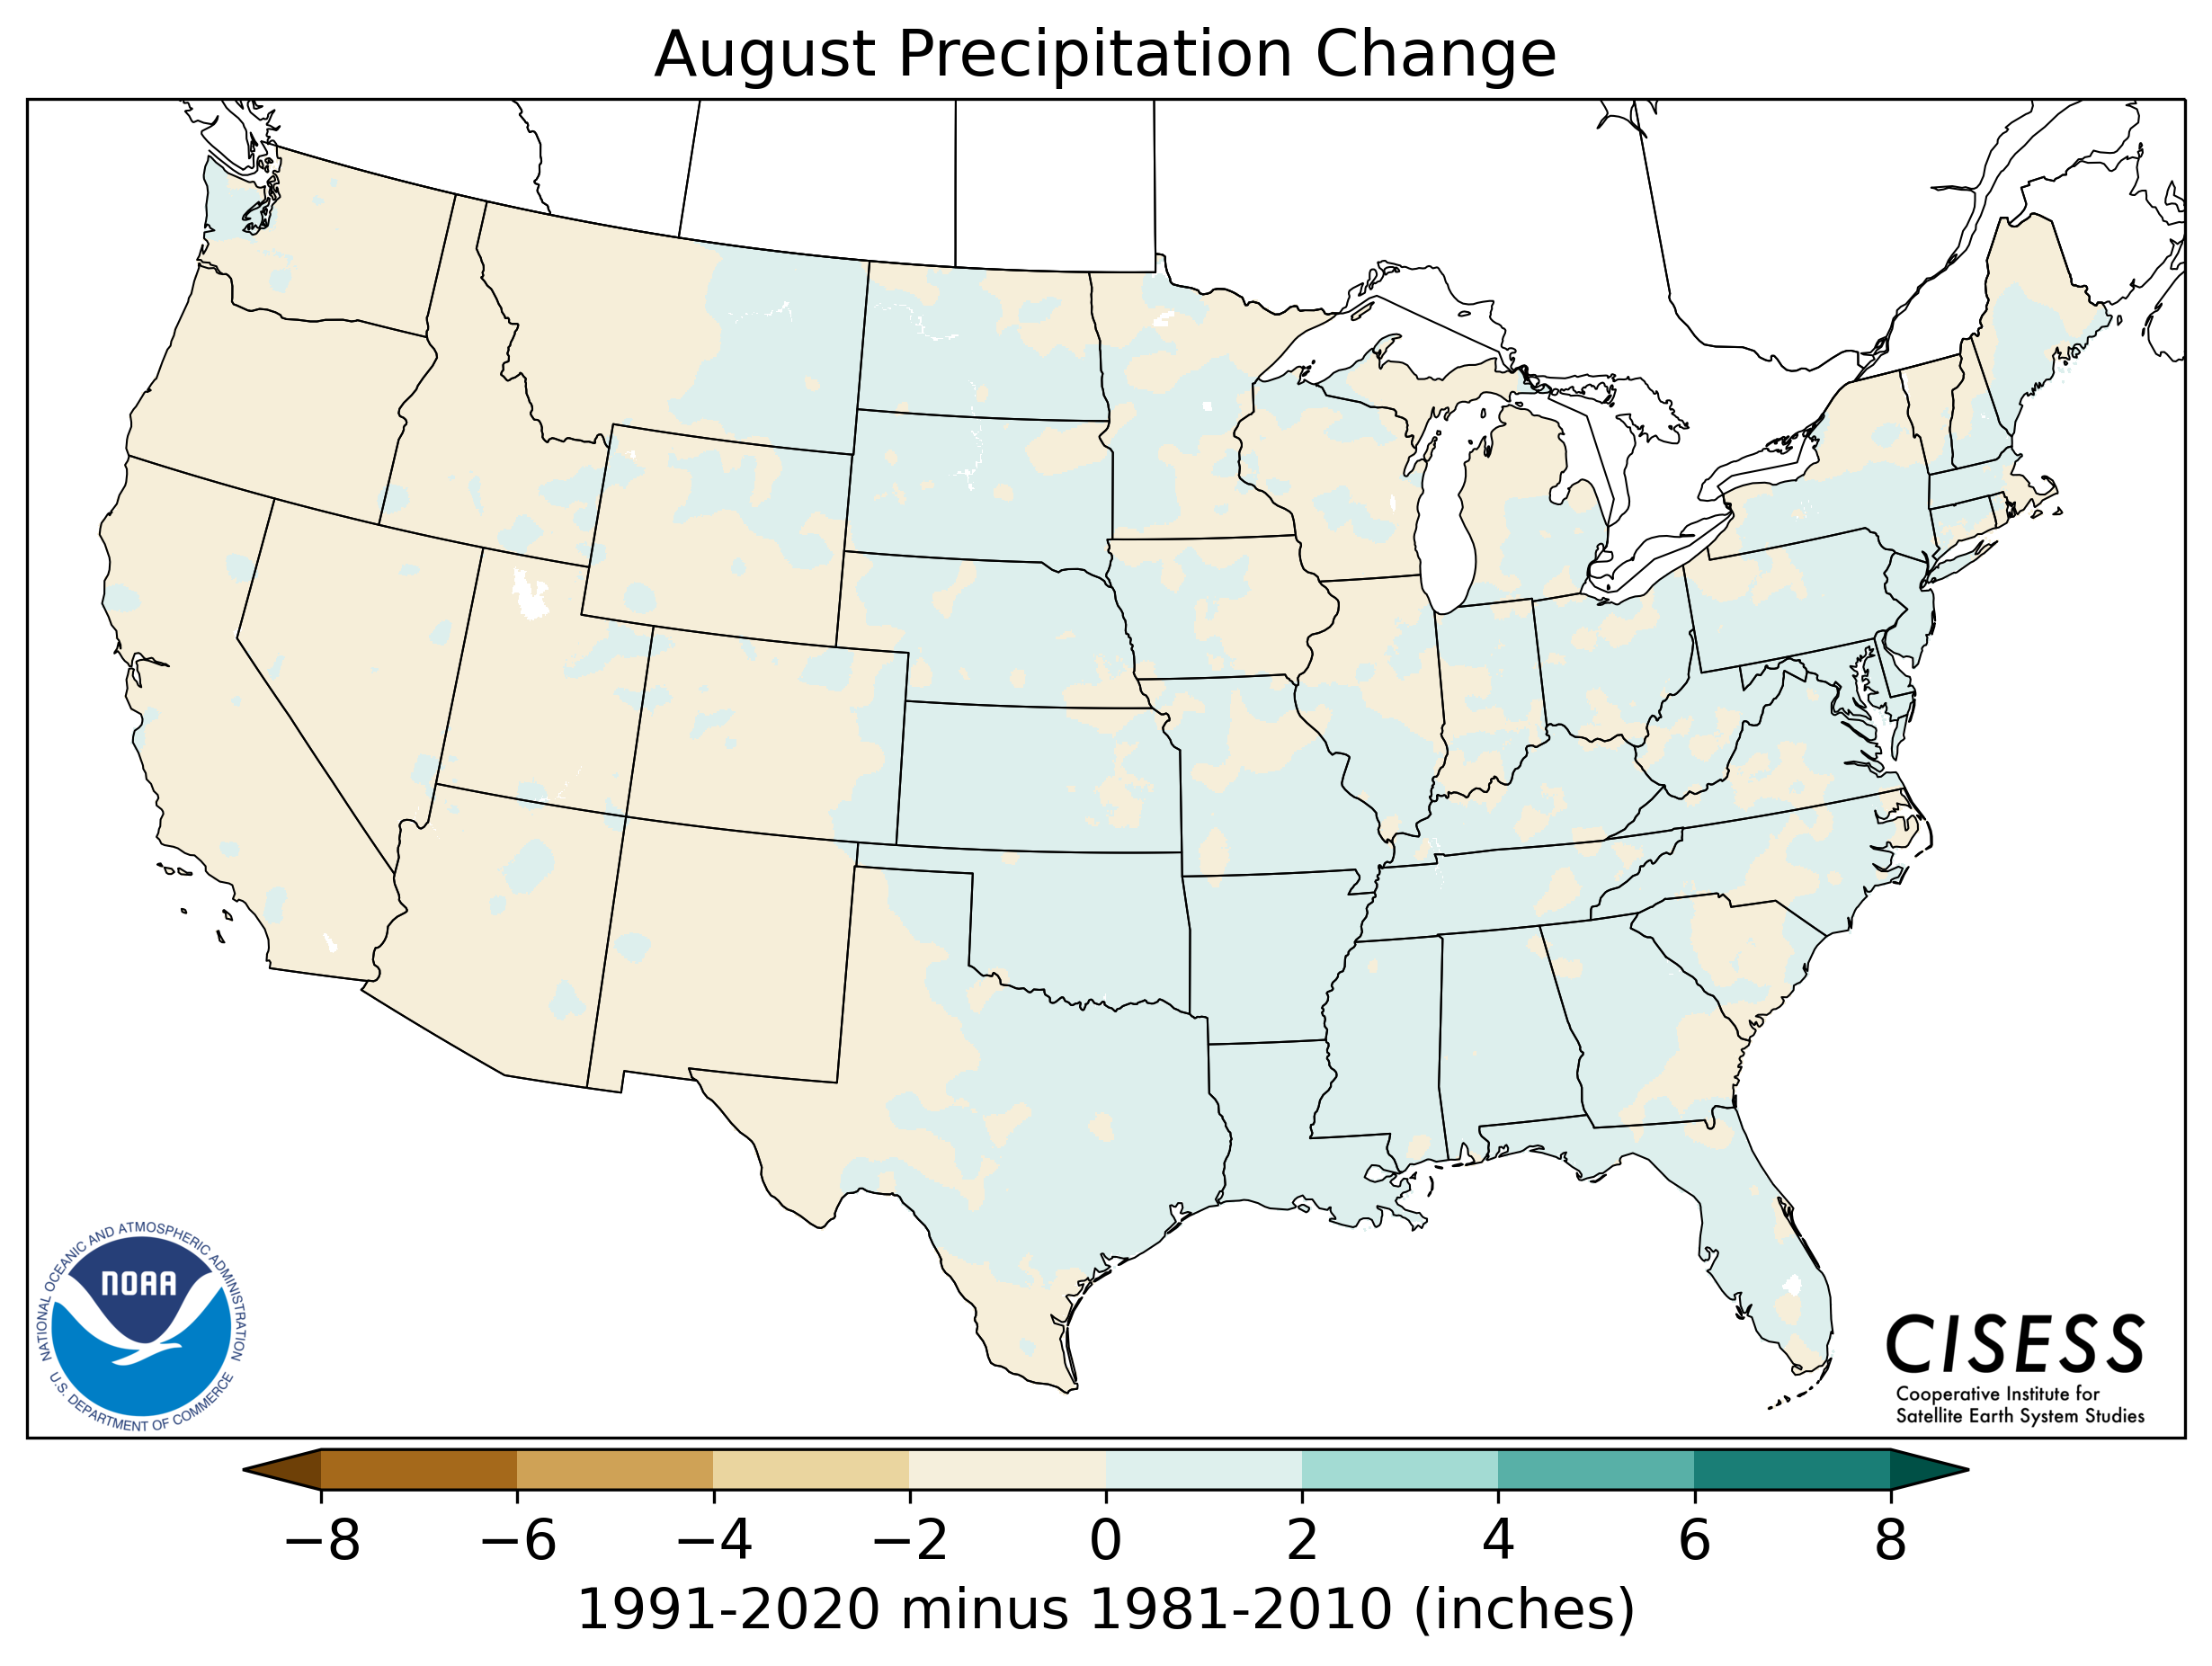
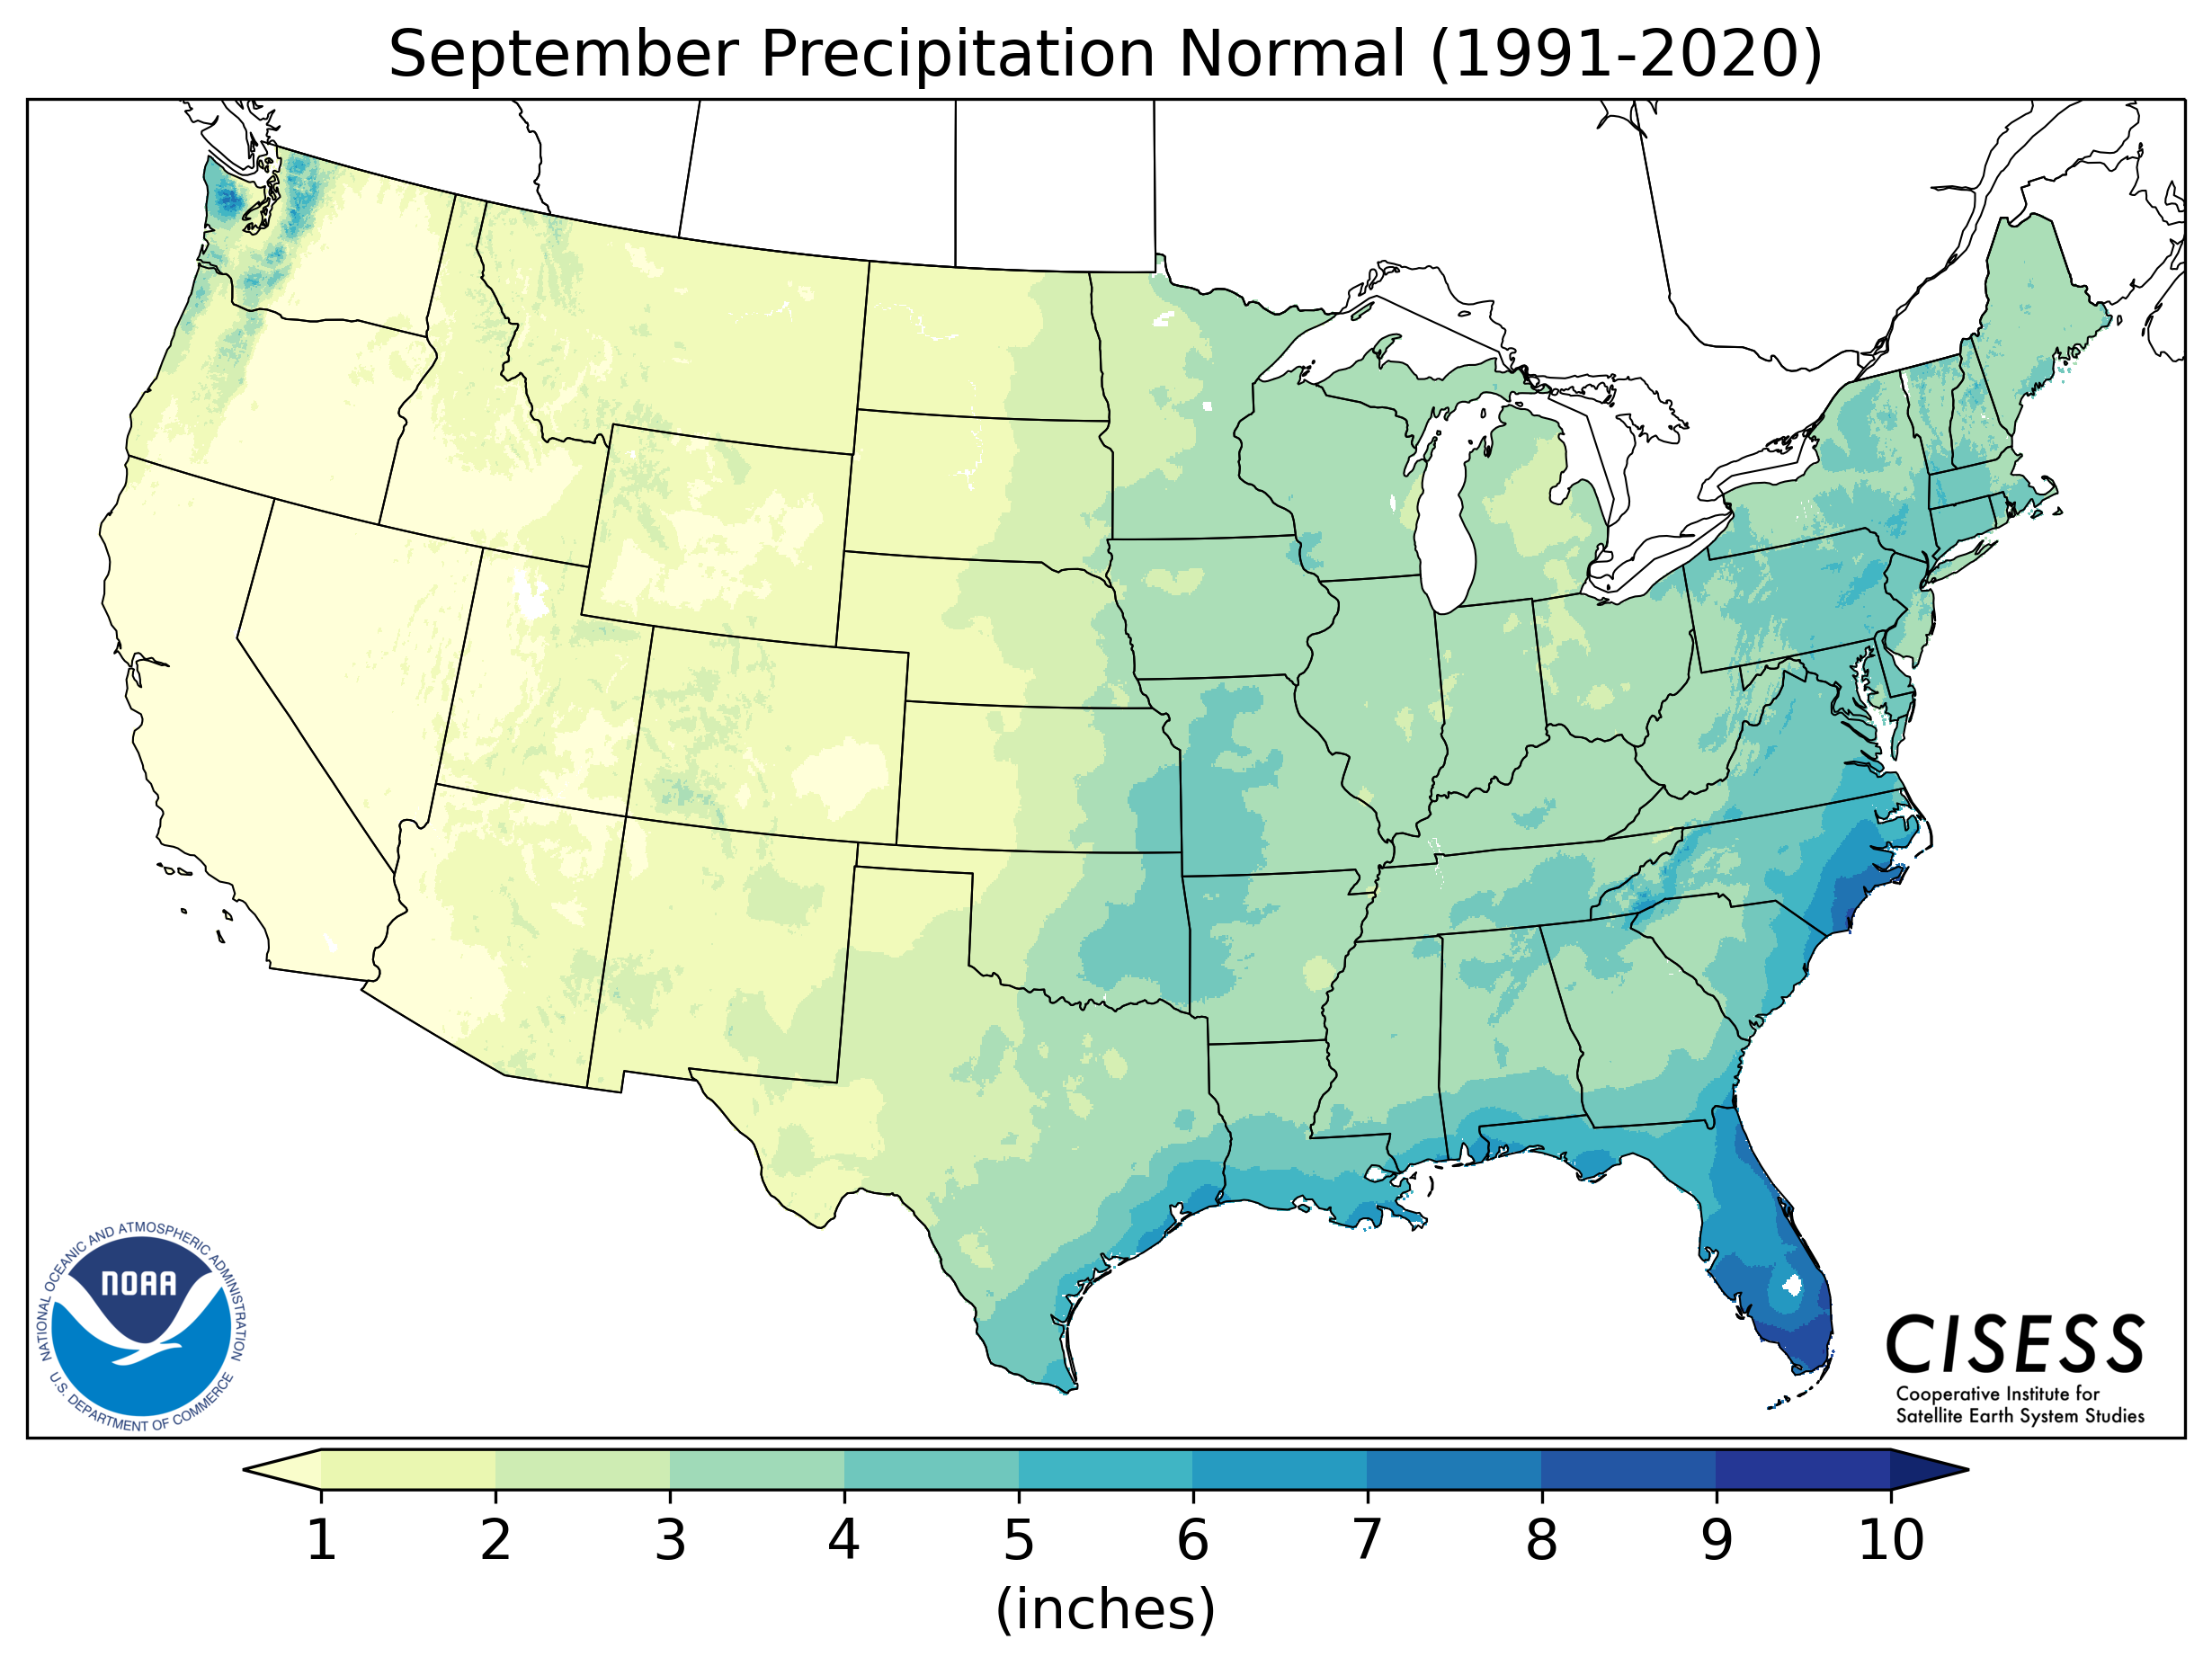
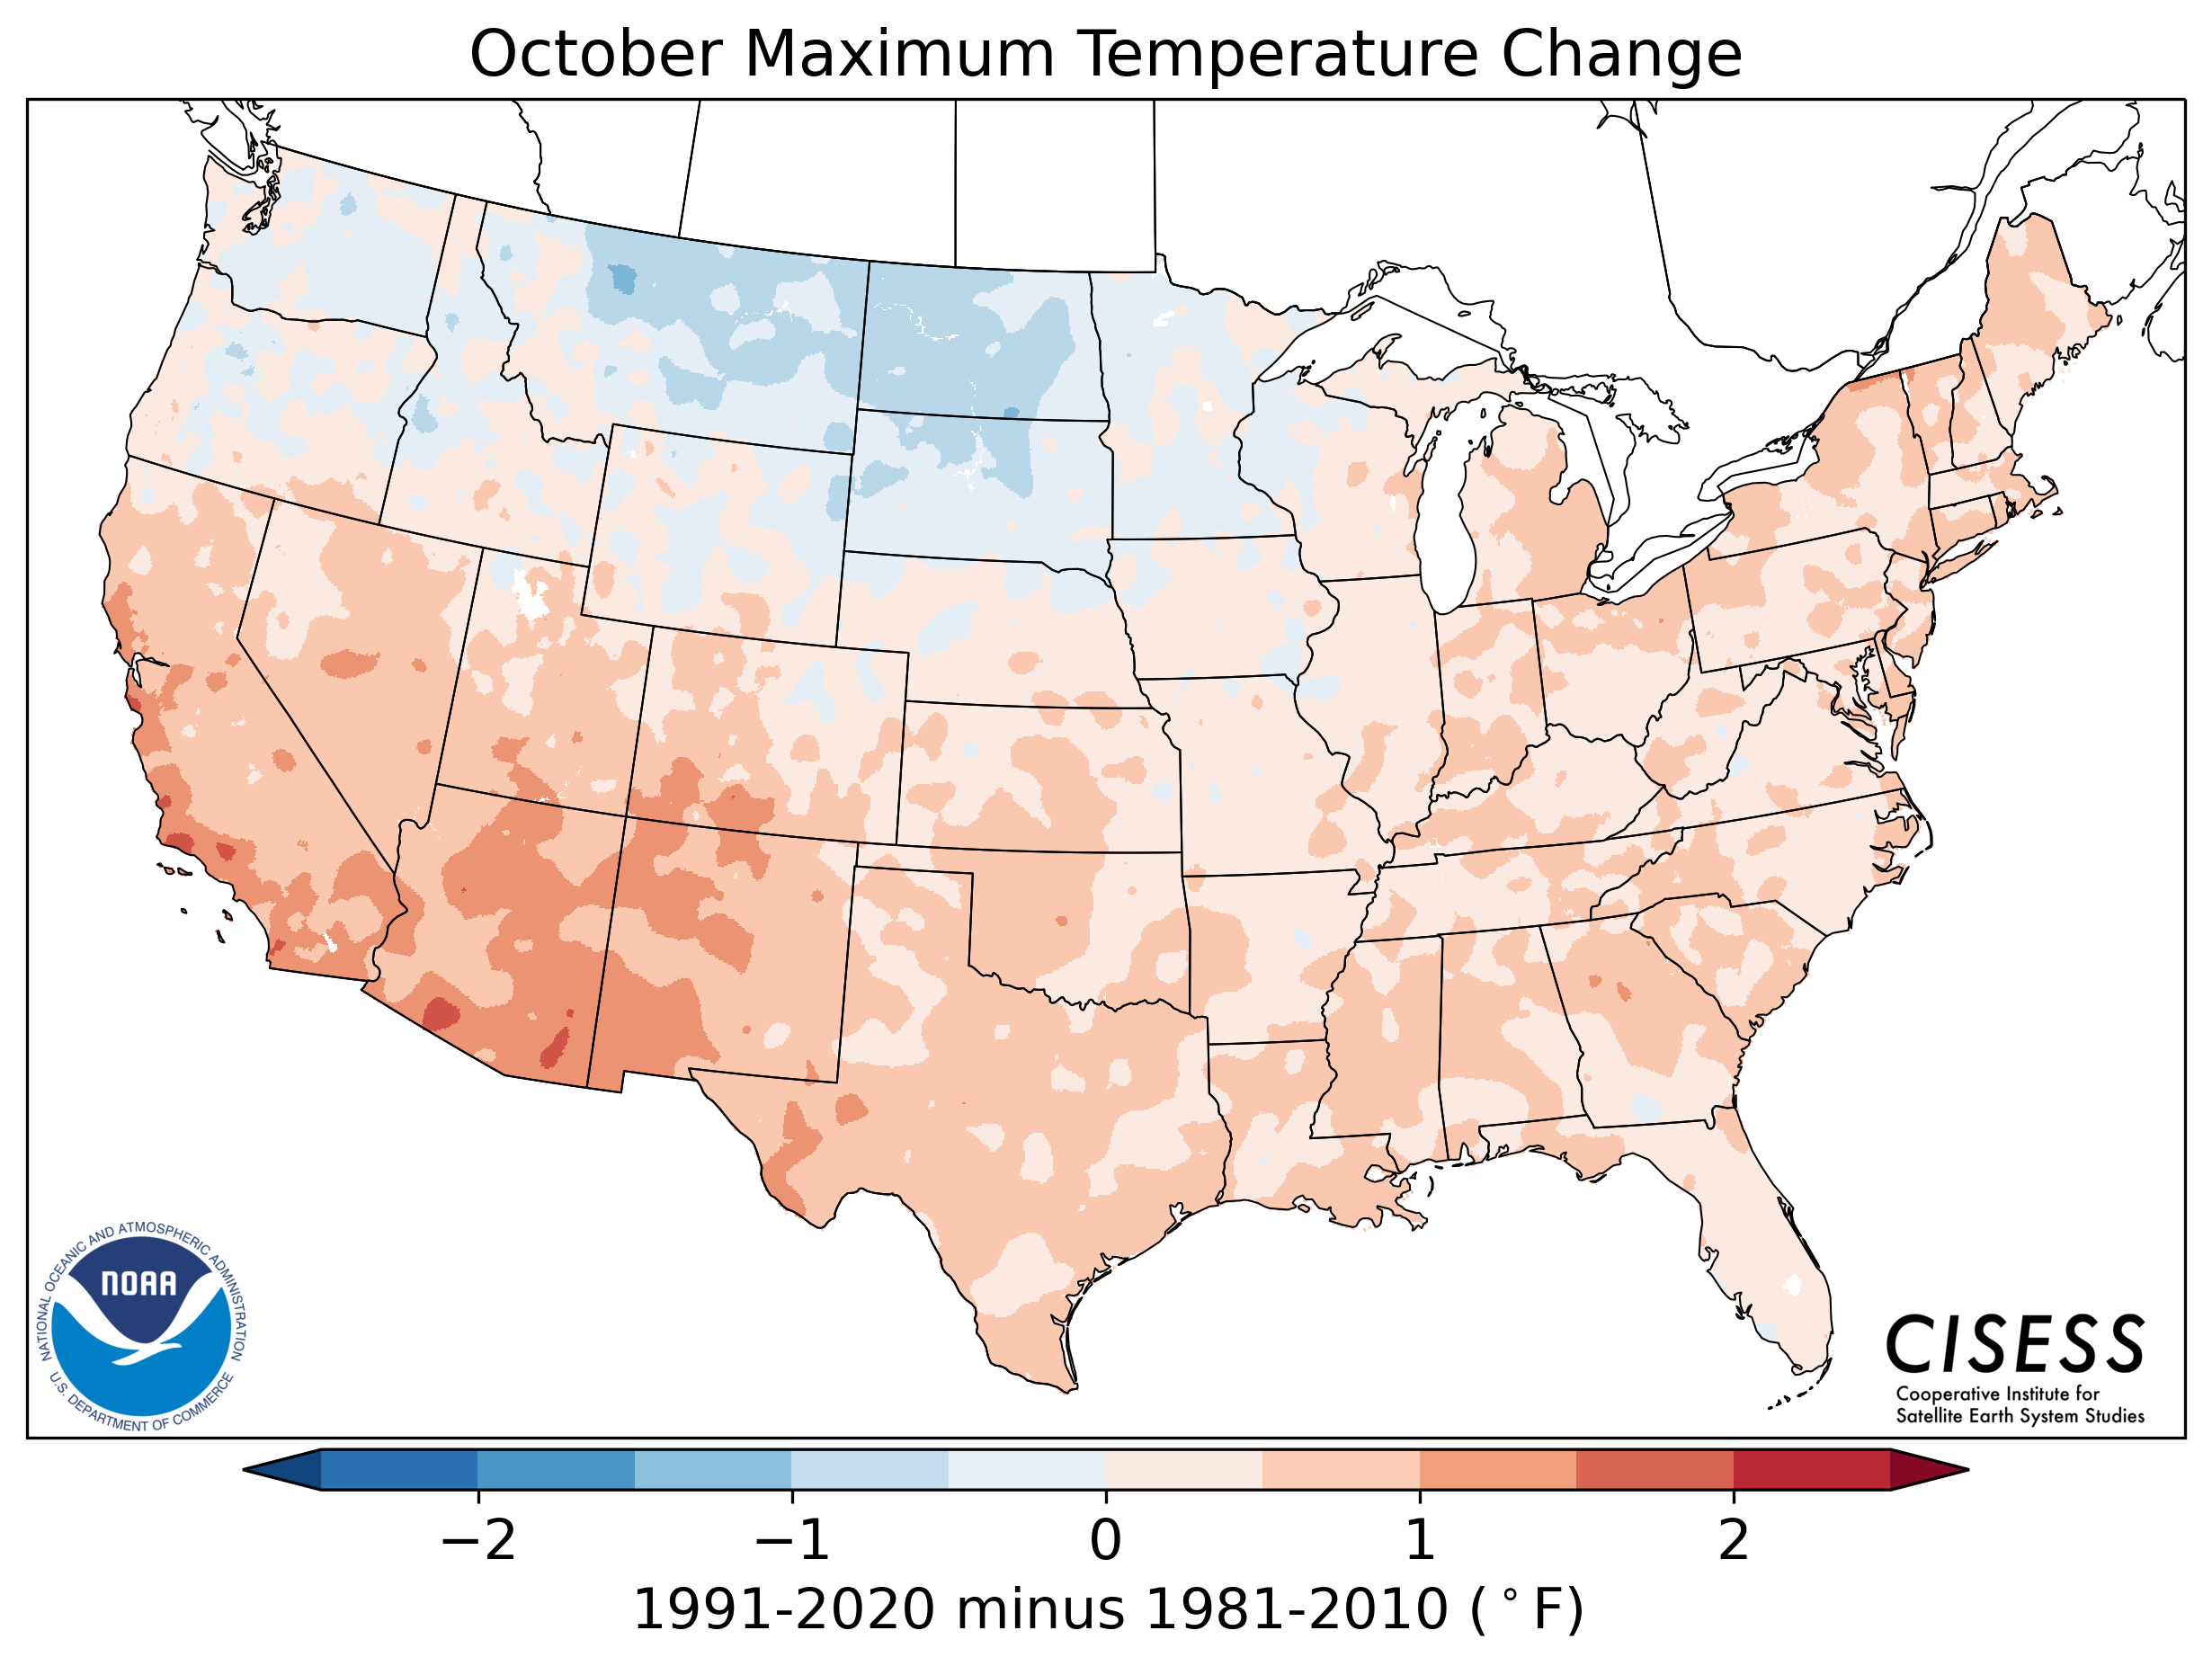
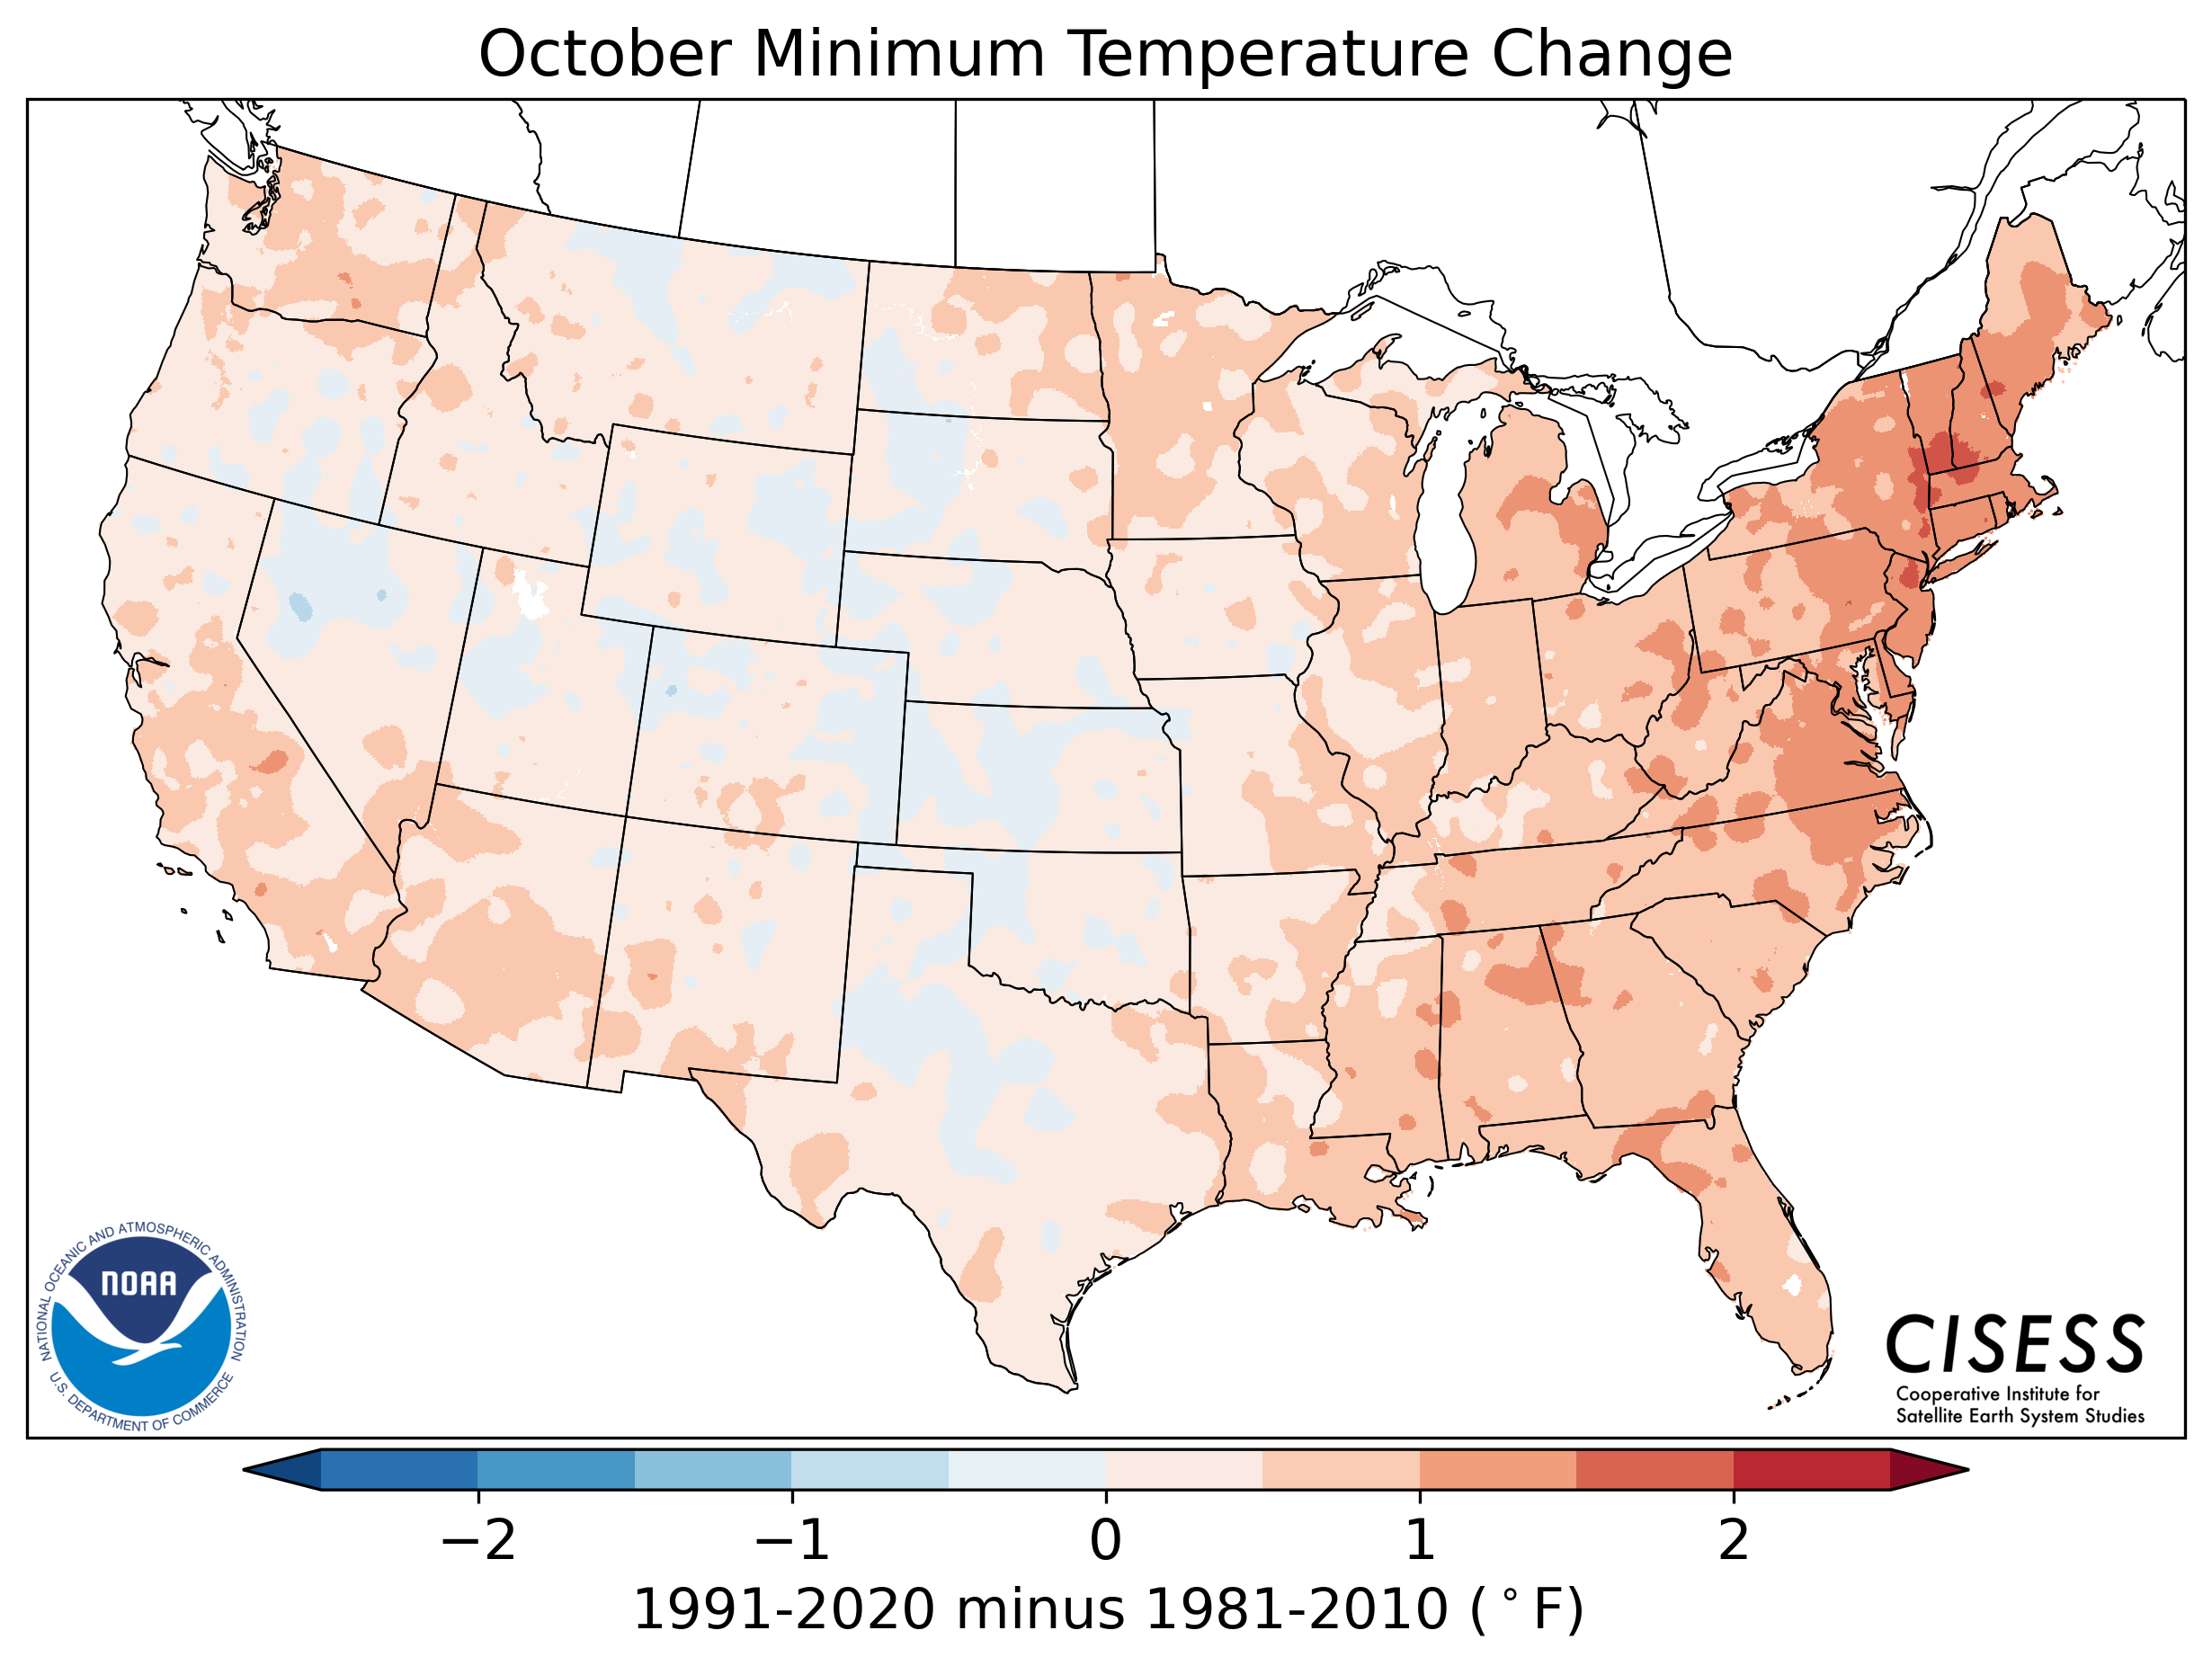
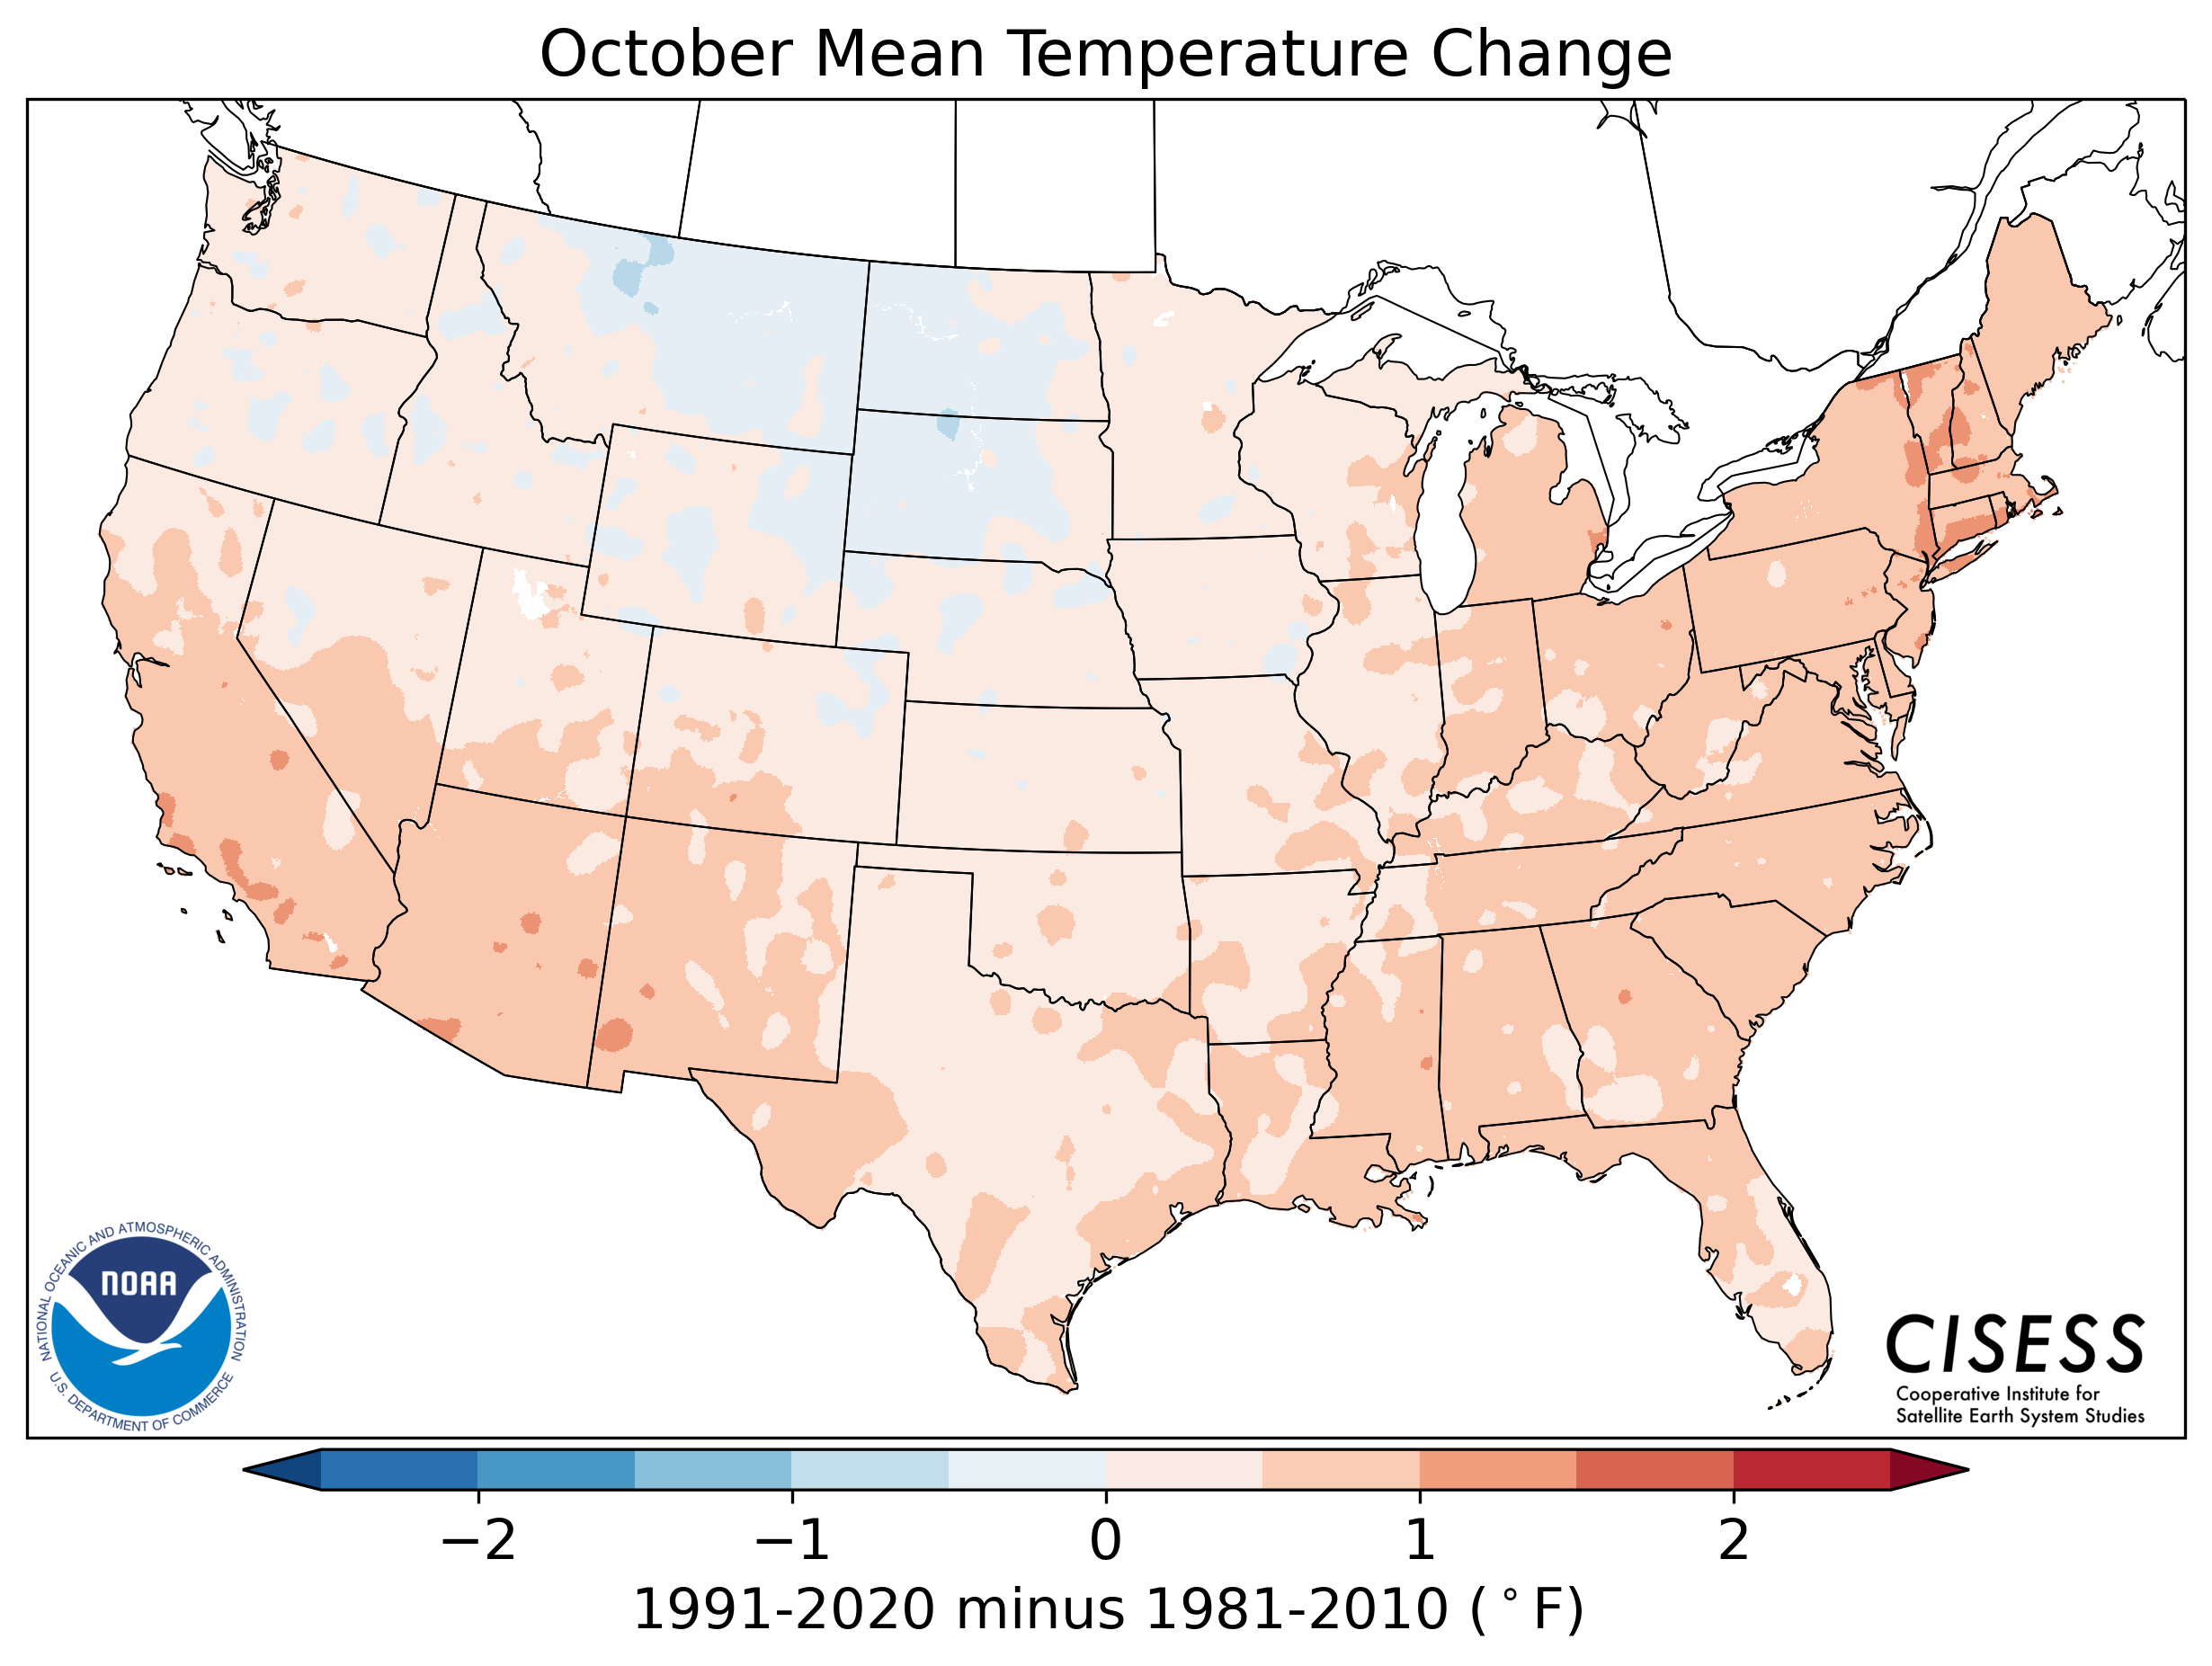
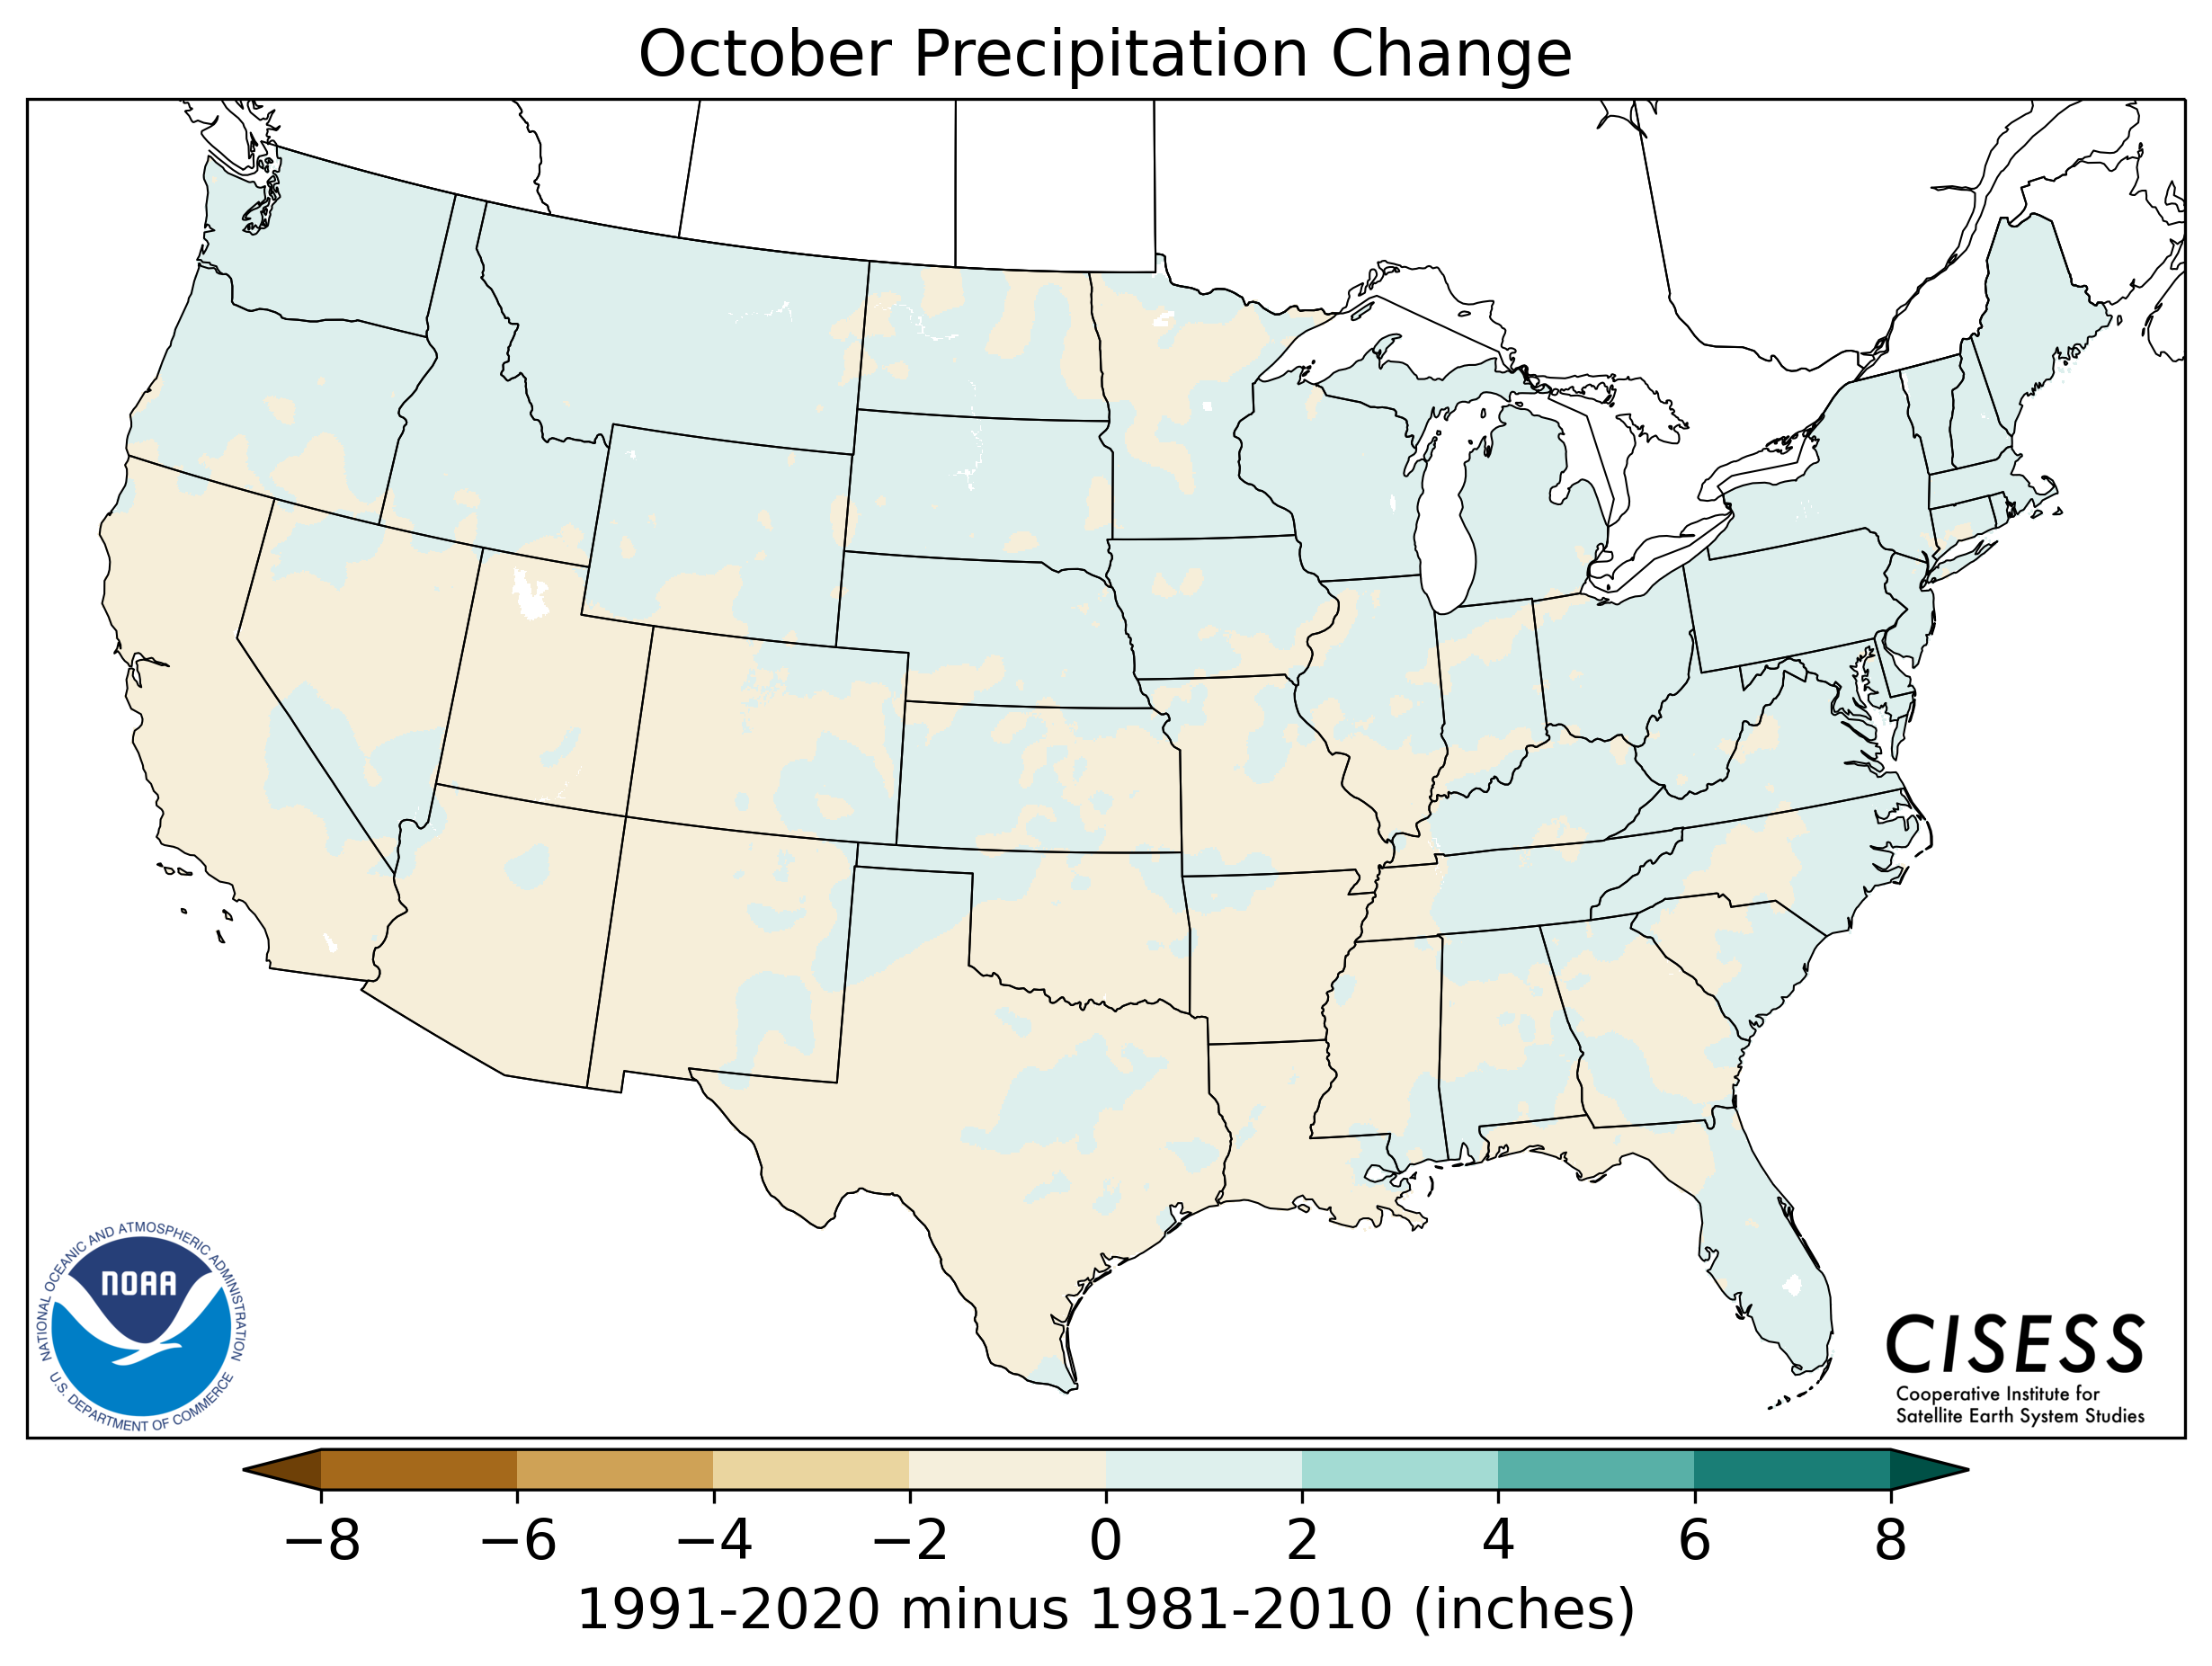
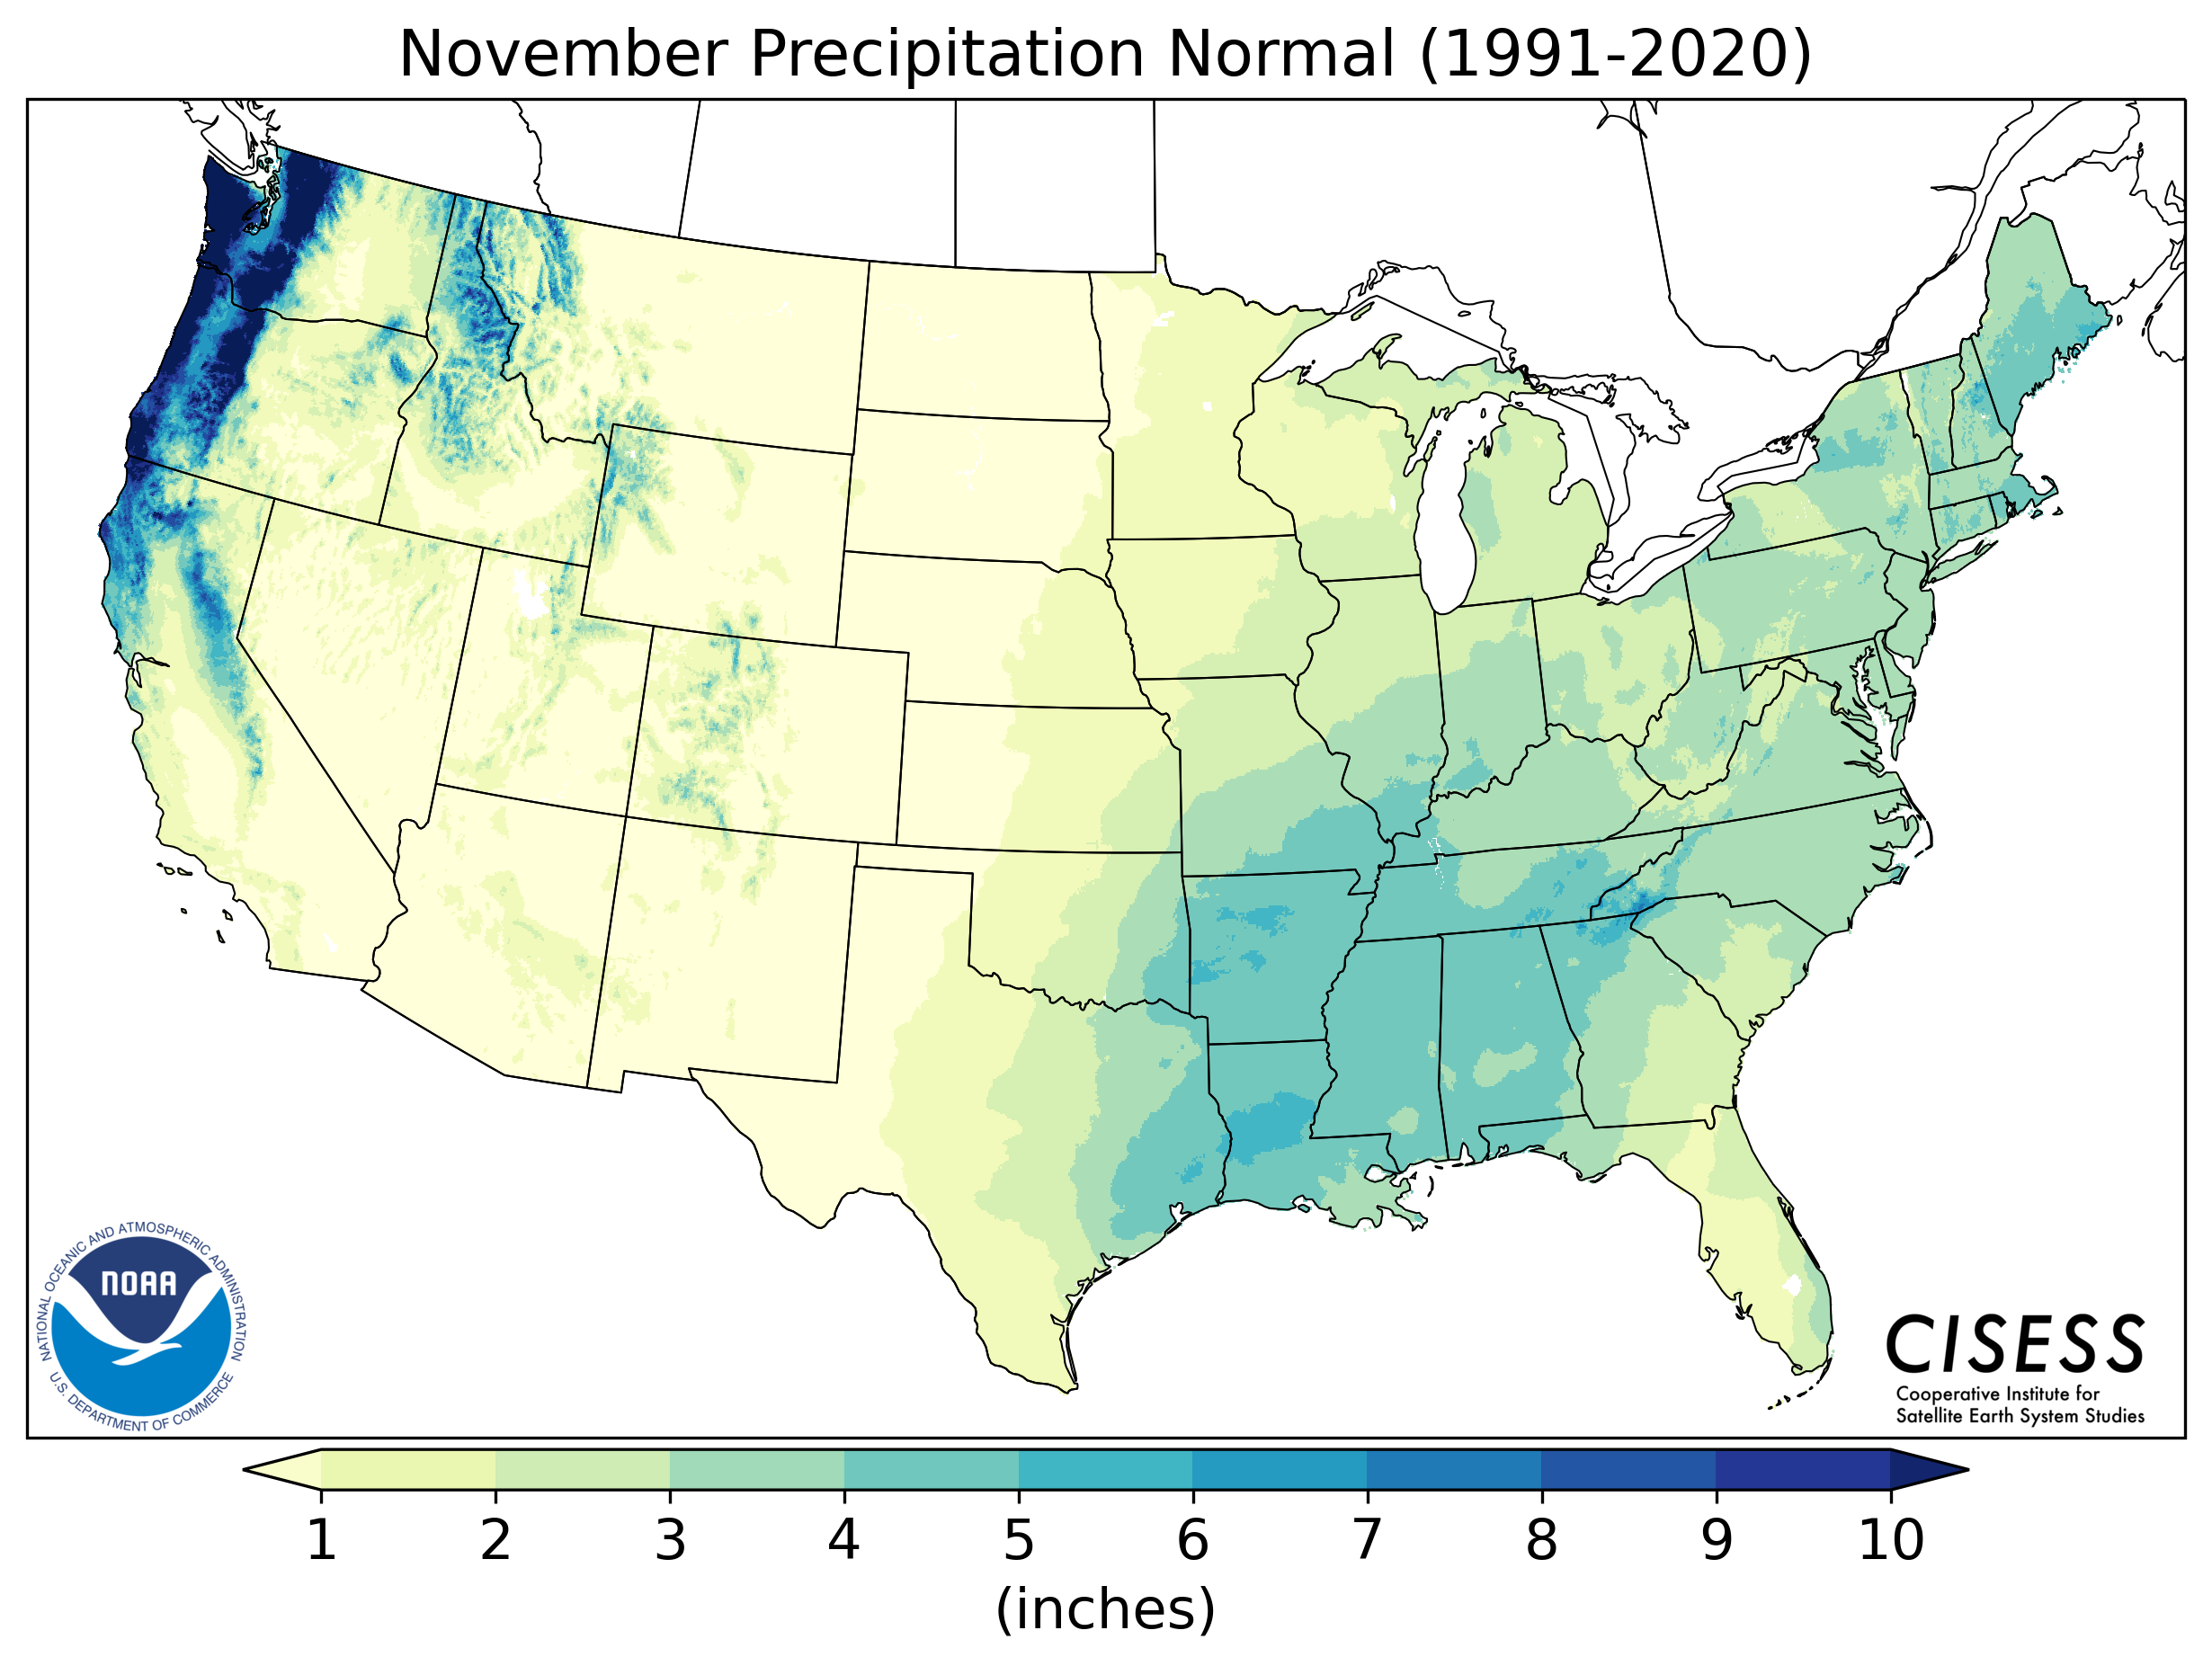
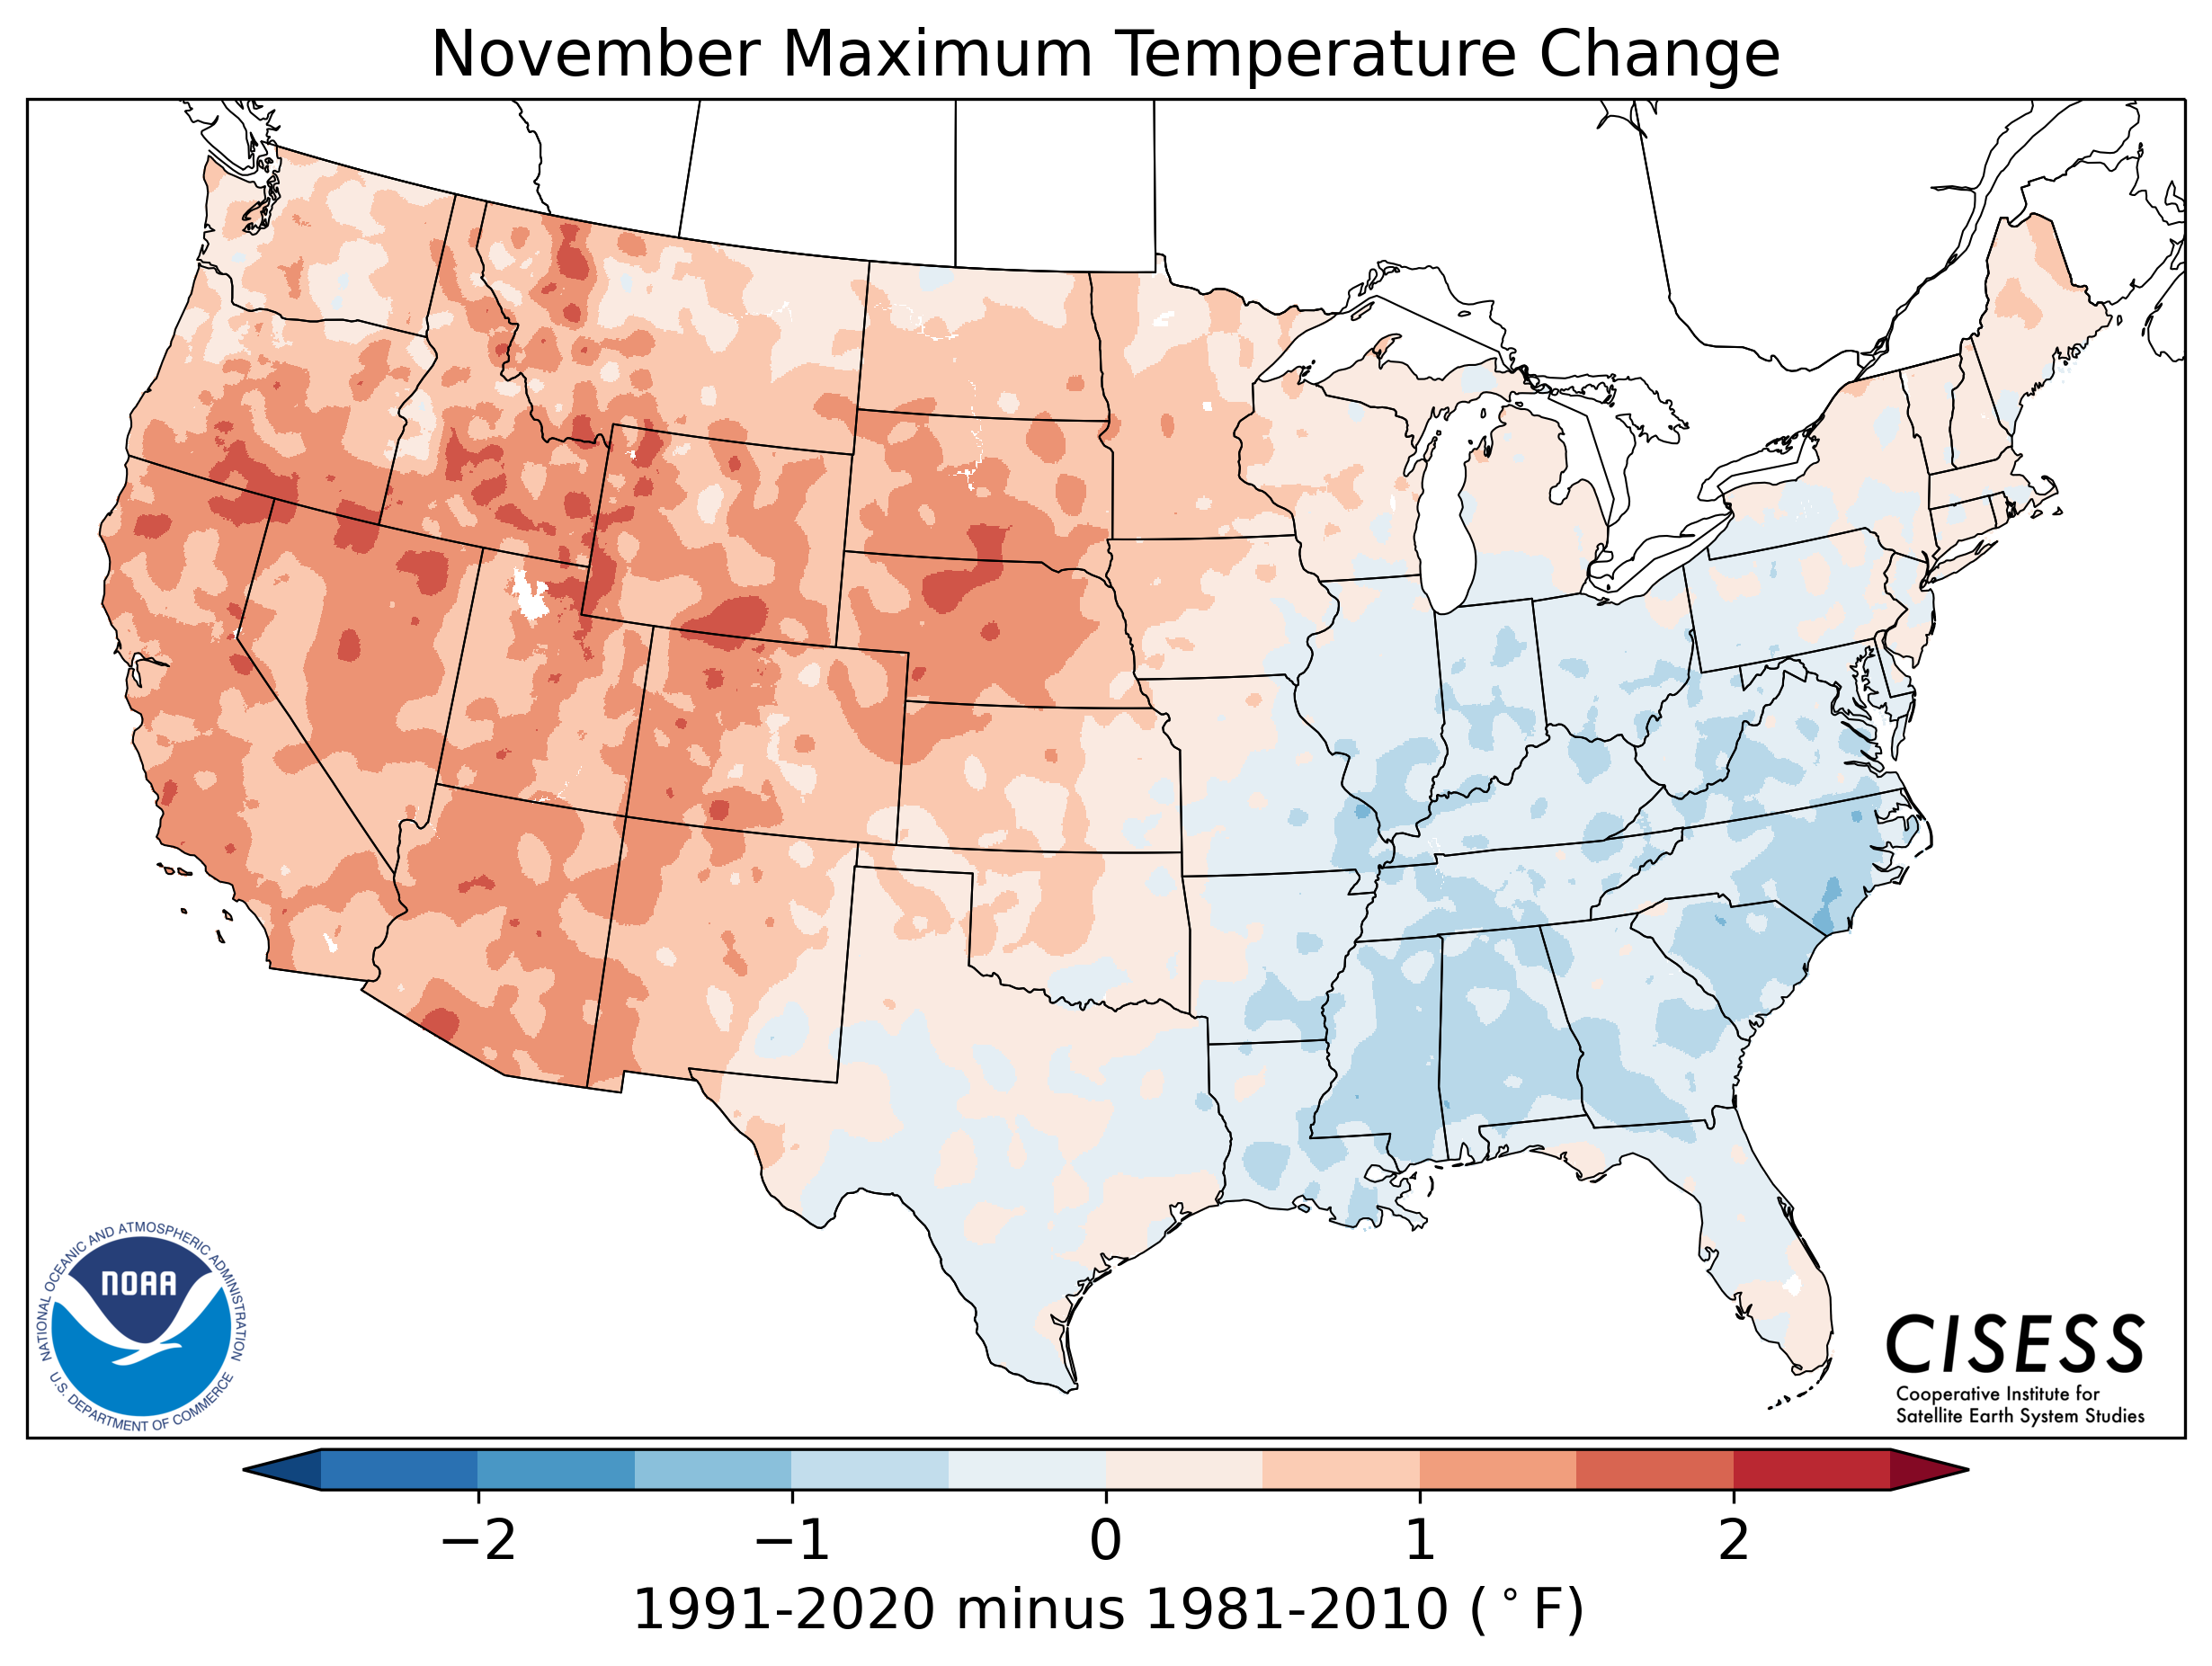
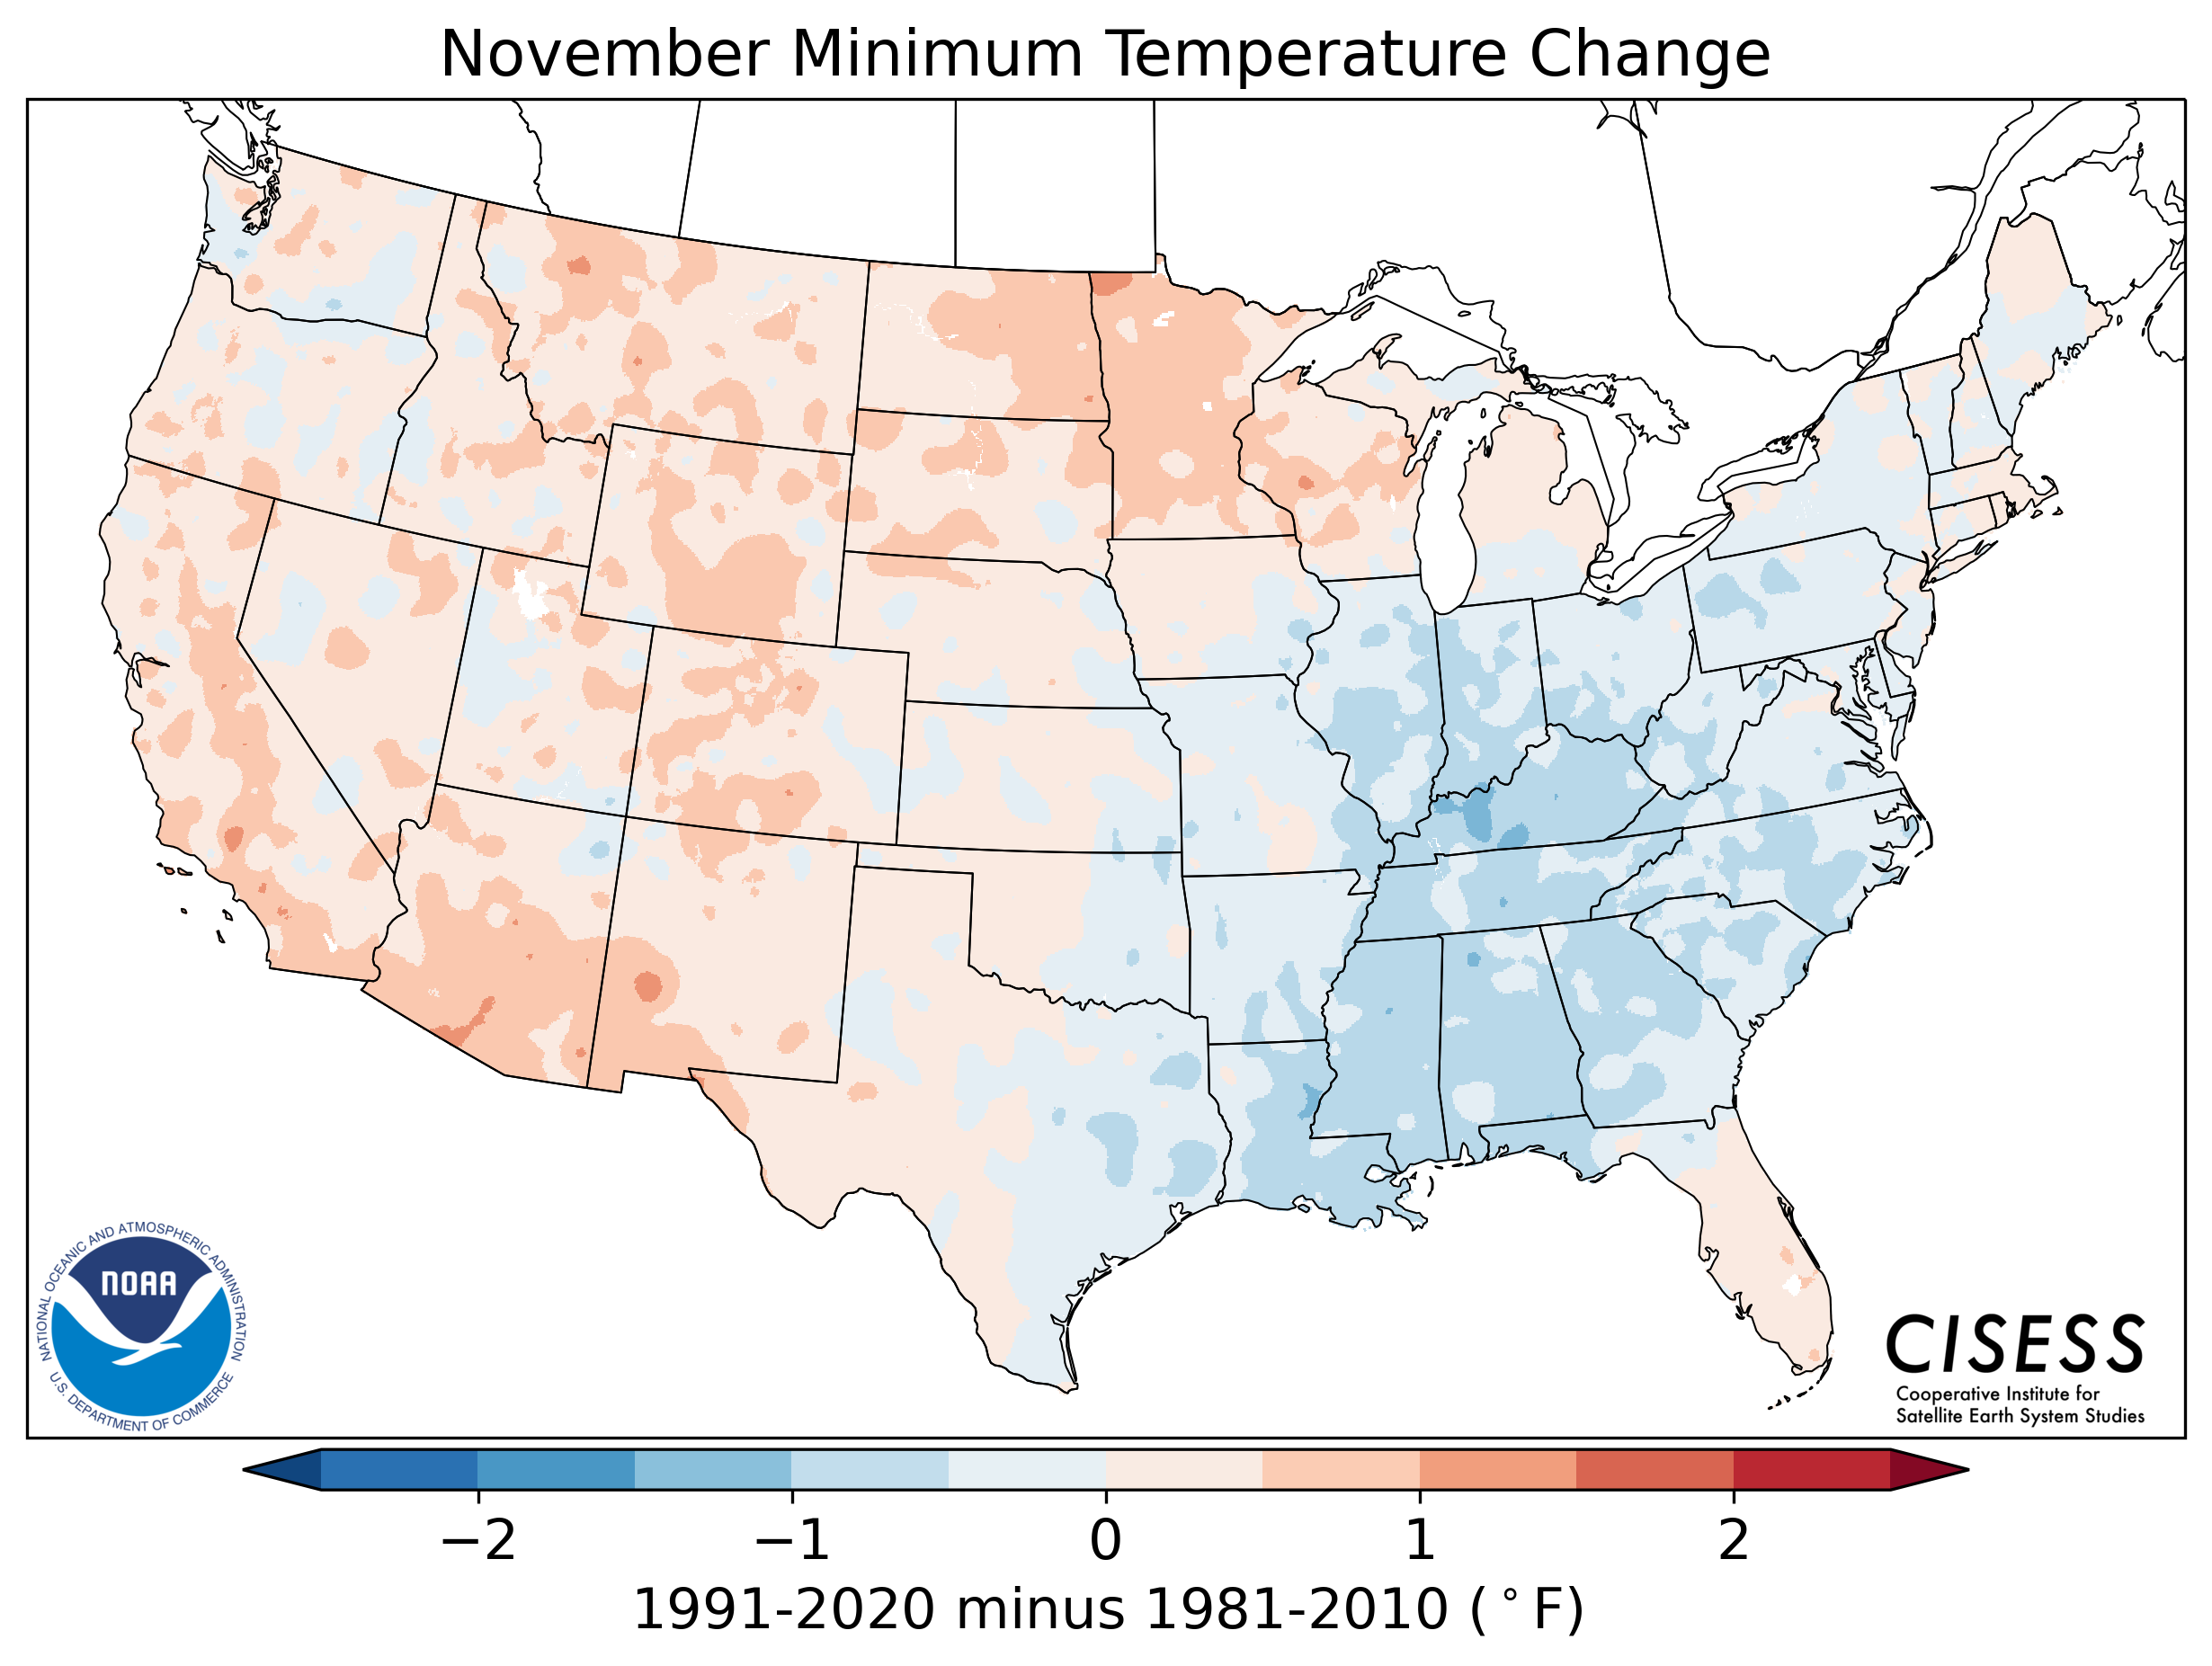
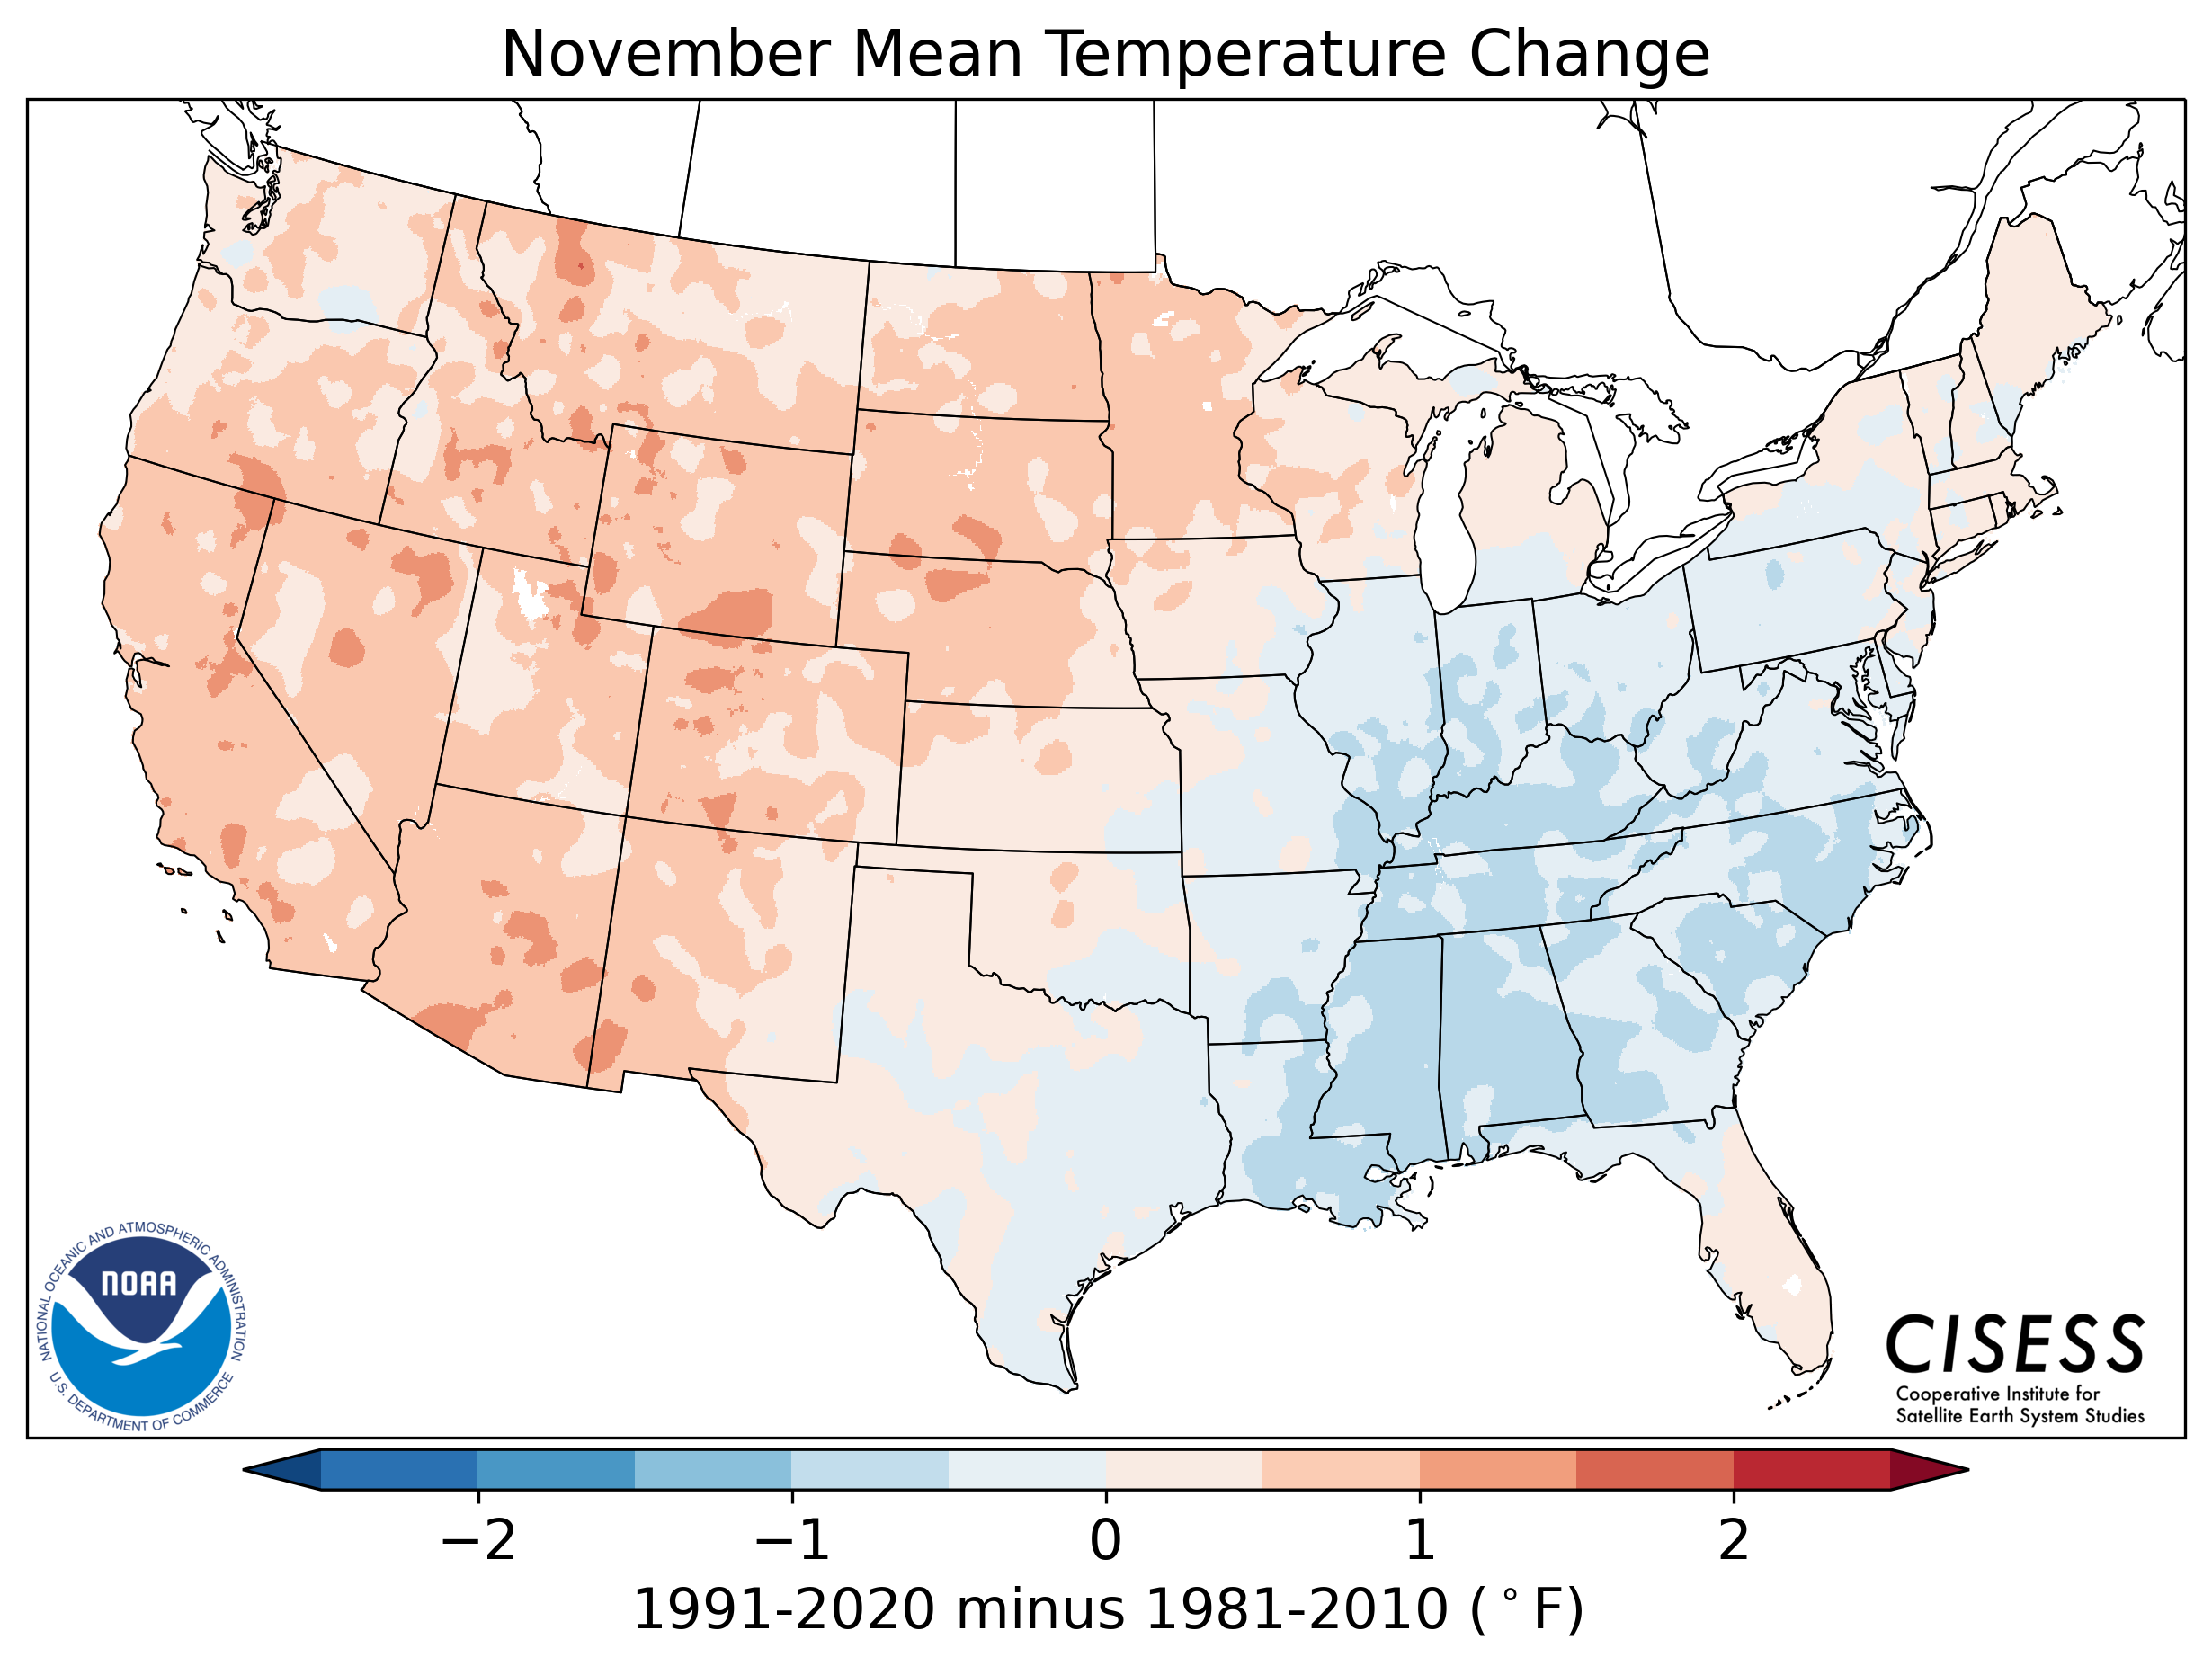
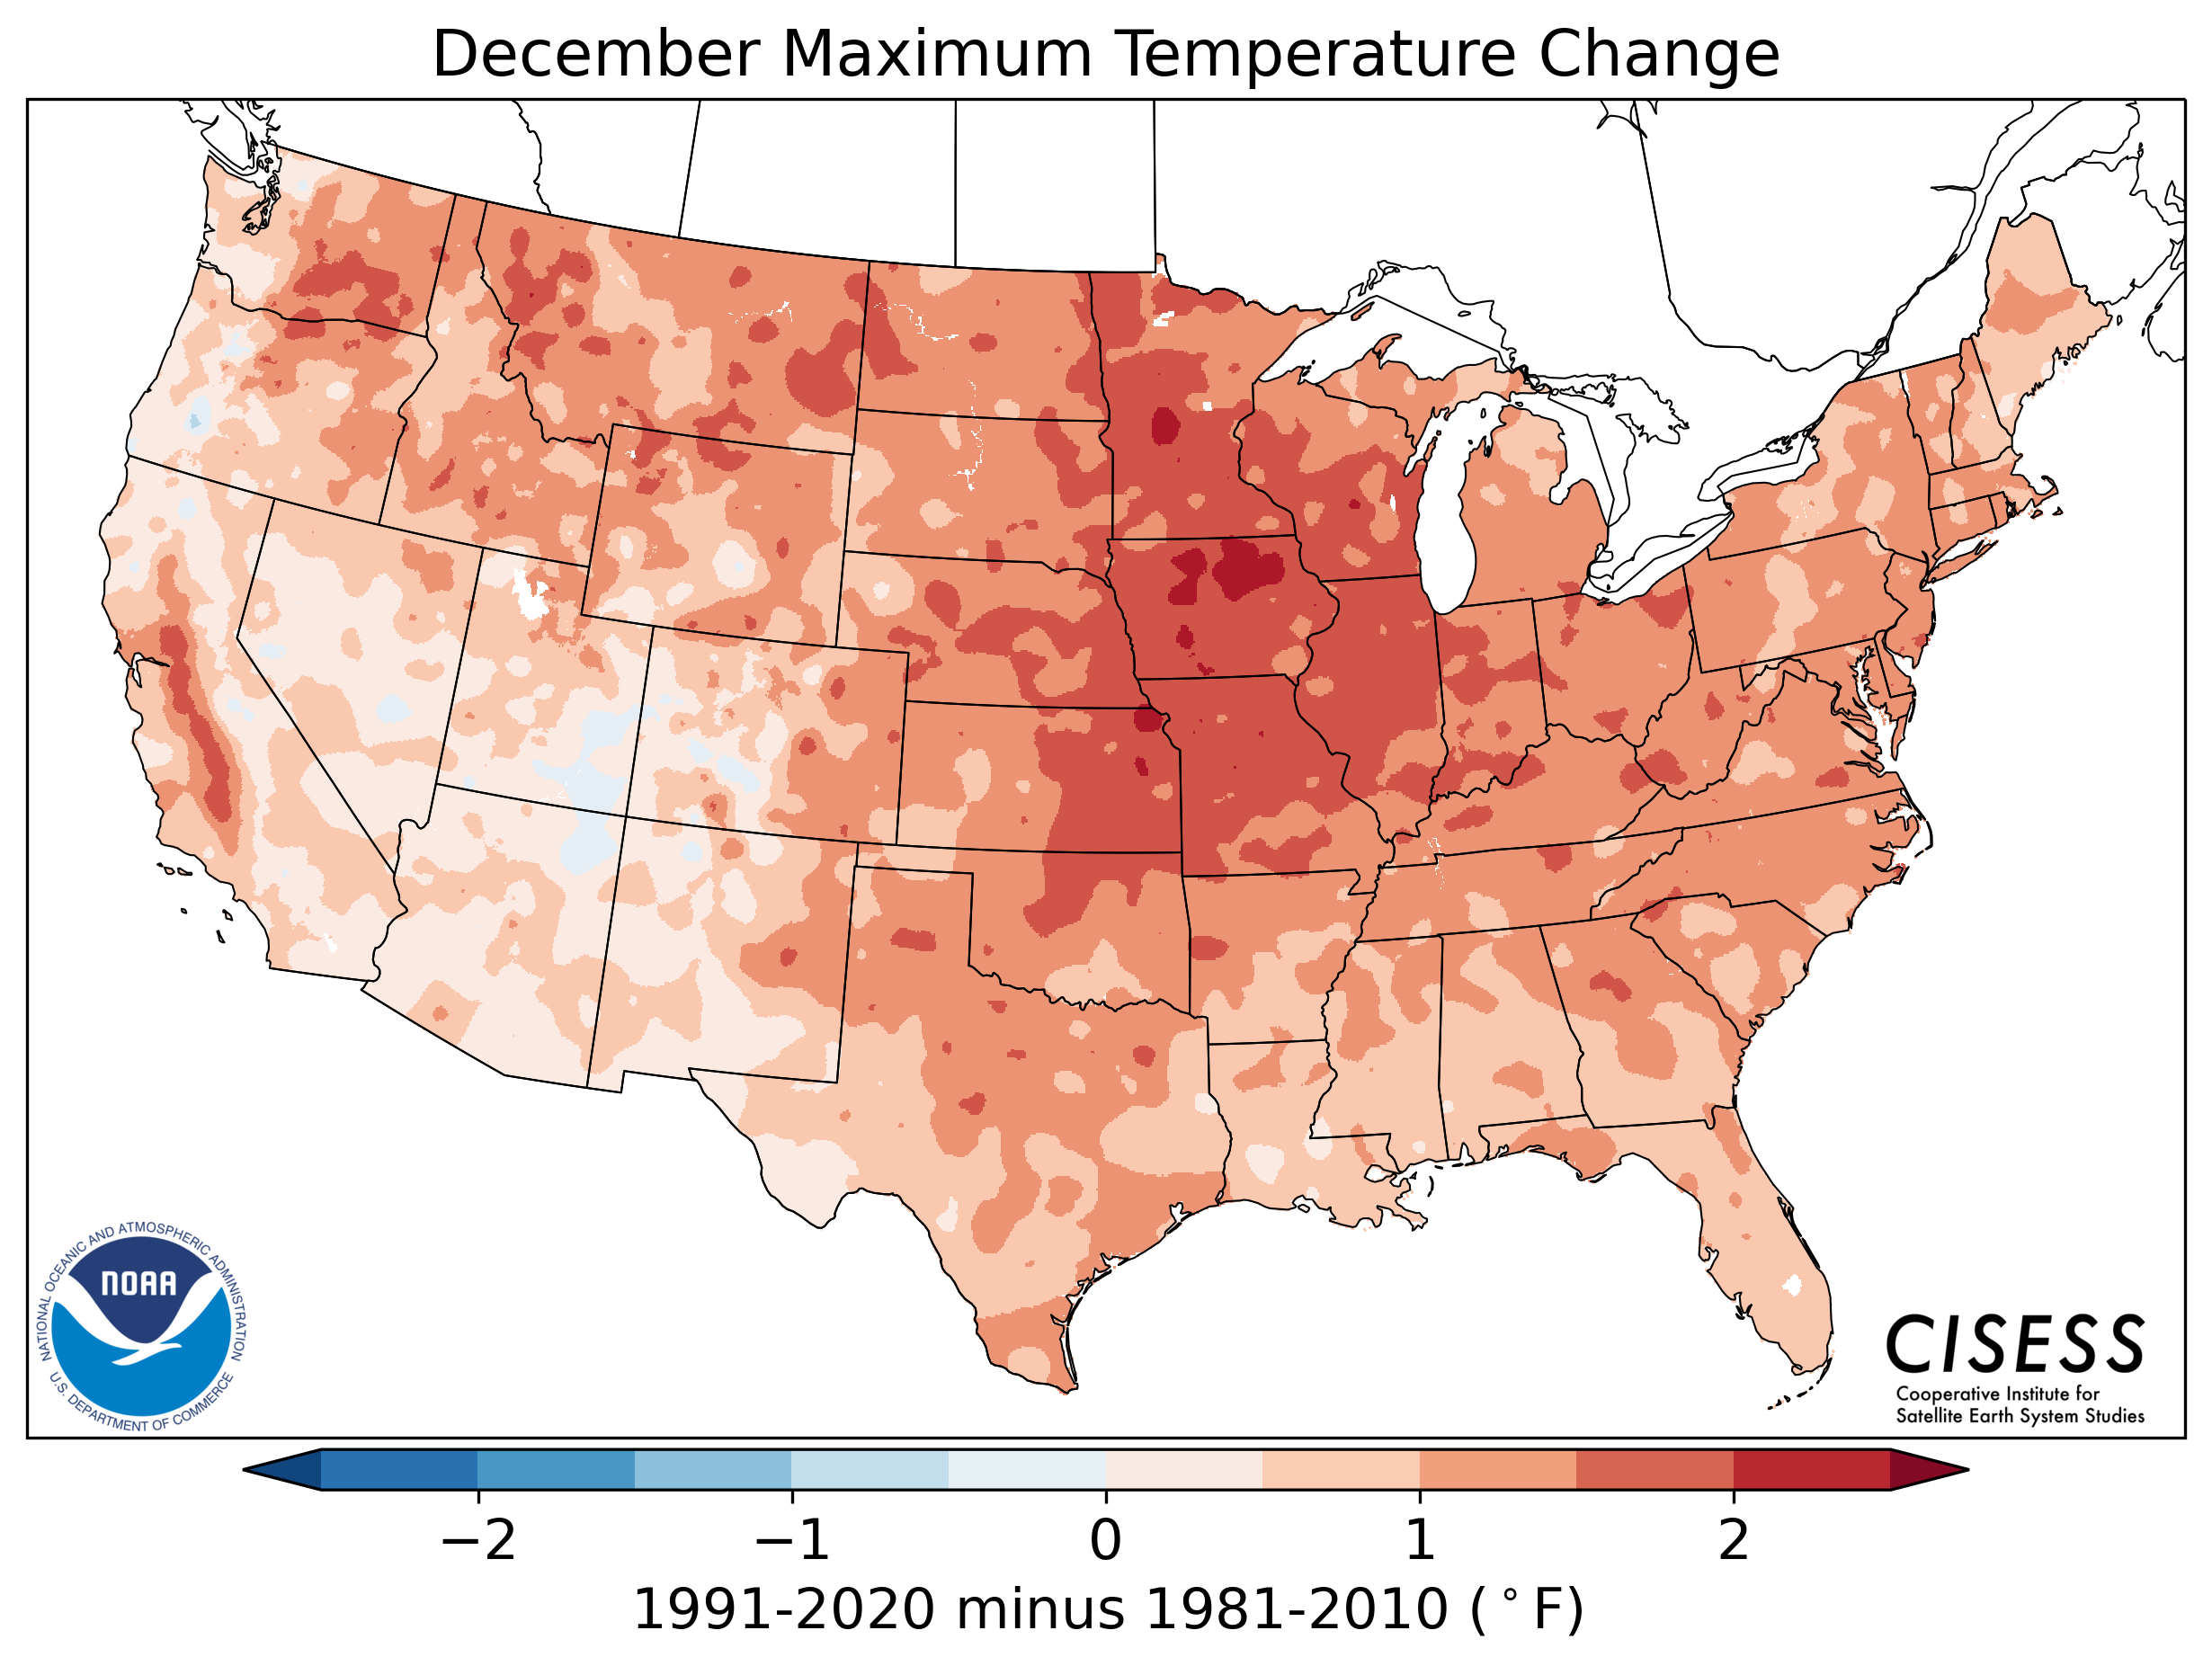
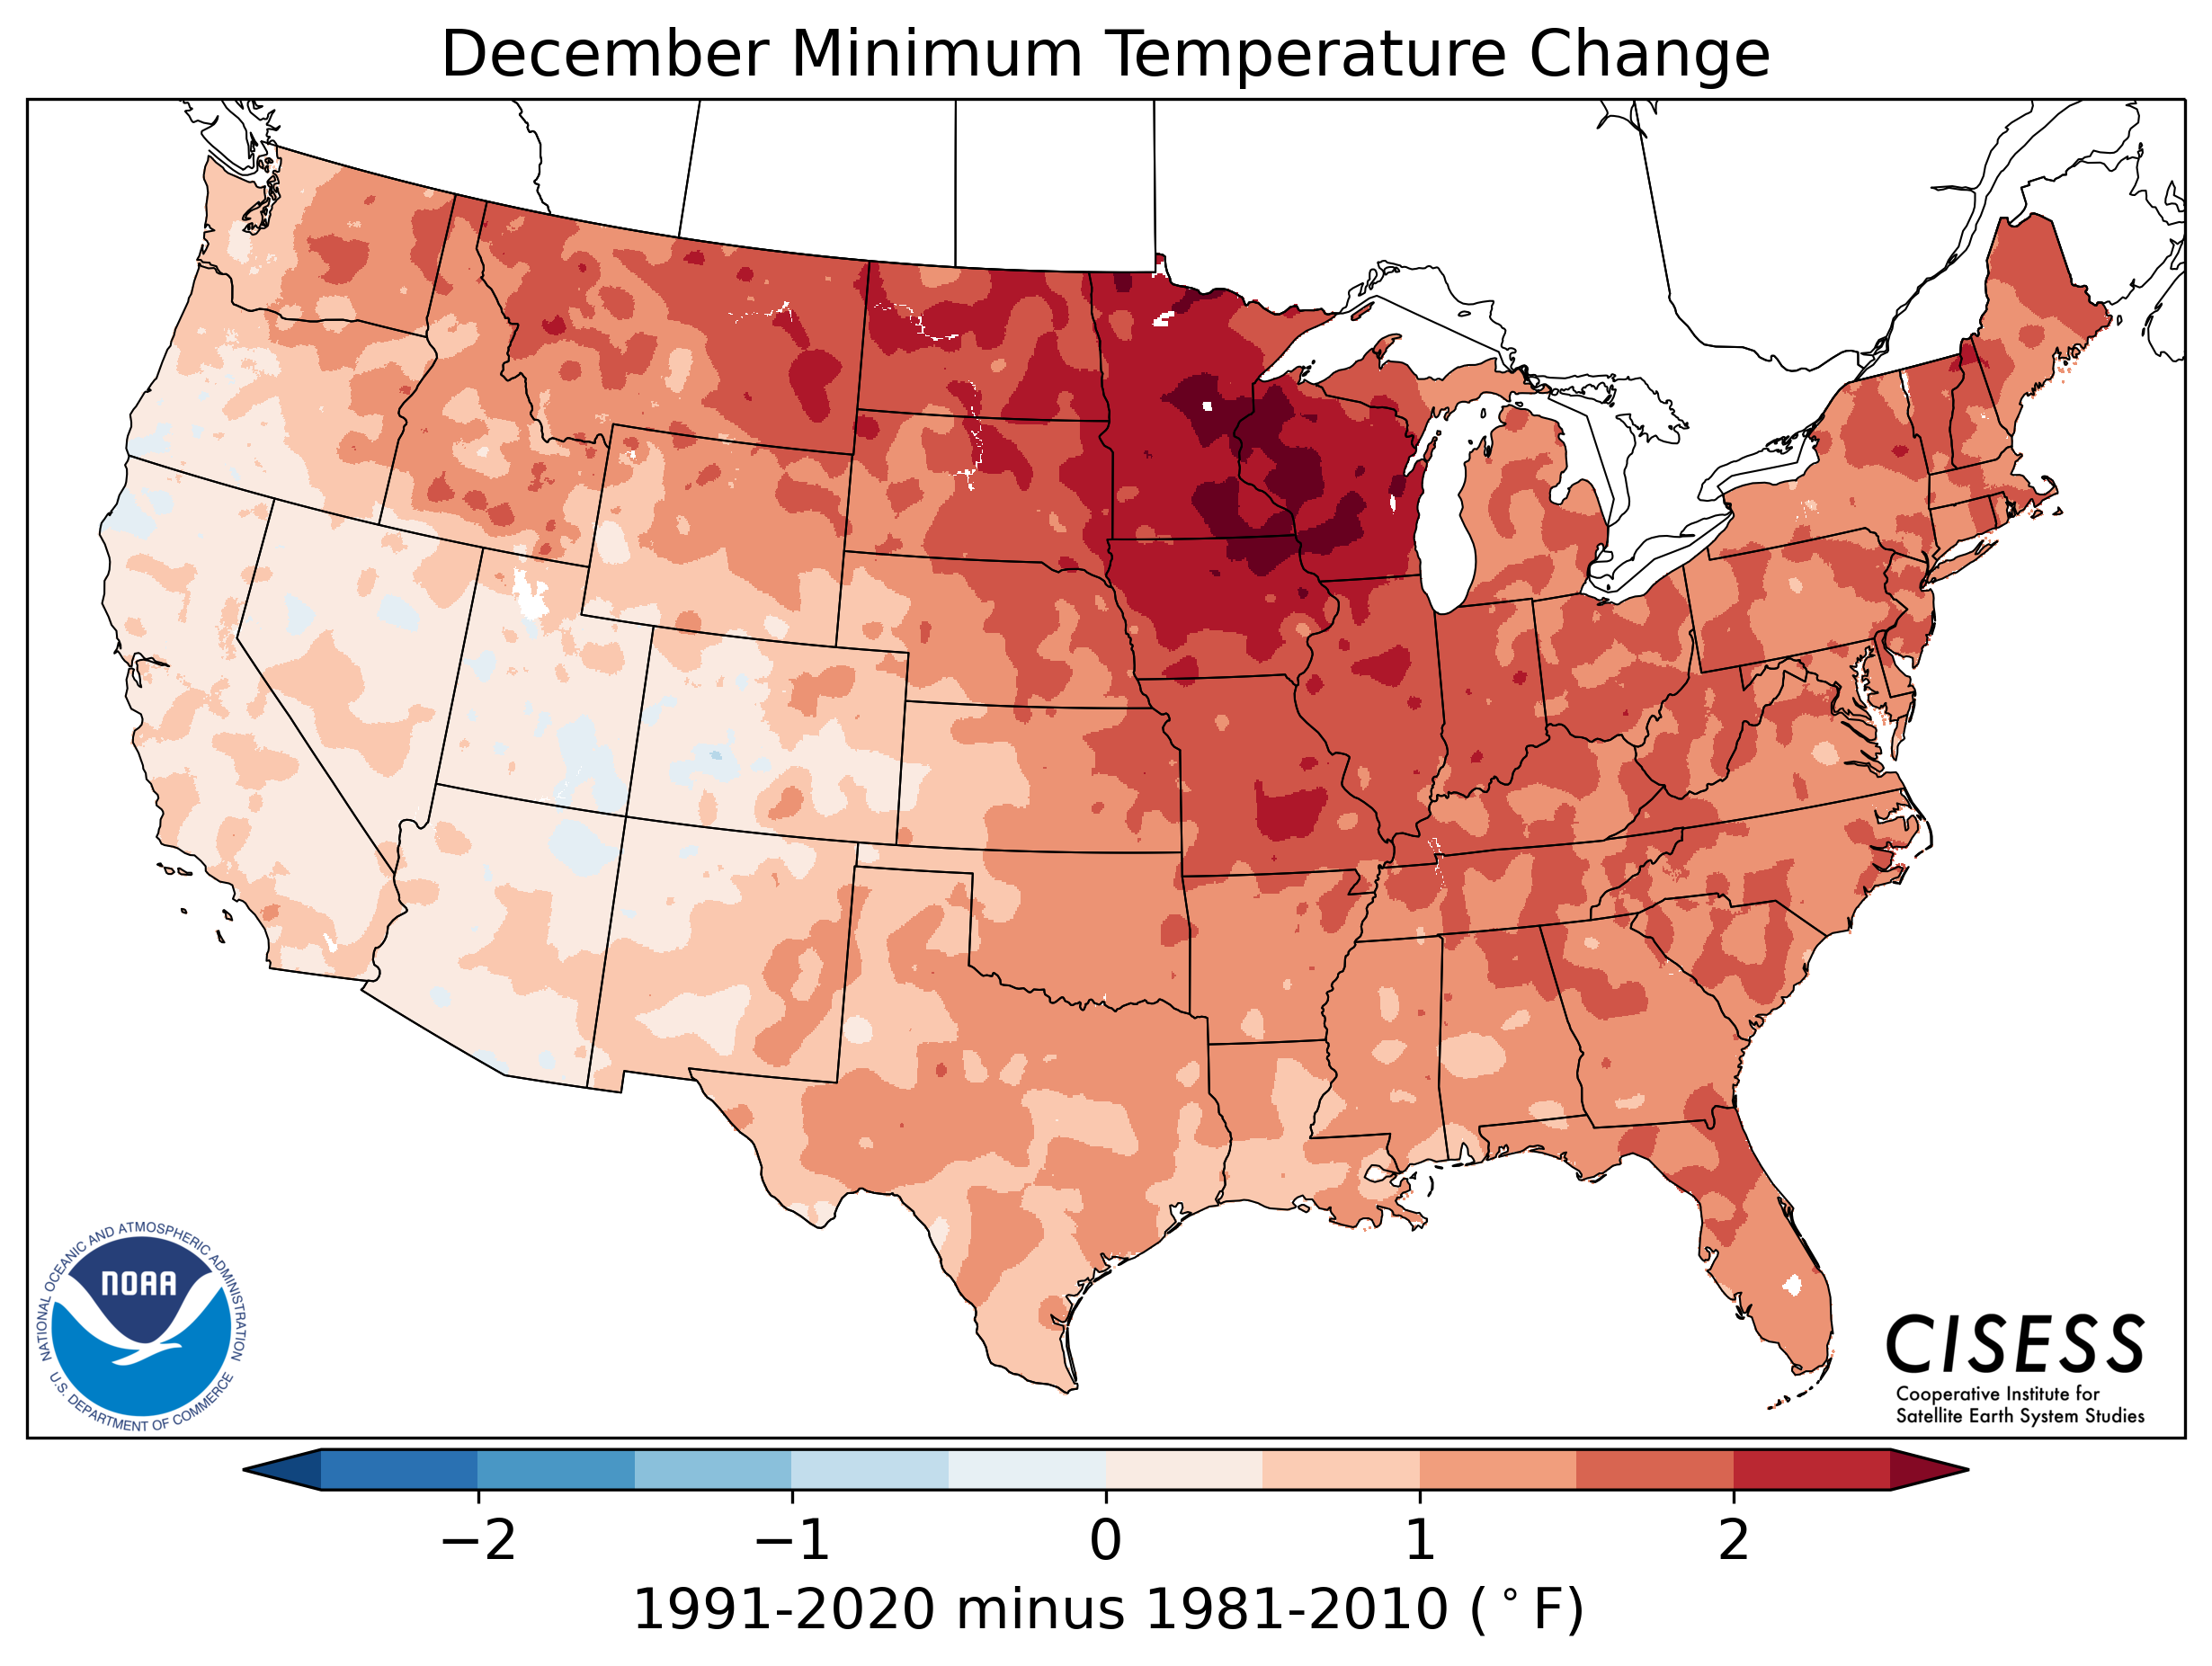
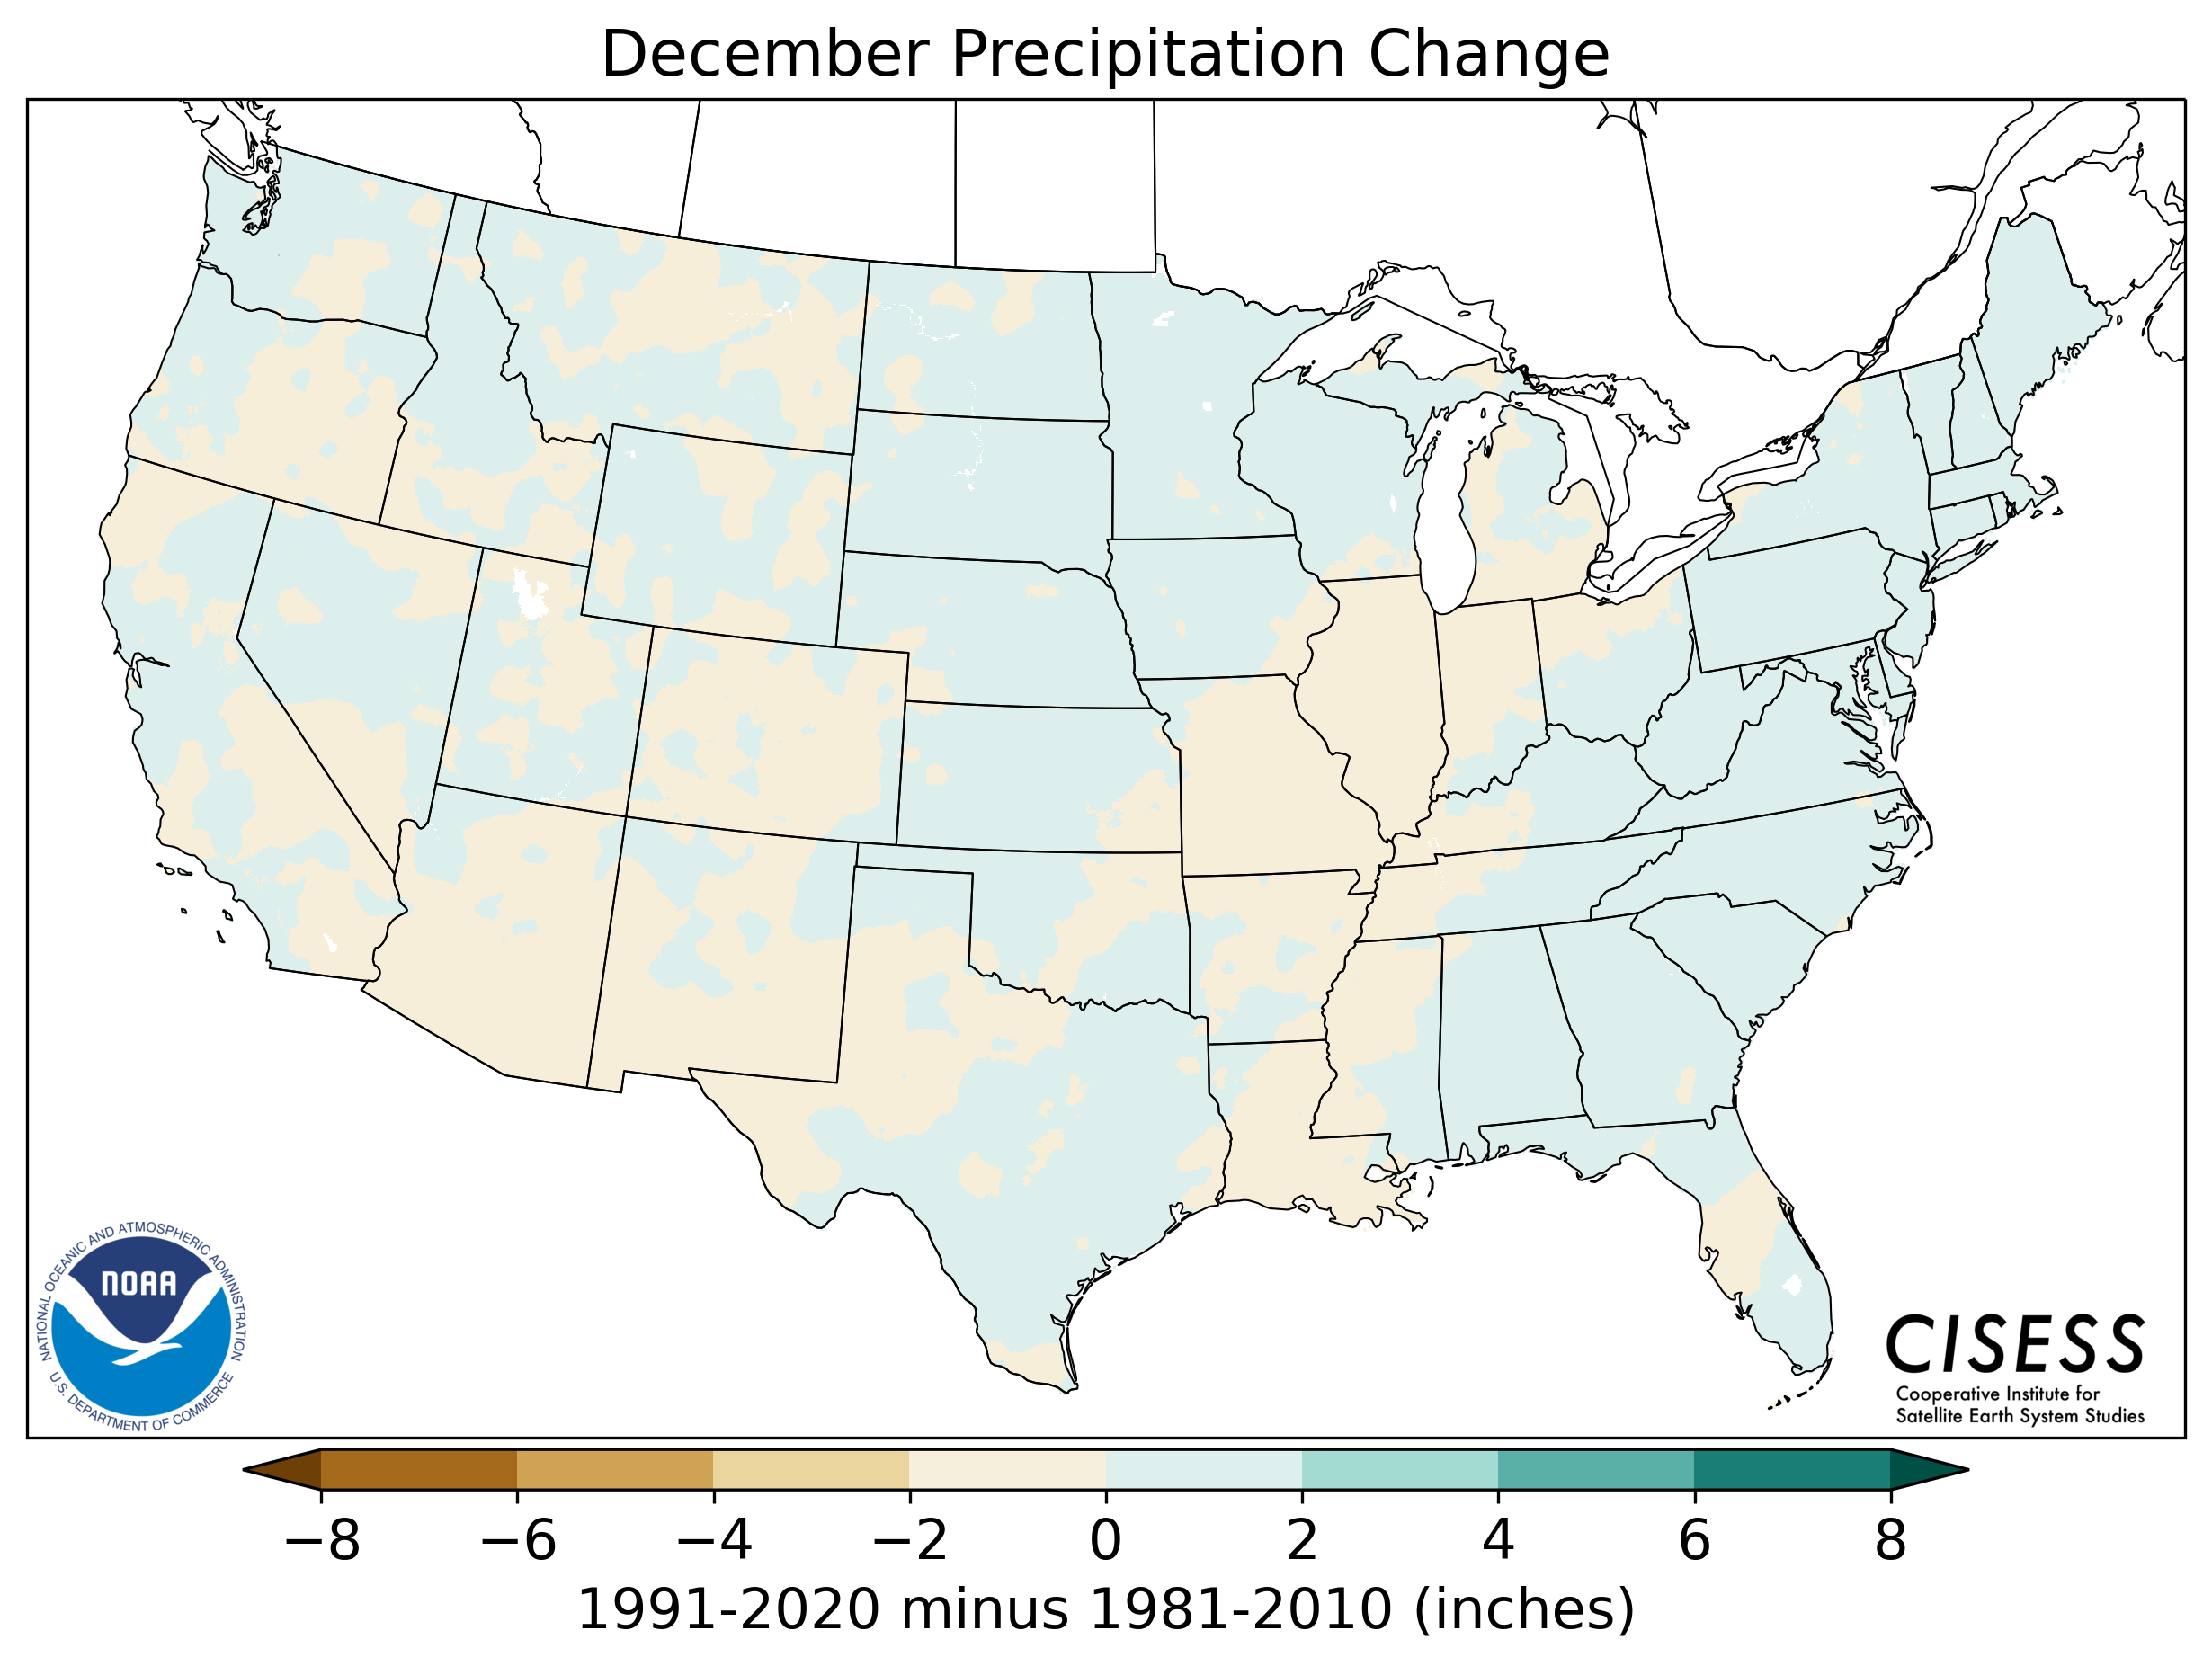
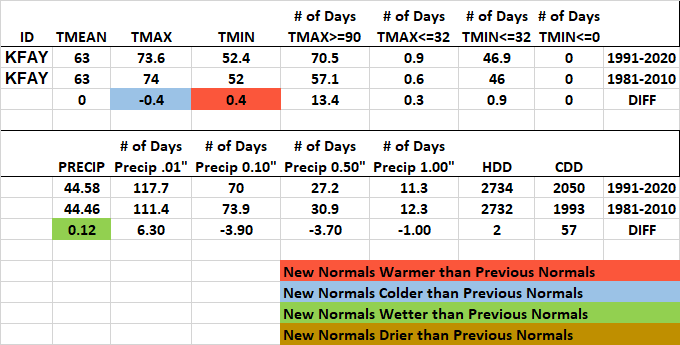
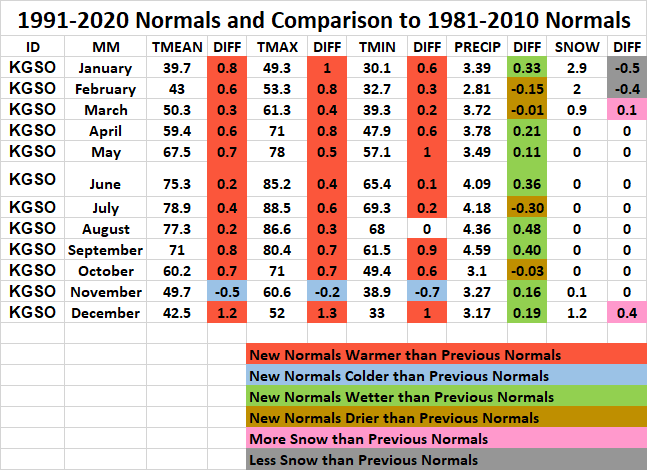
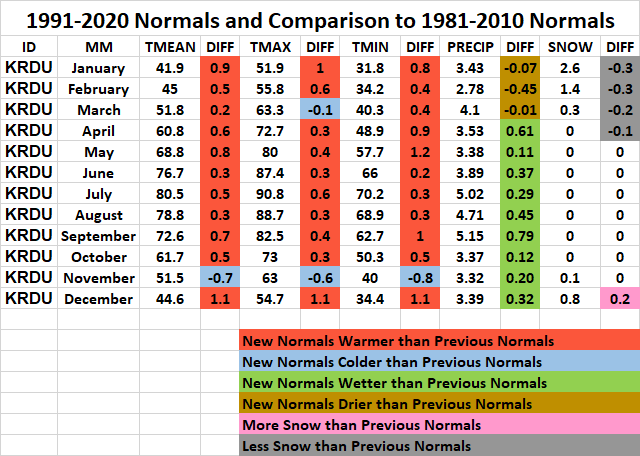
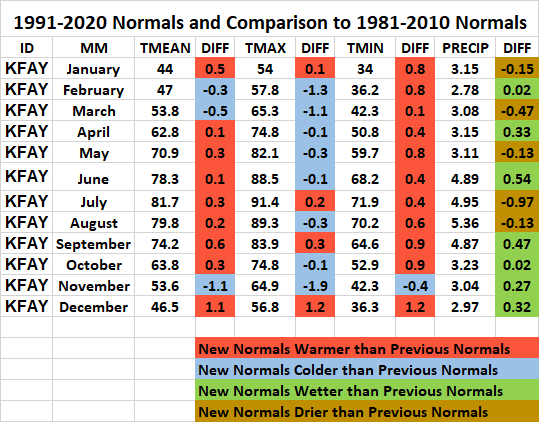
1991-2020 Normals are warmer and wetter everywhere, right? Not everywhere.
The central northern U.S. temperature normals have cooled from 1981-2010 to 1991-2020, especially in the spring. Precipitation normals have become wetter in some areas, especially the Southeast, and drier elsewhere.
/normal_1991-2020-tmax-DJF.png)
/normal_1991-2020-tmin-DJF.png)
/normal_1991-2020-tavg-DJF.png)
/normal_1991-2020-prcp-DJF.png)
/diff1_tmax_DJF_1981-2010_1991-2020.png)
/diff1_tmin_DJF_1981-2010_1991-2020.png)
/diff1_tavg_DJF_1981-2010_1991-2020.png)
/diff2_prcp_DJF_1981-2010_1991-2020.png)
/normal_1991-2020-tmax-MAM.png)
/normal_1991-2020-tmin-MAM.png)
/normal_1991-2020-tavg-MAM.png)
/normal_1991-2020-prcp-MAM.png)
/diff1_tmax_MAM_1981-2010_1991-2020.png)
/diff1_tmin_MAM_1981-2010_1991-2020.png)
/diff1_tavg_MAM_1981-2010_1991-2020.png)
/diff2_prcp_MAM_1981-2010_1991-2020.png)
/normal_1991-2020-tmax-JJA.png)
/normal_1991-2020-tmin-JJA.png)
/normal_1991-2020-tavg-JJA.png)
/normal_1991-2020-prcp-JJA.png)
/diff1_tmax_JJA_1981-2010_1991-2020.png)
/diff1_tmin_JJA_1981-2010_1991-2020.png)
/diff1_tavg_JJA_1981-2010_1991-2020.png)
/diff2_prcp_JJA_1981-2010_1991-2020.png)
/normal_1991-2020-tmax-SON.png)
/normal_1991-2020-tmin-SON.png)
/normal_1991-2020-tavg-SON.png)
/normal_1991-2020-prcp-SON.png)
/diff1_tmax_SON_1981-2010_1991-2020.png)
/diff1_tmin_SON_1981-2010_1991-2020.png)
/diff1_tavg_SON_1981-2010_1991-2020.png)
/diff2_prcp_SON_1981-2010_1991-2020.png)


 Heat Safety
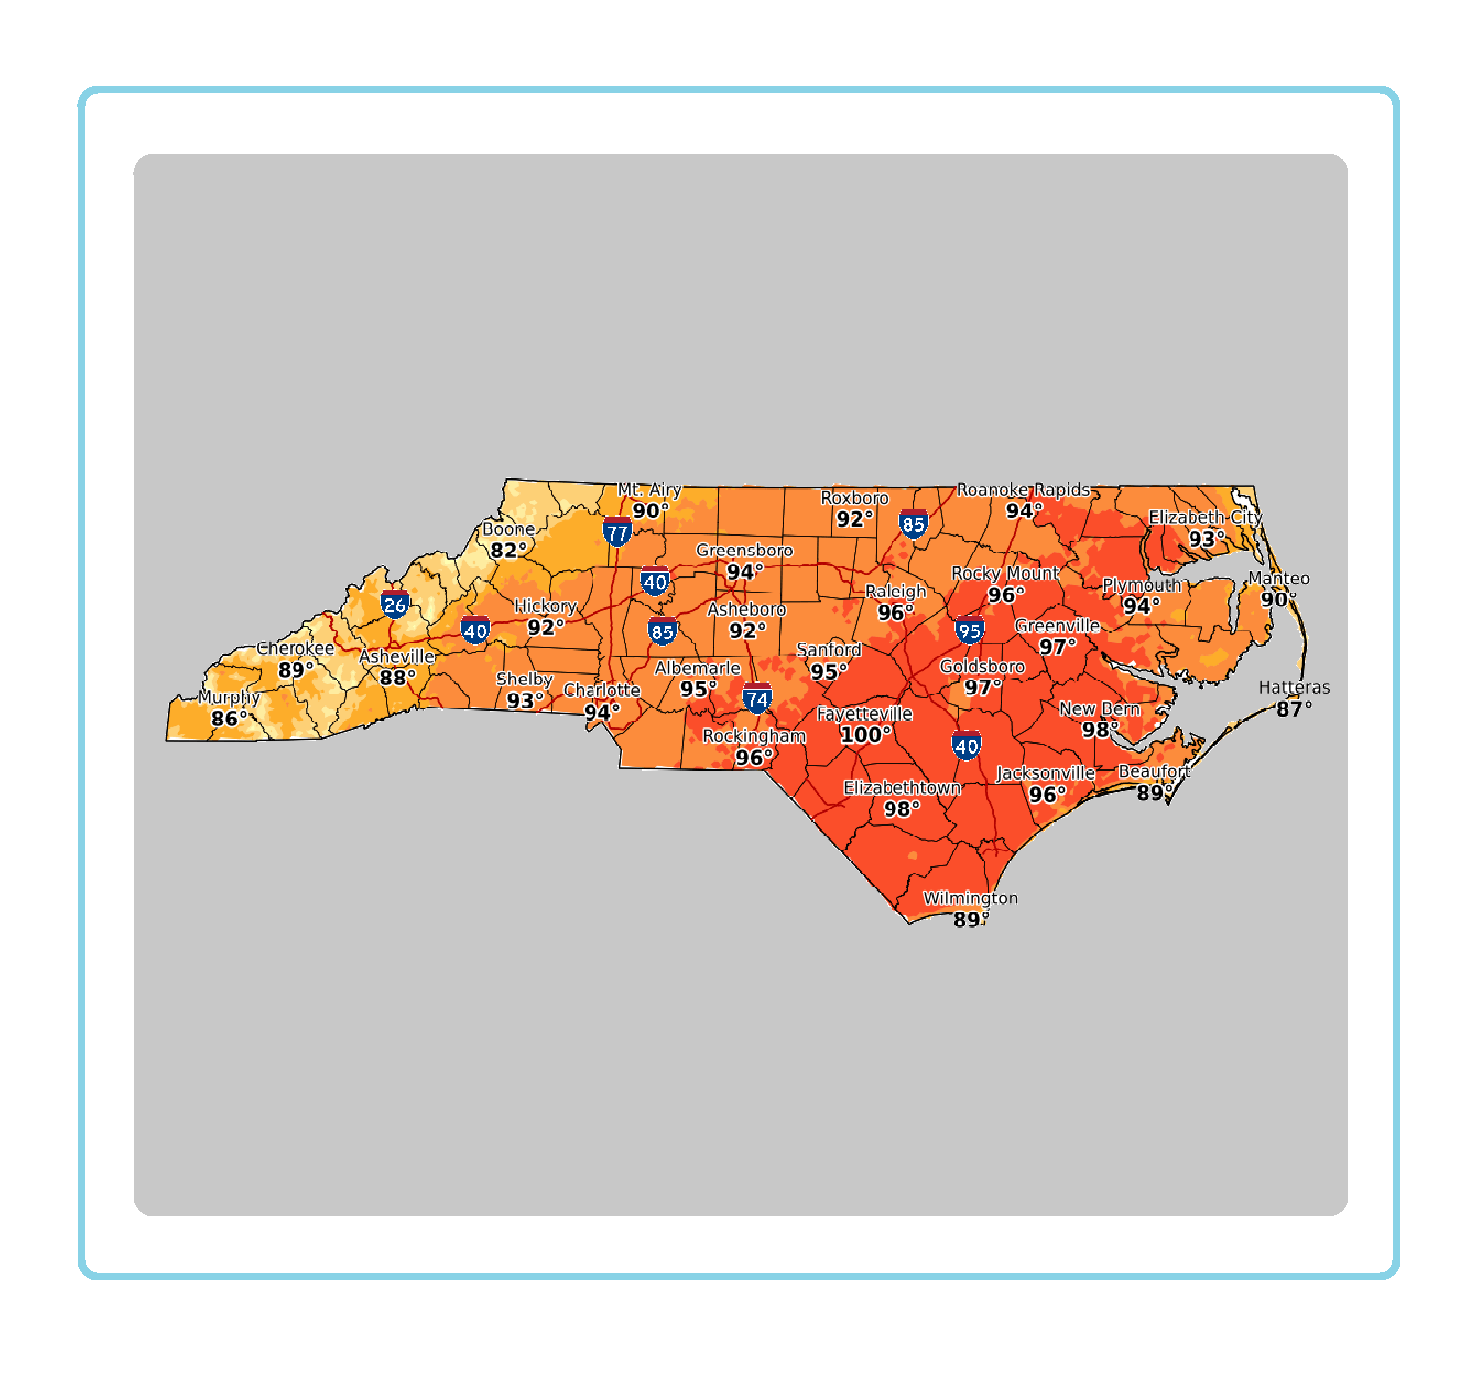 Statewide Maps
 Forecaster Discussion