

|
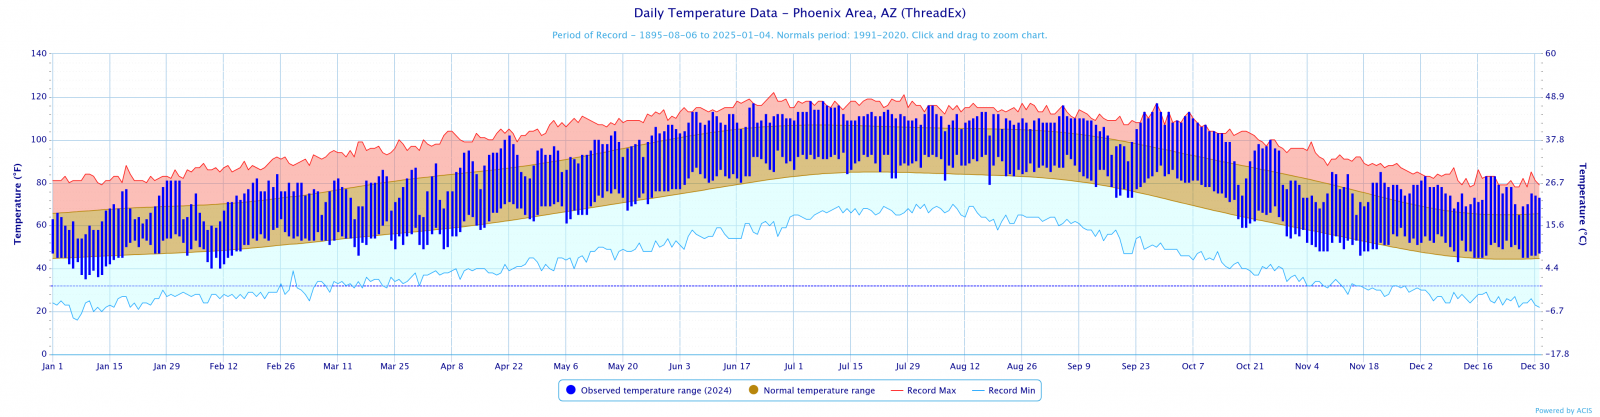
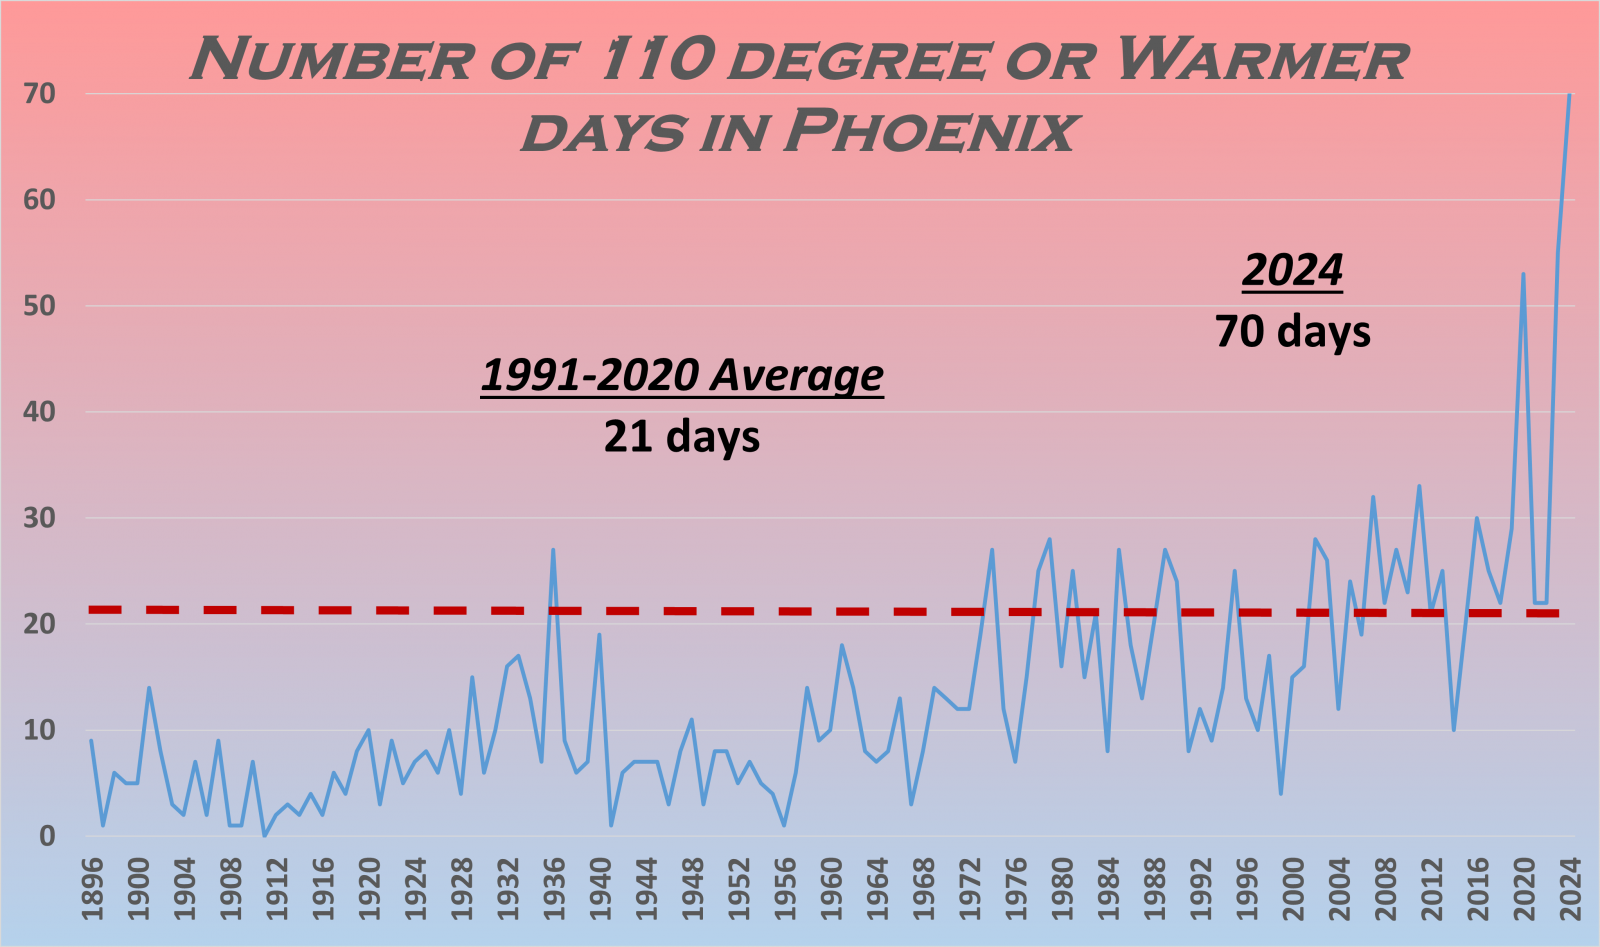
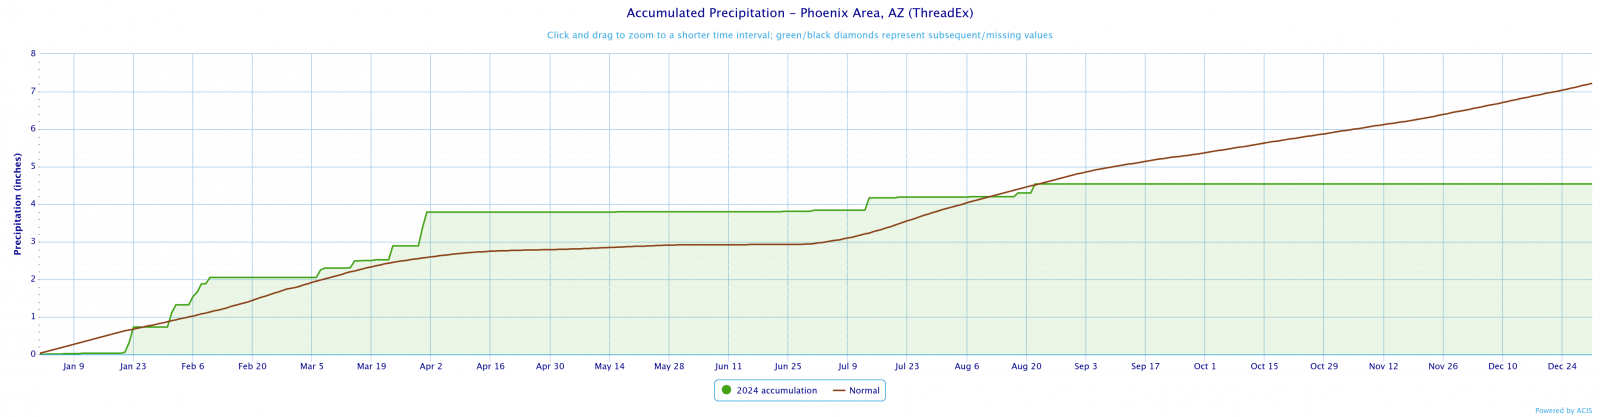
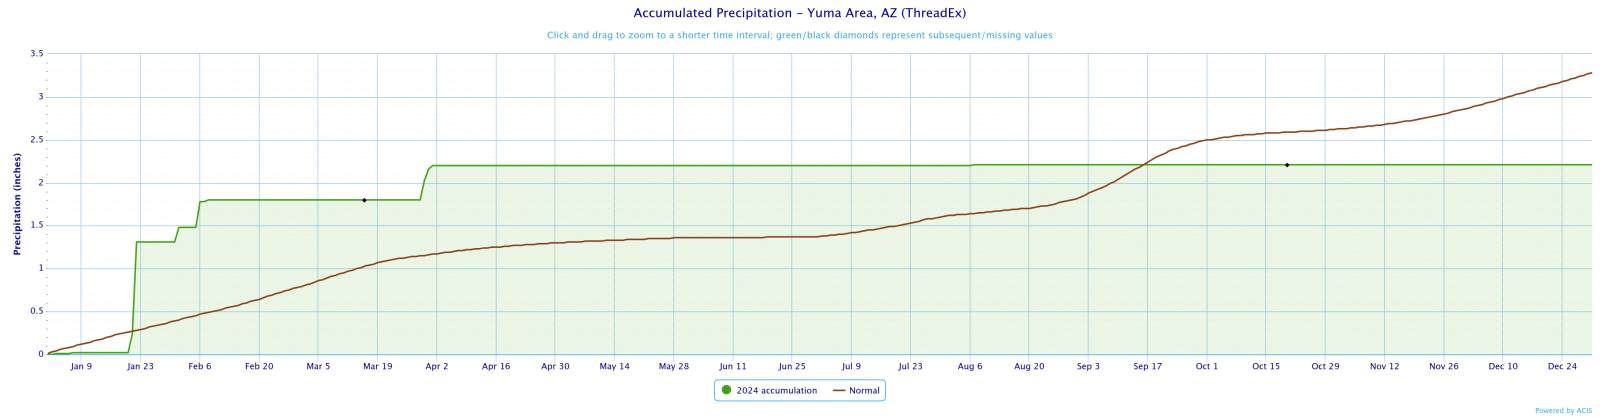
The year 2024 ended up being the warmest year recorded in the history of Phoenix, Arizona. Extensive missing temperature data at Yuma and El Centro precludes any definitive ranking this year. Rainfall in Phoenix for the year was much below average, and ranked as the 23rd driest. Equipment failures at Yuma failed to record events required to make an annual total. Records for Phoenix began in 1896, first taken in downtown and since moved to Sky Harbor airport in the 1950s. An El Nino pattern was prevalent early in 2024, though conditions gradually turned neutral during the spring. Not all El Nino's produce wet weather in the Southwest, however drier weather earlier in the winter became wetter towards the beginning of spring. This wet period was much needed after a hot, dry 2023 monsoon. With this pattern of periodic storm systems early in 2024, temperatures oscillated around the monthly averages through April. The late spring and beginning of the 2024 summer monsoon marked a distinct change in the overall pattern as the cooler and wetter early spring turned dry and hot. Moisture intrusions typical for the monsoon and supportive of thunderstorm development were slow to arrive into the region, and prolonged periods of dry weather persisted through the summer. As a result, the summer months repeatedly ranked in the top 5 hottest months on record, and the summer as a whole ranked as the hottest on record for the entire region. Occasional thunderstorm days were few and far between for much of the area, and the recording station at Phoenix Sky Harbor airport reported its 7th driest monsoon on record at only 0.74". However, there were a few notable events during the monsoon including a series of microbursts around the Phoenix metro on July 24th that caused a warehouse to collapse. On August 6th, there was a larger downburst resulting in wind damage around the McCormick ranch area. And on August 22nd, a large dust storm with isolated wind damage moved through the Phoenix metro. The hot, dry weather did not come to an end with the cessation of the monsoon. In fact, an unprecedented string of exceptionally hot days persisted well into October before the typical cooler autumn weather finally arrived in November. This spell of climatologically normal temperatures were fairly short-lived as abnormally warm weather returned in December with the arrival of a weak La Nina pattern. All told, 2024 will go down as one of the hottest years on record for the entire Southwest region.
|
***Please note all climatic data are considered preliminary until validated by the National Centers for Environmental Information*** |
Phoenix Annual Temperature Rankings (Warmest Years)
|
|
|
|---|
|
|
Avg Max Temp |
Highest
Temp |
Avg Min Temp
|
Lowest Temp
|
Avg Temp
|
Rank (1=Warmest, 130=Coldest)
|
|---|---|---|---|---|---|---|
| Jan |
66.1
|
81 on the 30th & 31st
|
45.8
|
35 on the 9th
|
56.0 /-0.8
|
28th
|
| Feb |
72.1
|
84 on the 25th
|
50.7
|
40 on the 9th & 11th
|
61.4 /+1.5
|
13th
|
| Mar |
76.4
|
87 on the 30th
|
53.8
|
46 on the 16th
|
65.1 /-1.2
|
29th
|
| Apr |
86.8
|
102 on the 22nd
|
61.3
|
49 on the 1st & 6th
|
74.0 /+0.8
|
23rd
|
| May |
96.7
|
107 on the 31st
|
70.9
|
61 on the 6th
|
83.8 /+1.8
|
13th
|
| Jun |
109.4
|
117 on the 21st
|
84.6
|
77 on the 2nd & 3rd
|
97.0 /+5.6
|
1st
|
| Jul |
112.3
|
118 on the 5th & 8th
|
89.8
|
82 on the 25th & 26th
|
101.1 /+5.6
|
2nd
|
| Aug |
109.4
|
116 on the 3rd & 4th
|
88.1
|
79 on the 18th
|
98.7 /+4.3
|
3rd
|
| Sep |
106.6
|
117 on the 28th
|
82.5
|
73 on the 21st & 22nd
|
94.6 /+5.4
|
1st
|
| Oct |
97.9
|
113 on the 1st & 6th
|
71.1
|
54 on the 31st
|
84.5 /+7.1
|
1st
|
| Nov |
76.3
|
85 on the 10th & 22nd
|
51.9
|
46 on the 17th
|
64.1/-1.0
|
30th
|
| Dec |
75.1
|
83 on the 19th & 20th
|
49.4
|
43 on the 11th
|
62.3/+6.5
|
1st
|
(*** click on month for more comprehensive monthly summary ***)
| Record Highs Set in 2024 |
|---|
| Date | Record | Previous Record |
|---|---|---|
| Jun 6 |
113
|
111 in 2016
|
| Jun 21 |
117- tied record
|
117 in 2017
|
| Jul 5 |
118
|
116 in 1983
|
| Jul 8 |
118
|
115 in 1985
|
| Jul 9 | 116 - tied record | 116 in 1958 |
| Jul 10 | 115 - tied record | 115 in 1958 |
| Jul 12 | 116 - tied record | 116 in 2020 |
| Aug 3 | 116 | 114 in 2020 |
| Aug 4 | 116 - tied record | 116 in 1975 |
| Sep 5 | 116 | 115 in 2020 |
| Sep 8 | 110 - tied record | 110 in 2023 |
| Sep 24 | 108 - tied record | 108 in 2002 |
| Sep 25 | 113 | 108 in 1989 |
| Sep 26 | 110 | 108 in 1989 |
| Sep 27 | 113 | 107 in 2009 |
| Sep 28 | 117 | 108 in 1992 |
| Sep 29 | 113 | 107 in 2003 |
| Sep 30 | 107 - tied record | 107 in 2010 |
| Oct 1 | 113 | 107 in 2020 |
| Oct 2 | 108 | 107 in 1980 |
| Oct 3 | 109 | 105 in 2020 |
| Oct 4 | 108 | 105 in 2020 |
| Oct 5 | 111 | 105 in 2020 |
| Oct 6 | 113 | 105 in 1917 |
| Oct 7 | 110 | 104 in 1991 |
| Oct 8 | 108 | 104 in 1987 |
| Oct 9 | 106 | 103 in 1996 |
| Oct 10 | 107 | 105 in 1991 |
| Oct 11 | 104 | 102 in 1991 |
| Oct 12 | 104 | 103 in 1950 |
| Oct 13 | 103 | 101 in 1989 |
| Oct 14 | 103 | 100 in 2020 |
| Oct 25 | 97 | 96 in 2014 |
| Oct 26 | 100 | 98 in 2001 |
| Dec 3 | 83 | 81 in 1940 |
| Dec 18 | 83 | 79 in 1950 |
| Dec 19 | 83 | 79 in 1917 |
| Dec 20 | 83 | 78 in 1954 |
| Dec 21 | 79 | 78 in 2023 |
| No Record Lows were set in 2024 |
|---|
Yuma Annual Temperature Rankings (Warmest Years)
|
|
|
|---|
|
|
Avg Max Temp |
Highest
Temp |
Avg Min Temp
|
Lowest Temp
|
Avg Temp
|
Rank (1=Warmest, 148=Coldest)
|
|---|---|---|---|---|---|---|
| Jan |
M
|
78 on the 29th
|
46.8
|
36 on the 9th
|
M /M
|
Missing
|
| Feb |
71.8
|
80 on the 25th
|
50.9
|
41 on the 12th & 13th
|
61.3 /-0.6
|
46th
|
| Mar |
76.2
|
86 on the 22nd
|
53.4
|
46 on the 25th
|
64.8 /-2.8
|
76th
|
| Apr |
85.5
|
97 on the 22nd
|
58.3
|
46 on the 6th
|
71.9 / -1.2
|
62nd
|
| May |
95.1
|
103 on the 28th & 31st
|
65.1
|
53 on the 6th
|
80.1 /-0.5
|
40th
|
| Jun |
106.6
|
112 on the 15th & 21st
|
78.0
|
70 on the 1st
|
92.3 /+3.2
|
7th
|
| Jul |
110.3
|
117 on the 8th
|
85.5
|
80 on the 28th & 29th
|
97.9 /+3.3
|
1st
|
| Aug |
108.7
|
114 on the 3rd & 4th
|
85.2
|
77 on the 27th
|
97.0 /+2.2
|
6th
|
| Sep |
M
|
115 on the 4th
|
M
|
63 on the 18th
|
M / M
|
Missing
|
| Oct |
97.1
|
113 on the 1st
|
67.8
|
51 on the 30th
|
82.2 /+4.2
|
4th
|
| Nov |
75.5
|
82 on the 1st & 10th
|
50.8
|
41 on the 23rd
|
63.1 /-3.0
|
81st
|
| Dec |
74.8
|
81 on the 19th
|
47.9
|
43 on the 16th
|
61.3 /+4.0
|
4th
|
(*** click on month for more comprehensive monthly summary ***)
| Record Highs Set in 2024 |
|---|
| Date | Record | Previous Record |
|---|---|---|
| Oct 1 |
113
|
110 in 1980
|
| Oct 2 |
112 - tied record
|
112 in 1980
|
| Oct 5 |
110
|
108 in 1917
|
| Oct 7 |
111
|
108 in 1987
|
| Oct 9 | 106 - tied record | 106 in 1996 |
| Oct 26 | 98 - tied record | 98 in 1990 |
| No Record Lows were set in 2024 |
|---|
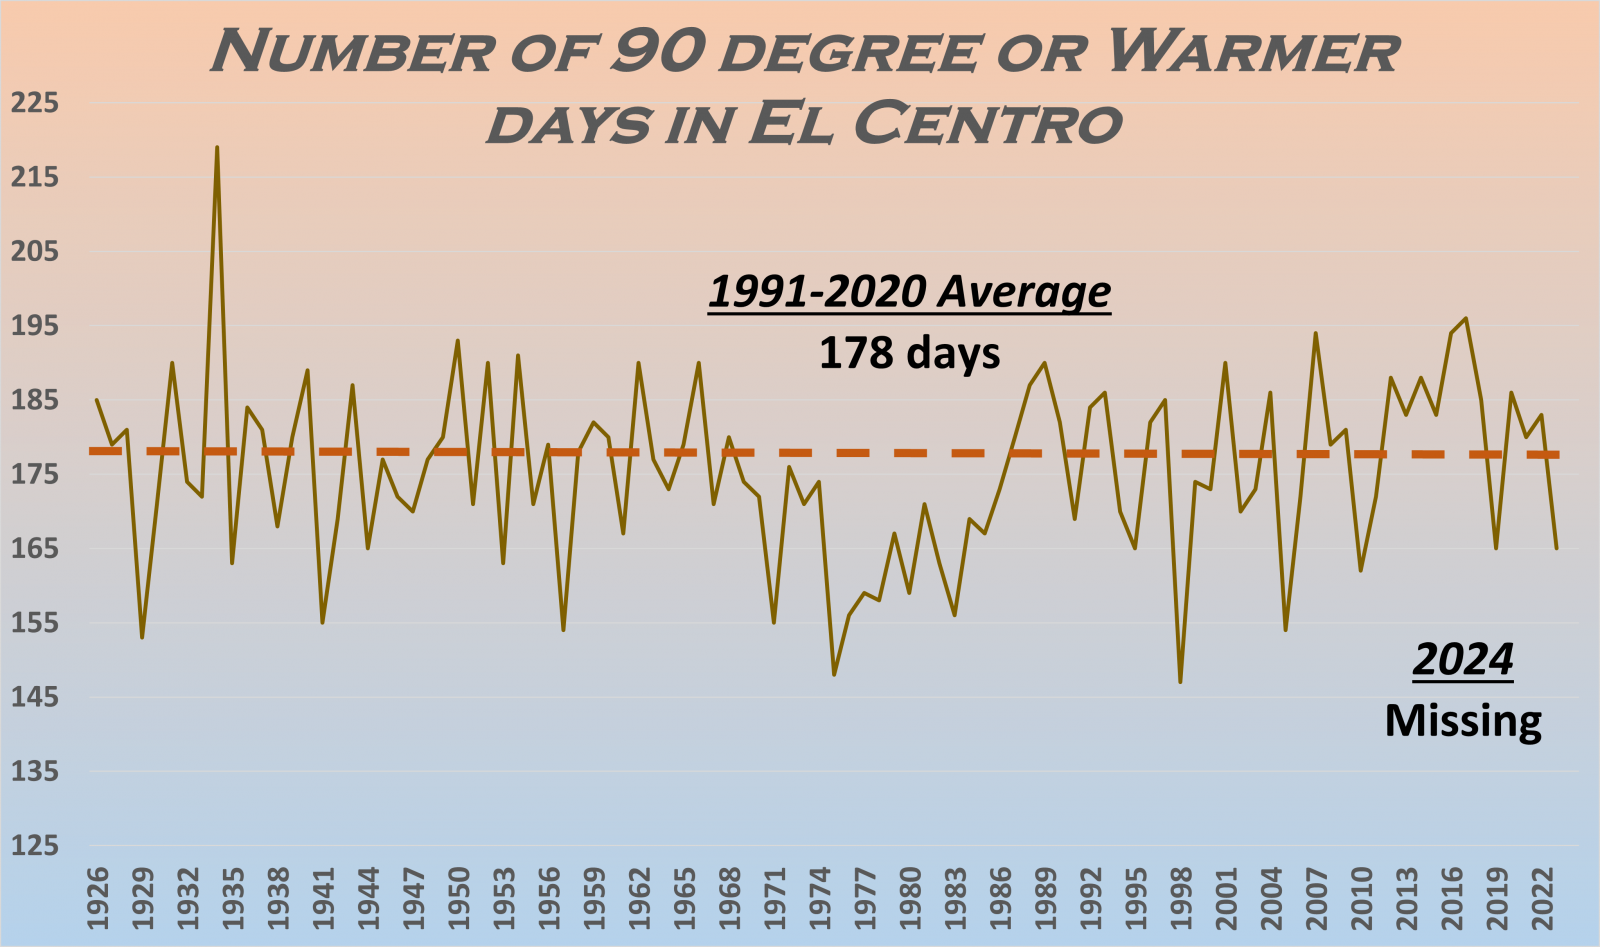
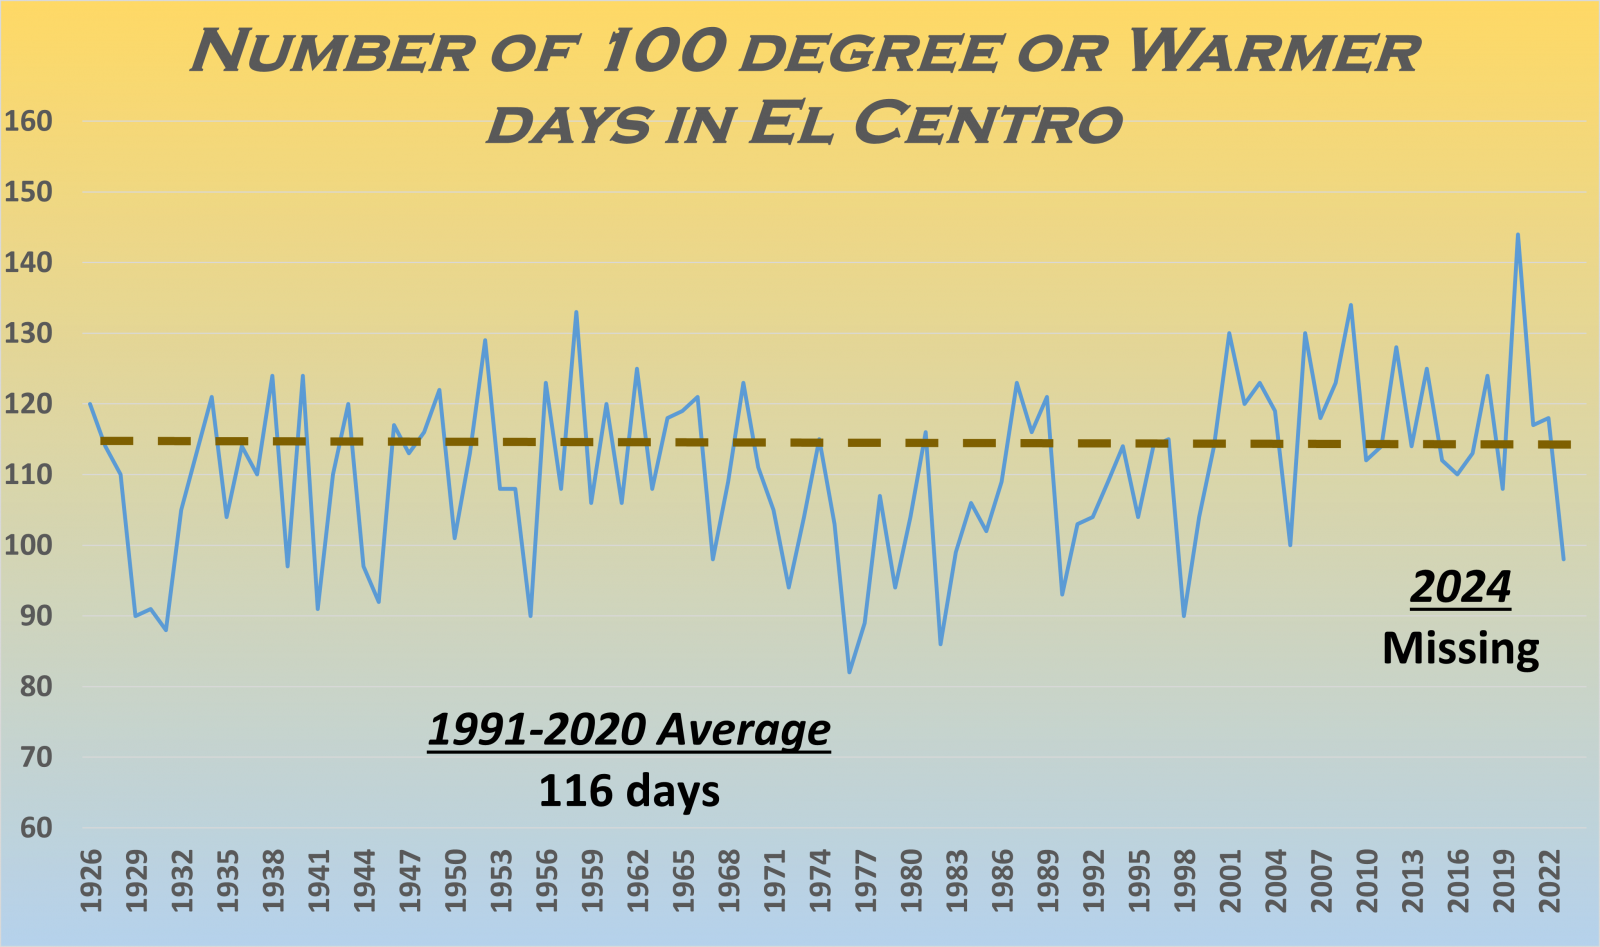
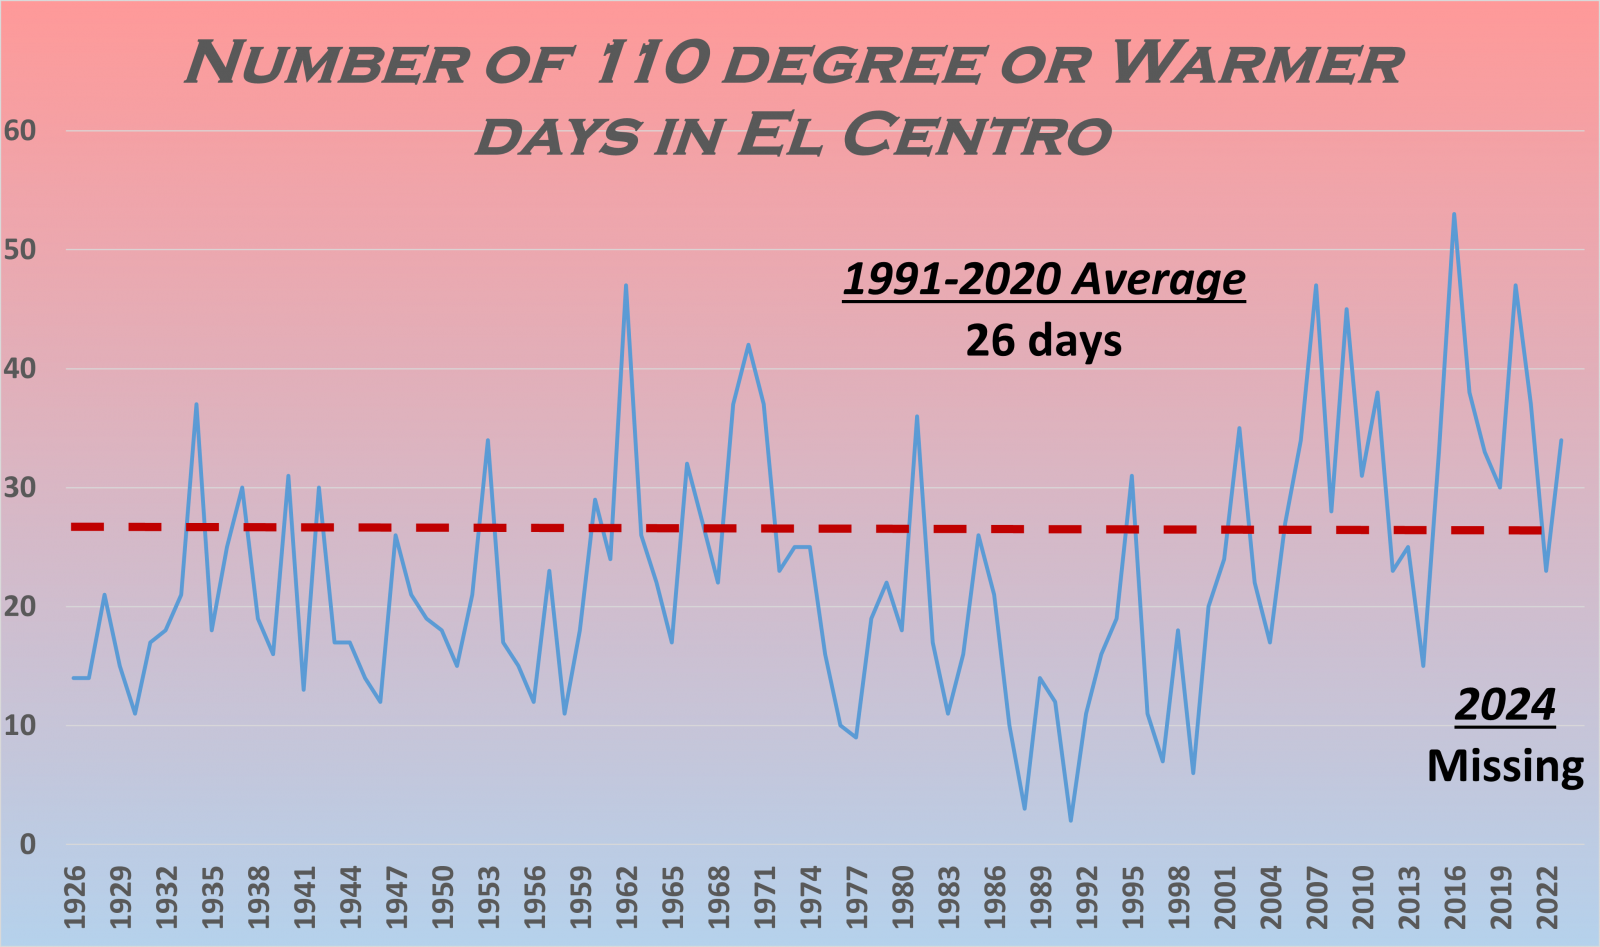
El Centro Annual Temperature Rankings (Warmest Years)
|
|
|
|---|
|
|
Avg Max Temp |
Highest
Temp |
Avg Min Temp
|
Lowest Temp
|
Avg Temp
|
Rank (1=Warmest, 99=Coldest)
|
|---|---|---|---|---|---|---|
| Jan |
68.3
|
78 on the 29th & 30th
|
42.8
|
32 on the 10th & 12th
|
55.6 /-0.4
|
42nd
|
| Feb |
71.6
|
81 on the 25th
|
49.1
|
37 on the 12th
|
60.4 /+1.0
|
30th
|
| Mar |
76.3
|
87 on the 21st
|
51.1
|
44 on the 10th
|
63.7 /-1.6
|
52nd
|
| Apr |
85.6
|
98 on the 22nd
|
55.3
|
44 on the 7th
|
70.4 / -0.5
|
50th
|
| May |
94.8
|
103 on the 30th & 31st
|
63.7
|
51 on the 6th
|
79.3 /+1.1
|
29th
|
| Jun |
106.7
|
113 on the 15th
|
74.6
|
65 on the 3rd
|
90.6 /+3.8
|
3rd
|
| Jul |
112.3
|
120 on the 8th
|
83.1
|
73 on the 2nd
|
97.7/+4.6
|
1st
|
| Aug |
M
|
Missing
|
M
|
Missing
|
M / M
|
Missing
|
| Sep |
M
|
Missing
|
M
|
Missing
|
M / M
|
Missing
|
| Oct |
M
|
Missing
|
M
|
48 on the 31st
|
M / M
|
Missing
|
| Nov |
75.0
|
81 on the 11th
|
46.3
|
37 on the 23rd
|
60.7 /-2.6
|
75th
|
| Dec |
74.3
|
80 on the 19th & 23rd
|
43.2
|
36 on the 11th
|
58.7 /+3.8
|
5th
|
(*** click on month for more comprehensive monthly summary ***)
| Record Highs Set in 2024 |
|---|
| Date | Record | Previous Record |
|---|---|---|
| Jul 5 |
116
|
115 in 2007
|
| Jul 8 |
120
|
117 in 1942
|
| Dec 19 | 80 |
79 in 1985
|
| No Record Lows were set in 2024 |
|---|
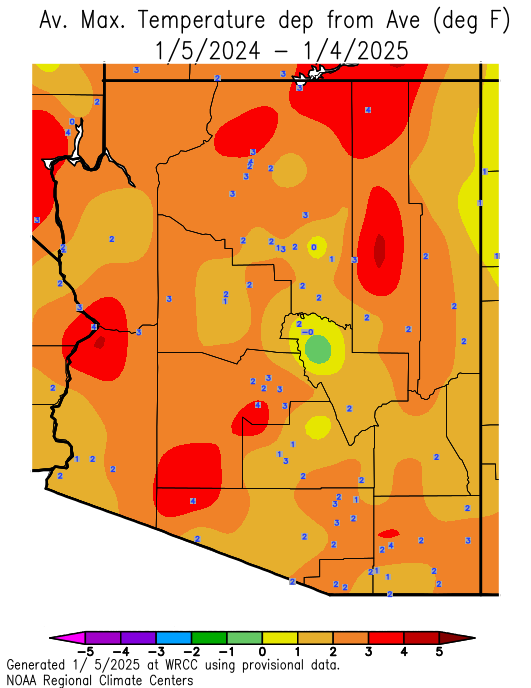
| Arizona Statewide Temperature Maps (Data courtesy of Western Region Climate Center) |
|---|
|
Arizona 2024 Average
Maximum Temperature
 |
Arizona 2024 Maximum Temp Departure from normal
 |
|
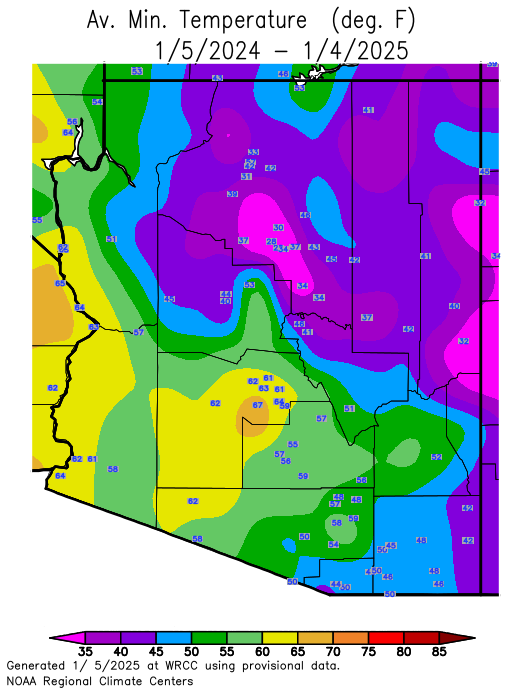
Arizona 2024 Average
Minimum Temperature
 |
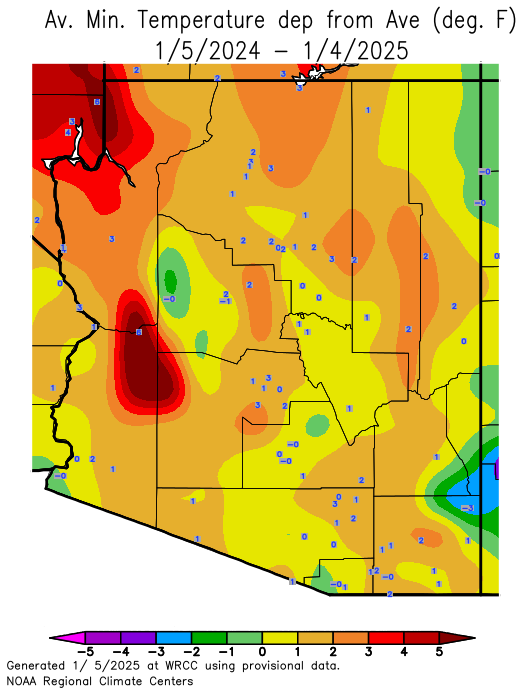
Arizona 2024 Minimum Temp
Departure from normal
 |
|
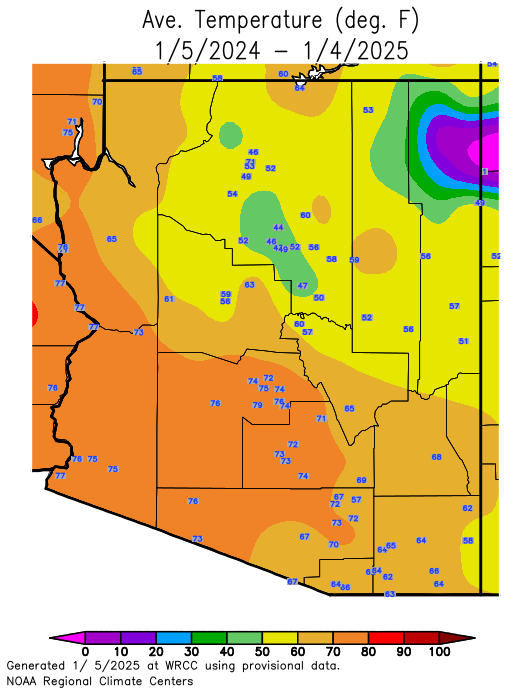
Arizona 2024 Average Temperature
 |
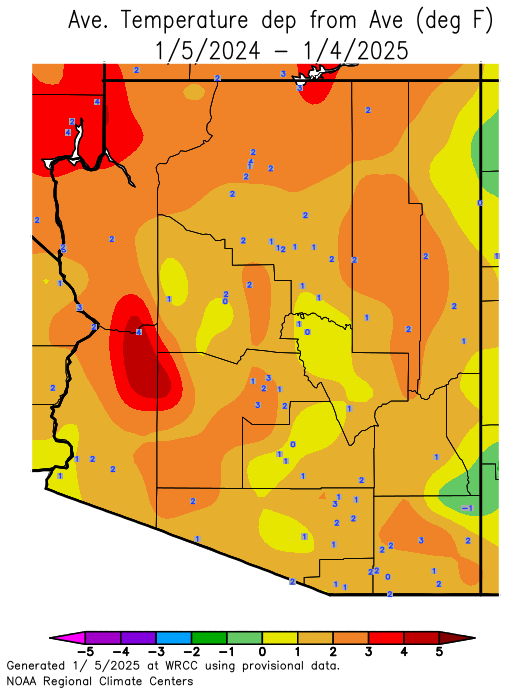
Arizona 2024 Average Temp
Departure from normal
 |
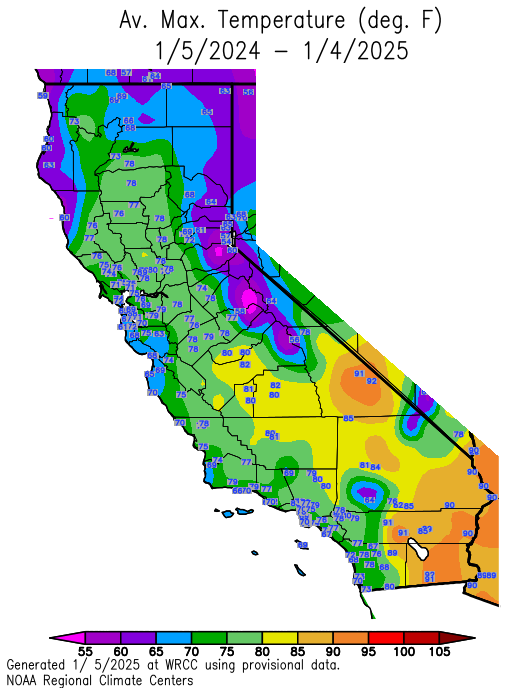
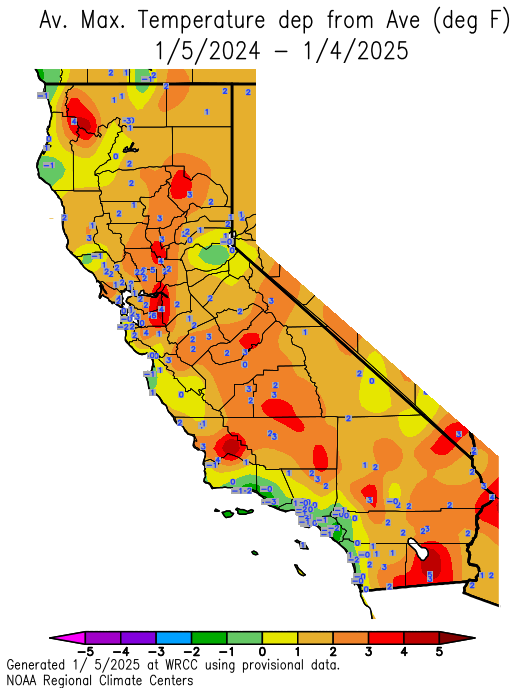
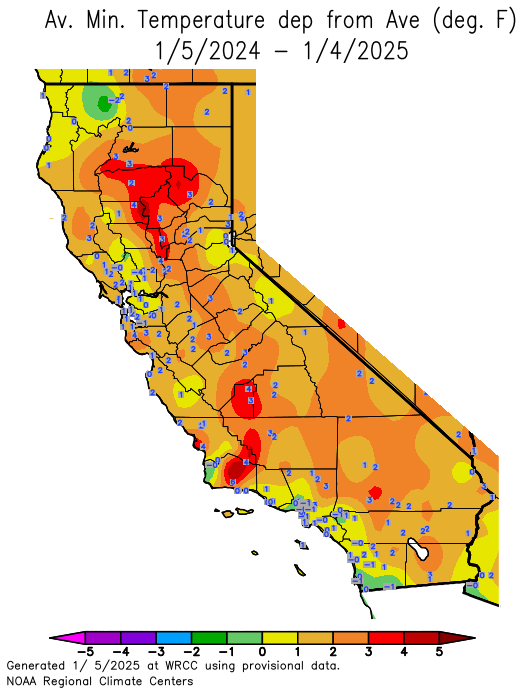
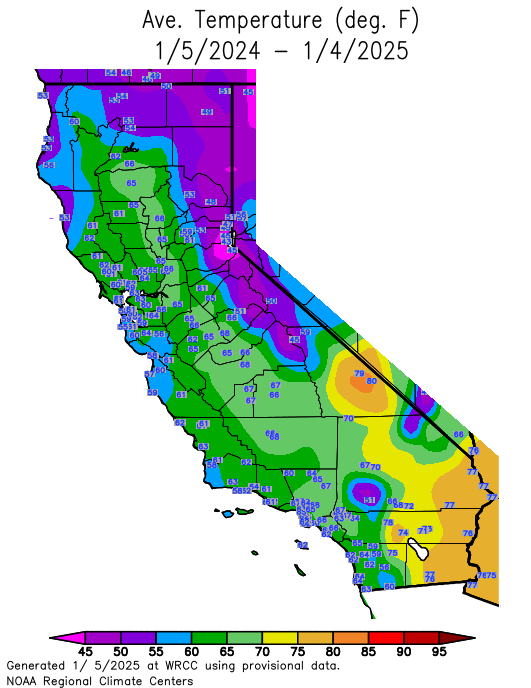
| California Statewide Temperature Maps (Data courtesy of Western Region Climate Center) |
|---|
|
California 2024 Average
Maximum Temperature
 |
California 2024 Maximum Temp Departure from normal
 |
|
California 2024 Average
Minimum Temperature
 |
California 2024 Minimum Temp
Departure from normal
 |
|
California 2024 Average Temperature
 |
California 2024 Average Temp
Departure from normal
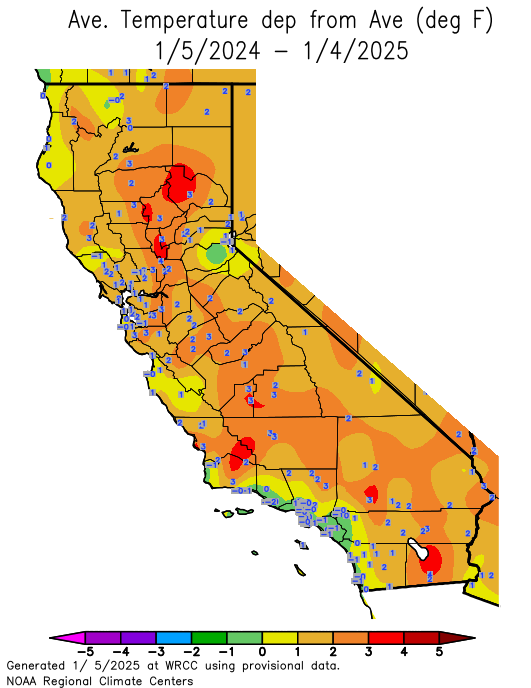 |
| 2024 Phoenix Precipitation Statistics |
|---|
| Precip Total | Departure | Rank (1=Wettest, 130=Driest) | |
|---|---|---|---|
| Jan |
0.73
|
-0.14
|
56th
|
| Feb |
1.32
|
+0.45
|
24th
|
| Mar |
1.34
|
+0.51
|
27th
|
| Apr |
0.40
|
+0.18
|
32nd
|
| May |
0.01
|
-0.12
|
57th
|
| Jun |
0.01
|
-0.01
|
44th
|
| Jul |
0.38
|
-0.53
|
82nd
|
| Aug |
0.35
|
-0.58
|
95th
|
| Sep |
Trace
|
-0.57
|
130th
|
| Oct |
Trace
|
-0.56
|
130th
|
| Nov |
Trace
|
-0.57
|
130th
|
| Dec |
0.00
|
-0.74
|
130th
|
(*** click on month for more comprehensive monthly summary ***)
| Phoenix Record Daily Rainfall for 2024 |
|---|
| Date | Record | Previous Record |
|---|---|---|
| Jan 23 |
0.41
|
0.25 in 1967
|
| Mar 31 | 0.50 | 0.27 in 1949 |
| 2024 Yuma Precipitation Statistics |
|---|
| Precip Total | Departure | Rank (1=Wettest, 147=Driest) | |
|---|---|---|---|
| Jan |
1.31
|
+0.92
|
12th
|
| Feb |
0.49
|
+0.11
|
40th
|
| Mar |
Missing
|
Missing
|
Missing
|
| Apr |
0.04
|
-0.10
|
52nd
|
| May |
0.00
|
-0.06
|
147th
|
| Jun |
0.00
|
-0.01
|
147th
|
| Jul |
Trace
|
-0.24
|
147th
|
| Aug |
0.01
|
-0.19
|
112th
|
| Sep |
Missing |
Missing |
Missing |
| Oct |
Missing
|
Missing
|
Missing
|
| Nov |
0.00
|
-0.23
|
147th
|
| Dec |
0.00
|
-0.43
|
147th
|
(*** click on month for more comprehensive monthly summary ***)
| Yuma Record Daily Rainfall for 2024 |
|---|
| Date | Record | Previous Record |
|---|---|---|
| Jan 22 |
1.07
|
0.50 in 1915
|
| Feb 1 | 0.17 | 0.15 in 1938 |
| Mar 30 | 0.22 | 0.08 in 1992 |
| Arizona Statewide Precipitation Maps (Data courtesy of Western Region Climate Center) |
|---|
|
Arizona 2024
Precipitation
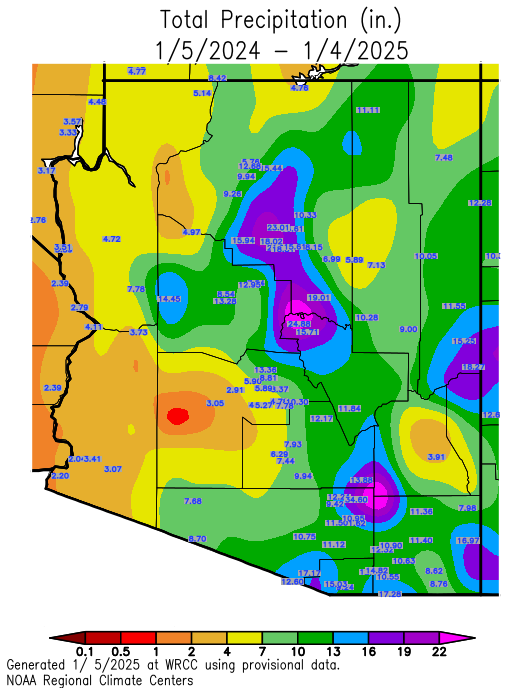 |
Arizona 2024 Precip Departure from normal
 |
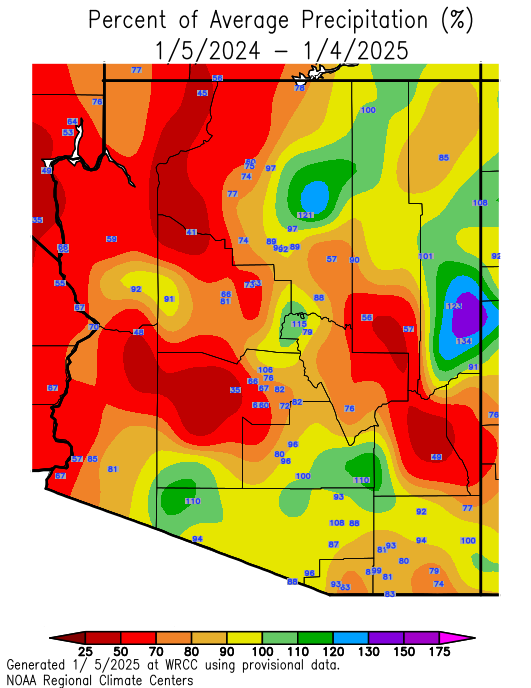
Arizona 2024 Precip Percent Normal
 |
| California Statewide Precipitation Maps (Data courtesy of Western Region Climate Center) |
|---|
|
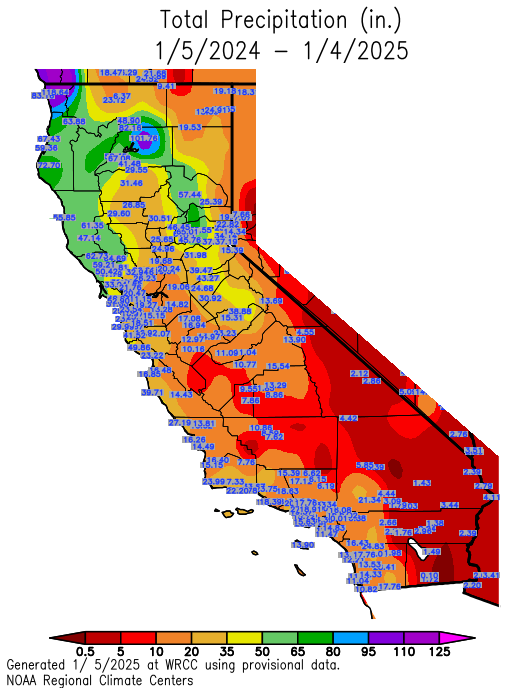
California 2024
Precipitation
 |
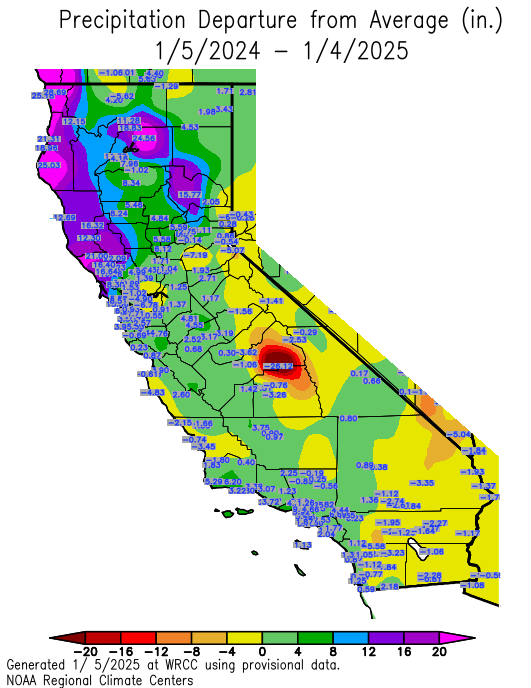
California 2024 Precip Departure from normal
 |
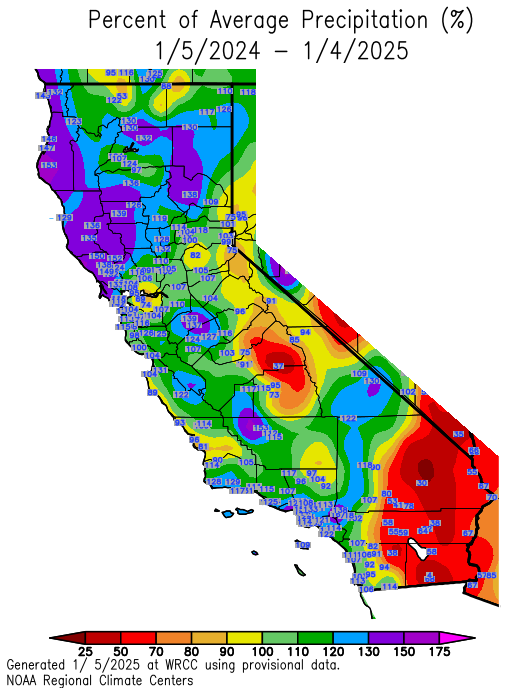
California 2024 Precip Percent Normal
 |
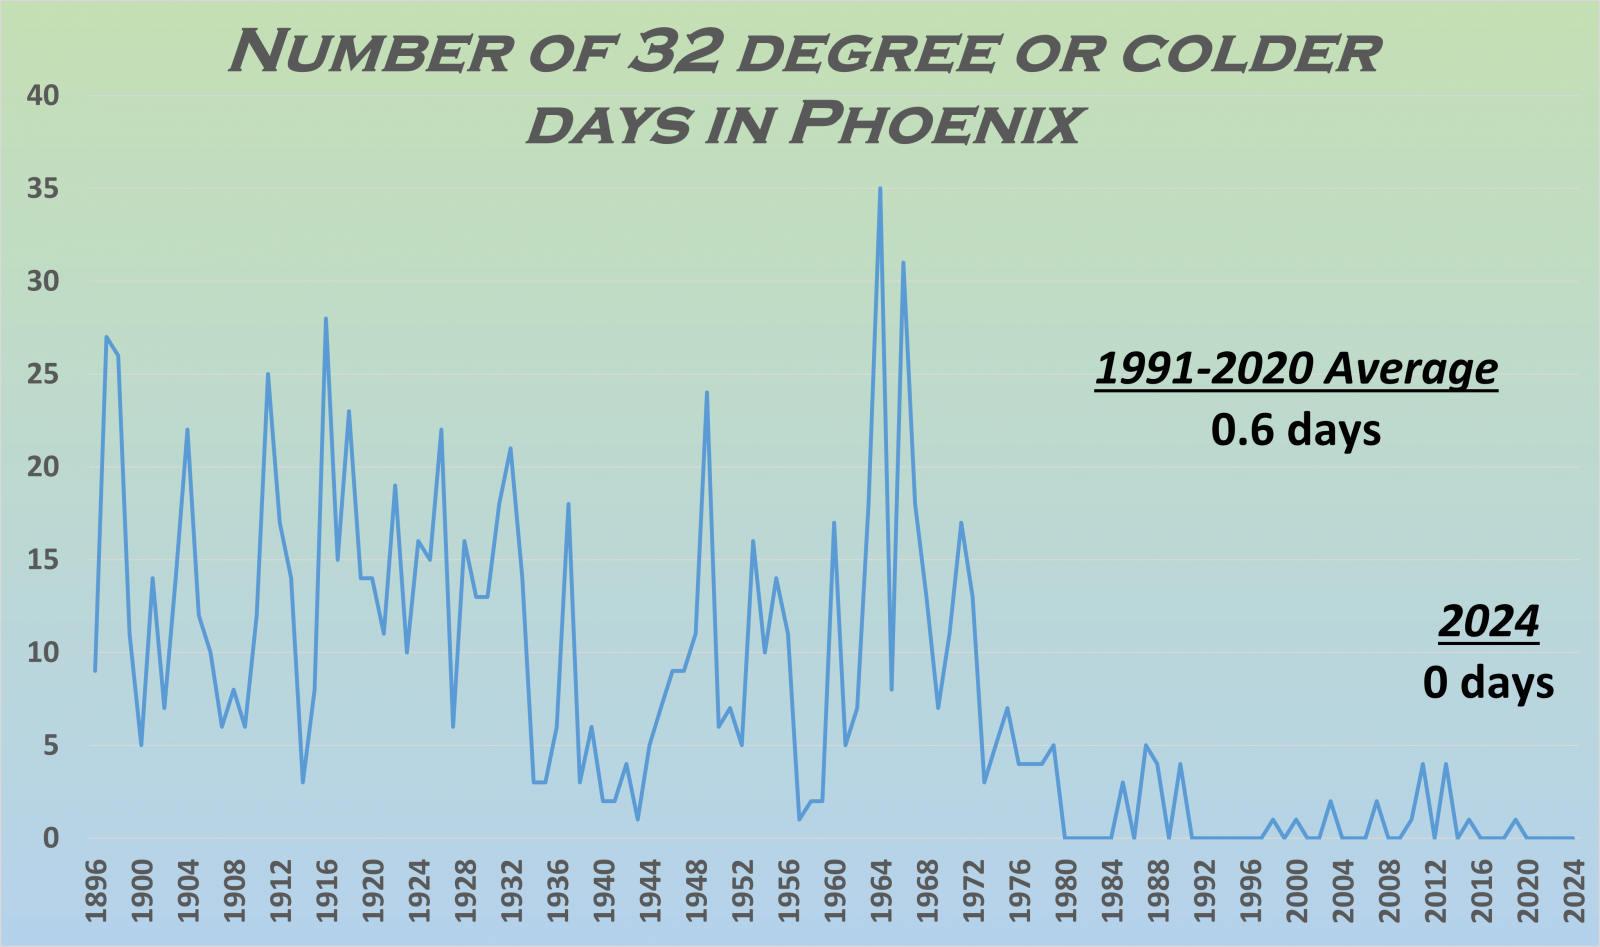
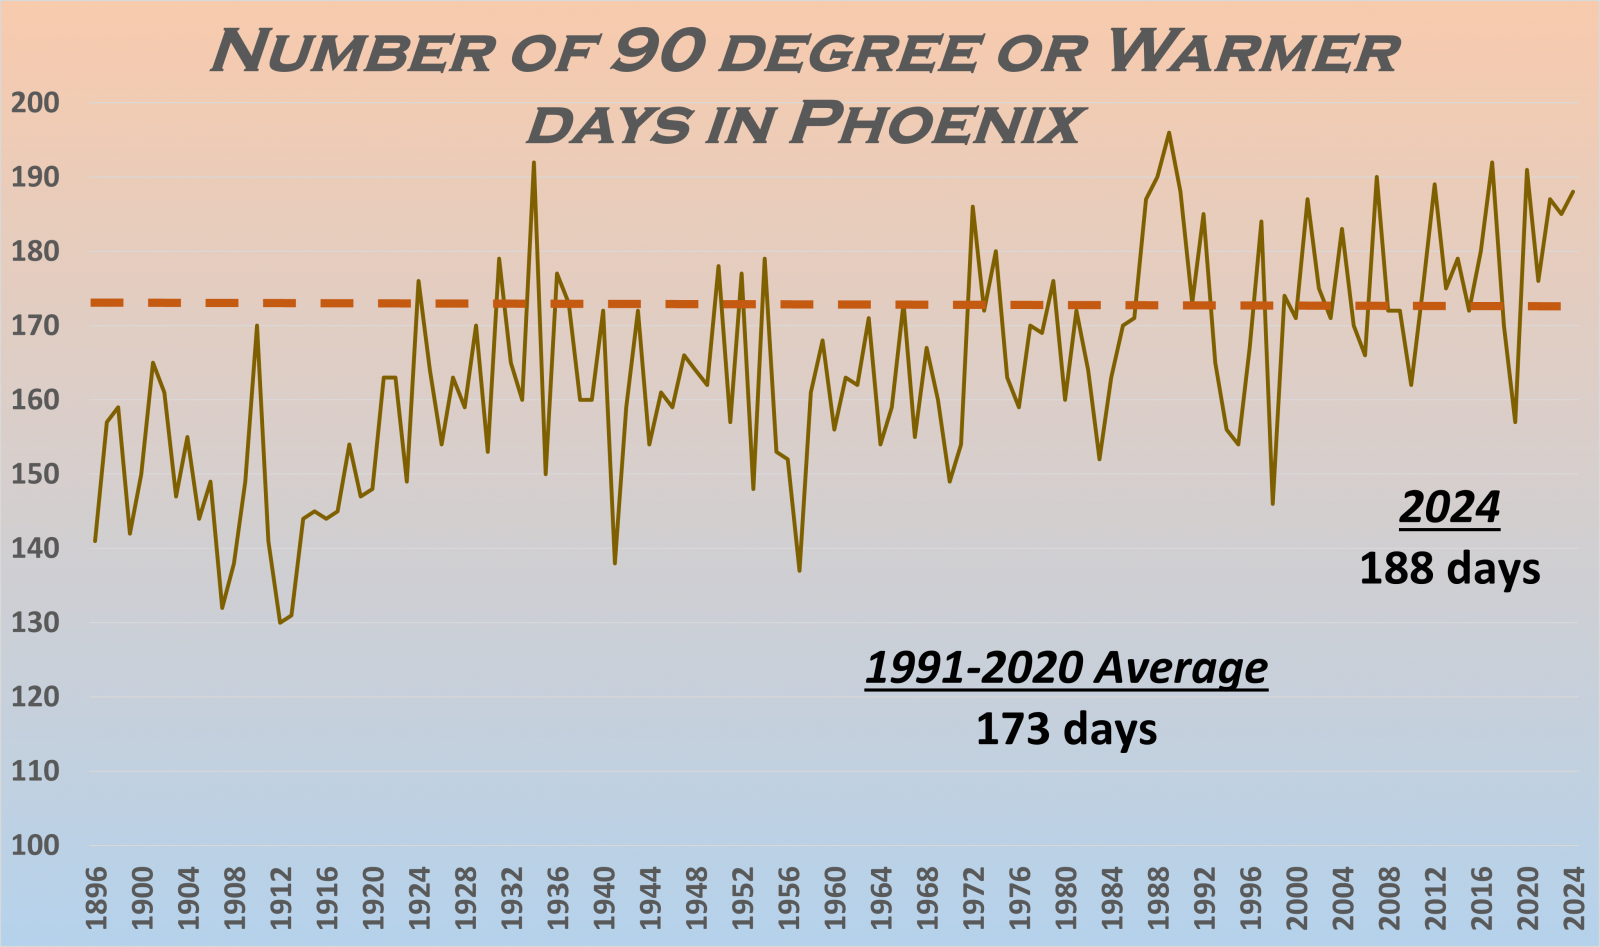
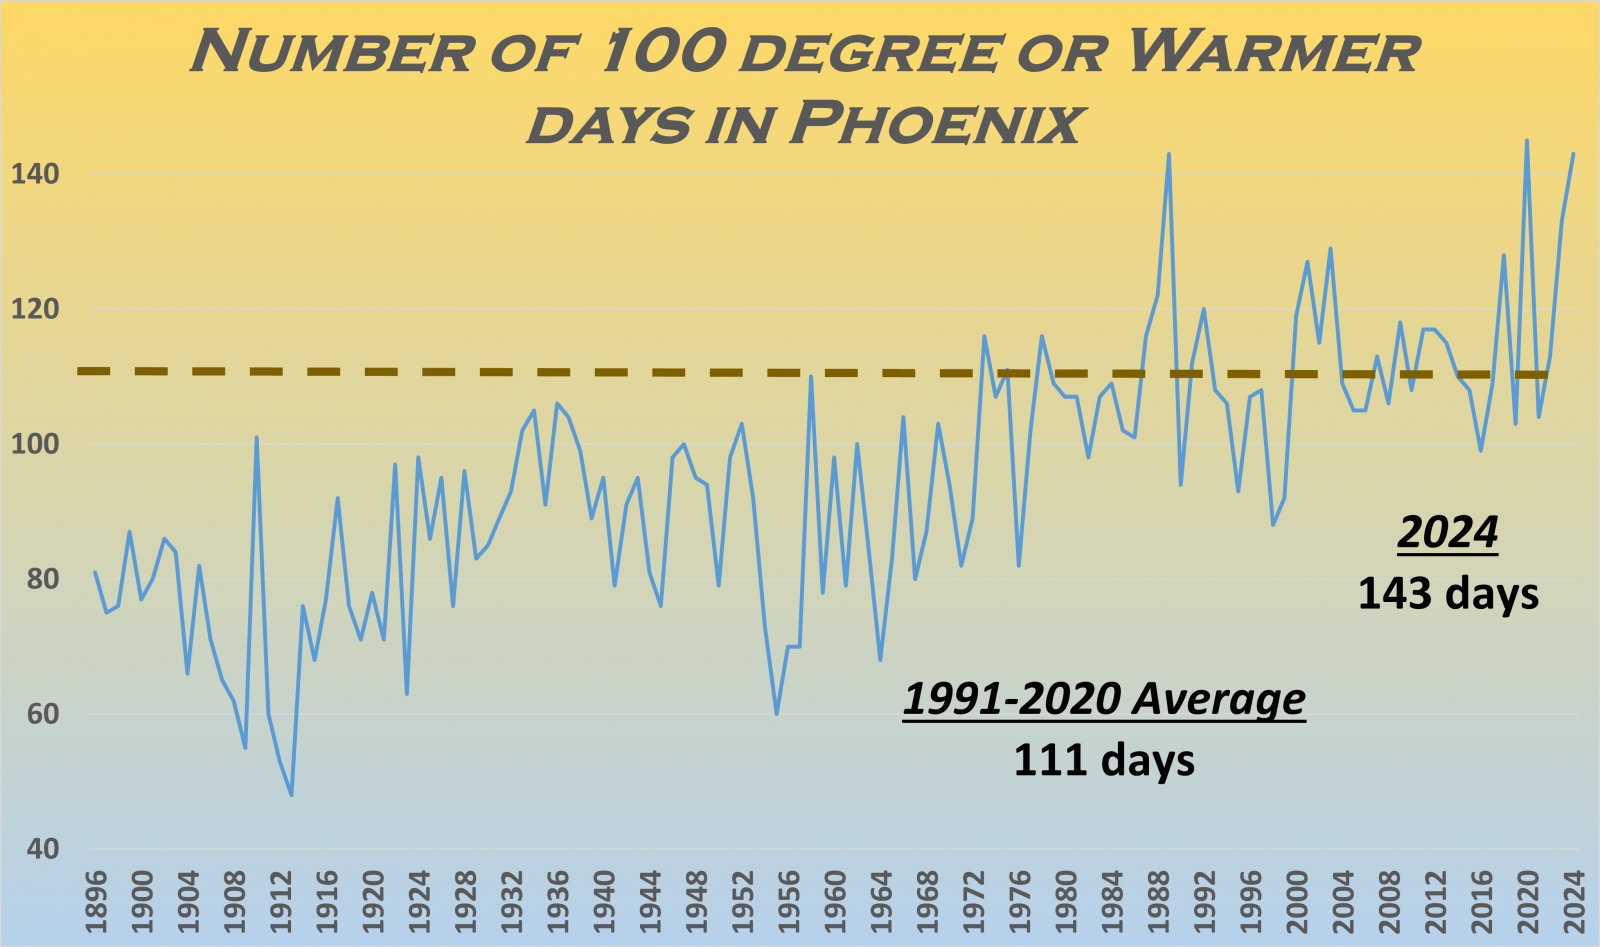
CLIMATE REPORT
NATIONAL WEATHER SERVICE PHOENIX AZ
307 PM MST SUN JAN 5 2025

...................................

...THE PHOENIX AZ CLIMATE SUMMARY FOR THE YEAR OF 2024...

CLIMATE NORMAL PERIOD 1991 TO 2020
CLIMATE RECORD PERIOD 1895 TO 2025

WEATHER         OBSERVED          NORMAL  DEPART   LAST YEAR'S
                VALUE   DATE(S)   VALUE   FROM     VALUE
                                          NORMAL
..............................................................
TEMPERATURE (F)
RECORD
 HIGH            122   06/26/1990
 LOW              16   01/07/1913
HIGHEST          118   07/05        114       4
                       07/08
LOWEST            35   01/09         35       0
AVG. MAXIMUM    90.4               87.1     3.3
AVG. MINIMUM    66.7               64.1     2.6
MEAN            78.6               75.6     3.0
DAYS MAX >= 90   188              173.4    14.6
DAYS MAX <= 32     0                0.0     0.0
DAYS MAX >= 100  143
DAYS MAX >= 110   70
DAYS MIN <= 32     0                0.6    -0.6
DAYS MIN <= 0      0                0.0     0.0
DAYS MIN >= 90    39

PRECIPITATION (INCHES)
RECORD
 MAXIMUM       19.73   1905
 MINIMUM        2.82   2002
TOTALS          4.54               7.22   -2.68
DAYS >= .01       29               33.4    -4.4
DAYS >= .10       16               17.2    -1.2
DAYS >= .50        1                4.1    -3.1
DAYS >= 1.00       0                0.9    -0.9
GREATEST
 24 HR. TOTAL   0.65   03/31 TO 04/01


DEGREE DAYS
HEATING TOTAL    626                874    -248
 SINCE 7/1       146                378    -232
COOLING TOTAL   5691               4765     926
 SINCE 1/1      5691               4764     927
..............................................................

WIND (MPH)
AVERAGE WIND SPEED              6.4
HIGHEST GUST SPEED/DIRECTION    65/360    DATE  08/22

AVERAGE RH (PERCENT)     29

WEATHER CONDITIONS. NUMBER OF DAYS WITH
THUNDERSTORM             30     HEAVY RAIN                 5
RAIN                     10     LIGHT RAIN                44
FOG W/VIS <= 1/4 MILE     0

-  INDICATES NEGATIVE NUMBERS.
R  INDICATES RECORD WAS SET OR TIED.
MM INDICATES DATA IS MISSING.
T  INDICATES TRACE AMOUNT.

