

|
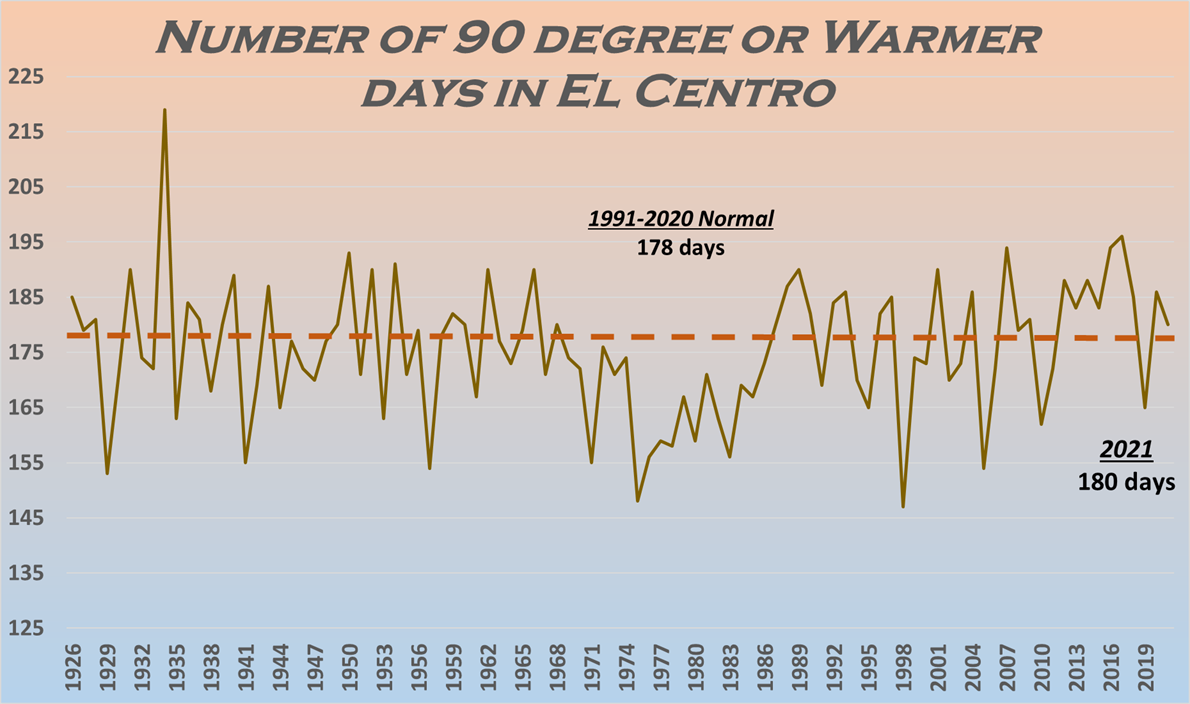
The year 2021 ended up being tied for the 10th warmest year recorded in the history of Phoenix, Arizona, 8th warmest at El Centro, CA, and tied for 8th warmest in Yuma. Records for Phoenix began in 1896, first taken in downtown and since moved to Sky Harbor airport in the 1950s. Records in Yuma began in 1878 and 1932 in El Centro. The year 2021 started with a moderate La Nina pattern and the typical drier than normal conditions across the region. Although one relatively wet system impacted the region in January, the bulk of the winter was characterized by disturbances passing north of the area and intensifying in eastern parts of the United States. This pattern reinforced the dry regime, but allowed relatively moderate temperatures The dry regime continues into spring 2021, however temperatures warmed beyond the usual thresholds this year. April 2021 ended up the 5th hottest on record in Phoenix while June 2021 was the hottest June ever recorded in Phoenix. Fine fuels at lower elevations were still evident from the past 2 wetter winter seasons resulting in ample fuel for the spring fire season. Even larger fuels at higher elevations were ripe for burning this year with the prolonged drought reaching into the Extreme and Exceptional category. Thus once again this year, large fires burned across many parts of the state. The 2021 summer monsoon started quite abruptly with good quality moisture surging into the state in early July. The pattern during a large portion of July and August was very favorable for repeated rounds of thunderstorms as subtropical high pressure migrated further north into the Great Basin (and sometimes Pacific NW) while dynamic easterly waves frequently passed through southern Arizona. This rainfall was very welcome over the region, however the frequency and intensity of the showers resulted in many flash flooding events - especially over areas previously burned by wildfires. Several of these periods of active weather resulted in significant impacts including the dates of July 21-26, Aug 13-14, Aug 16-17, and Aug 18) Monsoon thunderstorm activity shut down quickly in the beginning of September as the weather pattern shifted into an autumn pattern. Fall 2021 also resulted in a reemergence of La Nina conditions into the Pacific and a dry trend for the Southwest. Despite an extended period of drier weather during the fall and early winter, 2021 ended up an a rather wet note with several beneficial weather systems.
|
***Please note all climatic data are considered preliminary until validated by the National Centers for Environmental Information*** |
Phoenix Annual Temperature Rankings (Warmest Years)
|
|
|
|---|
|
|
Avg Max Temp |
Highest
Temp |
Avg Min Temp
|
Lowest Temp
|
Avg Temp
|
Rank (1=Warmest, 126=Coldest)
|
|---|---|---|---|---|---|---|
| Jan |
67.9
|
79 on the 15th
|
44.7
|
36 on the 25th
|
56.3 /-0.5
|
24th
|
| Feb |
73.0
|
82 on the 2nd & 3rd
|
48.9
|
44 on the 19th & 27th
|
61.0 /+1.1
|
Tied 17th
|
| Mar |
76.6
|
89 on the 7th & 29th
|
51.7
|
39 on the 1st
|
64.1 /-2.2
|
Tied 41st
|
| Apr |
90.0
|
98 on the 4th
|
63.3
|
57 on the 28th
|
76.7 /+3.5
|
5th
|
| May |
96.2
|
102 on the 13th & 29th
|
70.0
|
59 on the 23rd
|
83.1 /+1.1
|
Tied 17th
|
| Jun |
108.2
|
118 on the 17th
|
82.5
|
74 on the 7th & 8th
|
95.3 /+3.9
|
1st
|
| Jul |
103.7
|
112 on the 9th & 10th
|
83.7
|
73 on the 23rd & 25th
|
93.7 /-1.8
|
45th
|
| Aug |
103.2
|
115 on the 4th
|
81.9
|
71 on the 16th
|
92.6 /-1.8
|
34th
|
| Sep |
100.1
|
111 on the 9th
|
78.4
|
69 on the 26th
|
89.2 /+0.0
|
Tied 19th
|
| Oct |
86.8
|
98 on the 4th
|
62.7
|
52 on the 13th
|
74.8 /-2.6
|
Tied 37th
|
| Nov |
83.3
|
91 on the 5th
|
57.0
|
49 on the 28th
|
70.1/+5.0
|
2nd
|
| Dec |
69.2
|
85 on the 1st
|
49.2
|
38 on the 18th
|
59.2/+3.4
|
4th
|
(*** click on month for more comprehensive monthly summary ***)
| Record Highs Set in 2021 |
|---|
| Date | Record | Previous Record |
|---|---|---|
| Feb 2 |
82 - tied record
|
82 in 1925
|
| Apr 3 |
97 - tied record
|
97 in 1943
|
| Apr 4 |
98 - tied record
|
98 in 1961
|
| Jun 15 |
115 - tied record
|
115 in 1974
|
| Jun 16 |
115 - tied record
|
115 in 1974
|
| Jun 17 |
118
|
114 in 2015
|
| Jun 18 | 117 | 115 in 2015 |
| Sep 9 | 111 | 110 in 1990 |
| Dec 1 | 85 | 83 in 1949 |
| Dec 2 | 84 - tied record | 84 in 2017 |
| No Record Lows were set in 2021 |
|---|


Yuma Annual Temperature Rankings (Warmest Years)
|
|
|
|---|
|
|
Avg Max Temp |
Highest
Temp |
Avg Min Temp
|
Lowest Temp
|
Avg Temp
|
Rank (1=Warmest, 144=Coldest)
|
|---|---|---|---|---|---|---|
| Jan |
69.3
|
84 on the 16th
|
47.0
|
40 on the 26th
|
58.1 /-0.7
|
36th
|
| Feb |
74.8
|
83 on the 2nd
|
49.3
|
42 on the 26th
|
62.0 /+0.1
|
37th
|
| Mar |
77.1
|
90 on the 29th
|
49.8
|
40 on the 1st
|
63.5 /-4.1
|
97th
|
| Apr |
90.2
|
101 on the 30th
|
60.1
|
52 on the 27th
|
75.1 / +2.0
|
Tied 18th
|
| May |
95.2
|
101 on the 19th
|
65.5
|
55 on the 22nd
|
80.4 /-0.2
|
Tied 33rd
|
| Jun |
106.6
|
116 on the 15th & 17th
|
78.1
|
67 on the 11th
|
92.4 /+3.3
|
6th
|
| Jul |
106.8
|
113 on the 10th & 29th
|
85.2
|
73 on the 30th
|
96.0 /+1.4
|
Tied 11th
|
| Aug |
105.4
|
117 on the 4th
|
82.5
|
72 on the 22nd
|
93.9 /-0.9
|
Tied 33rd
|
| Sep |
102.3
|
111 on the 13th
|
78.4
|
68 on the 25th
|
90.4 /+0.9
|
Tied 20th
|
| Oct |
87.6
|
98 on the 3rd & 4th
|
62.0
|
52 on the 13th
|
74.8 /-3.2
|
80th
|
| Nov |
84.4
|
92 on the 4th & 5th
|
57.9
|
49 on the 27th & 29th
|
71.2 /+5.1
|
1st
|
| Dec |
70.5
|
85 on the 1st
|
48.7
|
40 on the 16th & 29th
|
59.6 /+2.3
|
Tied 16th
|
(*** click on month for more comprehensive monthly summary ***)
| Record Highs Set in 2021 |
|---|
| Date | Record | Previous Record |
|---|---|---|
| Jan 14 |
81
|
80 in 2000
|
| Jan 15 |
81 - tied record
|
81 in 1943
|
| Jan 16 |
84
|
83 in 1961
|
| Jun 17 | 116 | 115 in 1981 |
| Aug 4 | 117 | 116 in 1995 |
| Nov 30 | 83 - tied record | 83 in 1950 |
| Dec 1 | 85 | 84 in 1949 |
| No Record Lows were set in 2021 |
|---|


El Centro Annual Temperature Rankings (Warmest Years)
|
|
|
|---|
|
|
Avg Max Temp |
Highest
Temp |
Avg Min Temp
|
Lowest Temp
|
Avg Temp
|
Rank (1=Warmest, 96=Coldest)
|
|---|---|---|---|---|---|---|
| Jan |
70.4
|
85 on the 16th
|
41.9
|
35 on the 2nd & 12th
|
56.1 /+0.1
|
34th
|
| Feb |
74.9
|
85 on the 3rd
|
45.0
|
37 on the 19th
|
59.9 /+0.5
|
Tied 34th
|
| Mar |
76.7
|
94 on the 29th
|
47.3
|
37 on the 1st & 2nd
|
62.0 /-3.3
|
70th
|
| Apr |
90.6
|
104 on the 30th
|
57.4
|
47 on the 27th
|
74.0 / +3.1
|
13th
|
| May |
95.7
|
102 on the 19th
|
61.8
|
53 on the 23rd
|
78.7 /-0.5
|
Tied 40th
|
| Jun |
107.4
|
119 on the 17th
|
73.8
|
61 on the 11th
|
90.6 /+3.8
|
3rd
|
| Jul |
108.2
|
116 on the 10th
|
81.7
|
73 on the 3rd & 27th
|
95.0 /+1.9
|
7th
|
| Aug |
107.2
|
119 on the 4th
|
80.1
|
69 on the 22nd
|
93.7 /+0.1
|
Tied 17th
|
| Sep |
102.5
|
112 on the 13th
|
74.9
|
63 on the 30th
|
88.7 /+1.5
|
Tied 14th
|
| Oct |
87.1
|
98 on the 4th
|
58.2
|
47 on the 13th
|
72.6 /-2.6
|
Tied 74th
|
| Nov |
84.1
|
91 on the 4th
|
52.9
|
43 on the 27th
|
68.5 /+5.2
|
2nd
|
| Dec |
70.0
|
85 on the 1st
|
44.9
|
34 on the 18th & 19th
|
57.5 /+2.6
|
15th
|
(*** click on month for more comprehensive monthly summary ***)
| Record Highs Set in 2021 |
|---|
| Date | Record | Previous Record |
|---|---|---|
| Apr 30 |
104 - tied record
|
104 in 1965
|
| Jun 17 |
119
|
115 in 1971
|
| Jun 18 |
118
|
117 in 1936
|
| Aug 3 | 117 | 115 in 2011 |
| Aug 4 | 119 | 118 in 1969 |
| Record Lows Set in 2021 |
|---|
| Date | Record | Previous Record |
|---|---|---|
| May23 |
53
|
5 in 19
|


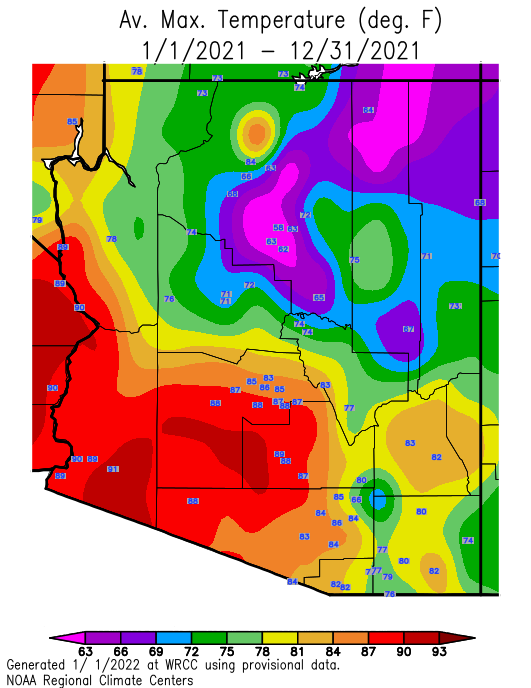
| Arizona Statewide Temperature Maps (Data courtesy of Western Region Climate Center) |
|---|
|
Arizona 2021 Average
Maximum Temperature
 |
Arizona 2021 Maximum Temp Departure from normal
 |
|
Arizona 2021 Average
Minimum Temperature
 |
Arizona 2021 Minimum Temp
Departure from normal
 |
|
Arizona 2021 Average Temperature
 |
Arizona 2021 Average Temp
Departure from normal
 |
| California Statewide Temperature Maps (Data courtesy of Western Region Climate Center) |
|---|
|
California 2021 Average
Maximum Temperature
 |
California 2021 Maximum Temp Departure from normal
 |
|
California 2021 Average
Minimum Temperature
 |
California 2021 Minimum Temp
Departure from normal
 |
|
California 2021 Average Temperature
 |
California 2021 Average Temp
Departure from normal
 |
| 2021 Phoenix Precipitation Statistics |
|---|
| Precip Total | Departure | Rank (1=Wettest, 126=Driest) | |
|---|---|---|---|
| Jan |
0.68
|
-0.19
|
58th
|
| Feb |
Trace
|
-0.87
|
Tied 126th
|
| Mar |
0.37
|
-0.46
|
Tied 76th
|
| Apr |
0.01
|
-0.21
|
93rd
|
| May |
Trace
|
-0.13
|
Tied 126th
|
| Jun |
0.17
|
+0.15
|
Tied 17th
|
| Jul |
1.73
|
+0.82
|
17th
|
| Aug |
1.54
|
+0.61
|
26th
|
| Sep |
0.76
|
+0.19
|
45th
|
| Oct |
0.32
|
-0.24
|
55th
|
| Nov |
Trace
|
-0.57
|
Tied 126th
|
| Dec |
1.53
|
+0.74
|
25th
|
(*** click on month for more comprehensive monthly summary ***)
| Phoenix Record Daily Rainfall for 2021 |
|---|
| Date | Record | Previous Record |
|---|---|---|
| Jul 3 |
0.26
|
0.22 in 1927
|
| Jul 23 | 0.80 | 0.41 in 2002 |
| Dec 24 | 1.00 | 0.93 in 1944 |

| 2021 Yuma Precipitation Statistics |
|---|
| Precip Total | Departure | Rank (1=Wettest, 144=Driest) | |
|---|---|---|---|
| Jan |
1.32
|
+0.93
|
11th
|
| Feb |
0.00
|
-0.38
|
Tied 144th
|
| Mar |
Trace
|
-0.39
|
Tied 144th
|
| Apr |
Trace
|
-0.14
|
Tied 144th
|
| May |
0.00
|
-0.06
|
Tied 144th
|
| Jun |
0.00
|
-0.01
|
Tied 144th
|
| Jul |
0.43
|
+0.19
|
23rd
|
| Aug |
0.38
|
+0.18
|
Tied 43rd
|
| Sep |
Trace |
-0.68 |
Tied 144th |
| Oct |
0.06
|
-0.07
|
Tied 52nd
|
| Nov |
0.00
|
-0.23
|
Tied 144th
|
| Dec |
0.25
|
-0.18
|
64th
|
(*** click on month for more comprehensive monthly summary ***)
| Yuma Record Daily Rainfall for 2021 |
|---|
| Date | Record | Previous Record |
|---|---|---|
| Jan 20 |
1.12
|
0.56 in 1933
|

| 2021 El Centro Precipitation Statistics |
|---|
| Precip Total | Departure | Rank (1=Wettest, 96=Driest) | |
|---|---|---|---|
| Jan |
1.21
|
+0.80
|
8th
|
| Feb |
Trace
|
-0.38
|
Tied 96th
|
| Mar |
Trace
|
-0.29
|
Tied 96th
|
| Apr |
Trace
|
-0.08
|
Tied 96th
|
| May |
0.00
|
-0.07
|
Tied 96th
|
| Jun |
0.00
|
-0.00
|
Tied 96th
|
| Jul |
Trace
|
-0.11
|
Tied 96th
|
| Aug |
0.23
|
+0.08
|
Tied 30th
|
| Sep |
Trace |
-0.08
|
Tied 96th |
| Oct |
Missing
|
Missing
|
Missing
|
| Nov |
Missing
|
Missing
|
Missing
|
| Dec |
Missing
|
Missing
|
Missing
|
(*** click on month for more comprehensive monthly summary ***)
| El Centro Record Daily Rainfall for 2021 |
|---|
| Date | Record | Previous Record |
|---|---|---|
| Jul 2 |
Trace - tied record
|
Trace in 1977
|
| Arizona Statewide Precipitation Maps (Data courtesy of Western Region Climate Center) |
|---|
|
Arizona 2021
Precipitation
 |
Arizona 2021 Precip Departure from normal
 |
Arizona 2021 Precip Percent Normal
 |
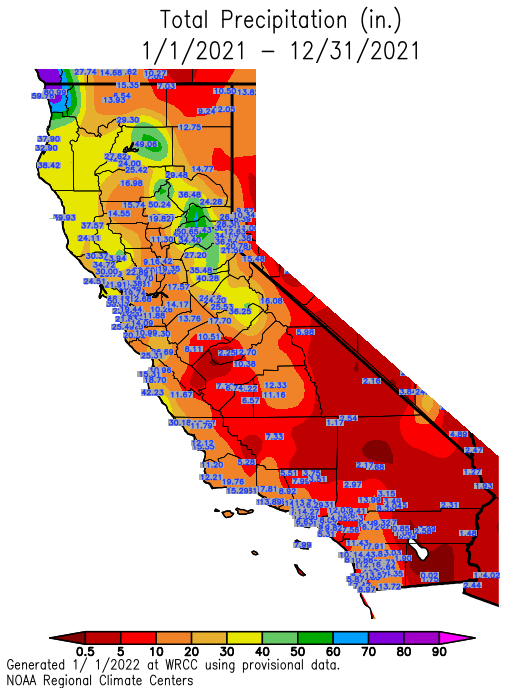
| California Statewide Precipitation Maps (Data courtesy of Western Region Climate Center) |
|---|
|
California 2021
Precipitation
 |
California 2021 Precip Departure from normal
 |
California 2021 Precip Percent Normal
 |
 CLIMATE REPORT
 NATIONAL WEATHER SERVICE PHOENIX AZ
 503 PM MST SAT JAN 1 2022

 ...................................

 ...THE PHOENIX AZ CLIMATE SUMMARY FOR THE YEAR OF 2021...

 CLIMATE NORMAL PERIOD 1991 TO 2020
 CLIMATE RECORD PERIOD 1895 TO 2021

 WEATHER         OBSERVED          NORMAL  DEPART   LAST YEAR`S
                 VALUE   DATE(S)   VALUE   FROM     VALUE
                                           NORMAL
 ..............................................................
 TEMPERATURE (F)
 RECORD
  HIGH            122   06/26/1990
  LOW              16   01/07/1913
 HIGHEST          118   06/17        114       4
 LOWEST            36   01/25         35       1
 AVG. MAXIMUM    88.2               87.1     1.1
 AVG. MINIMUM    64.5               64.1     0.4
 MEAN            76.3               75.6     0.7
 DAYS MAX >= 90   176              173.0     3.0
 DAYS MAX <= 32     0                0.0     0.0
 DAYS MAX >= 100  104
 DAYS MAX >= 110   22
 DAYS MIN <= 32     0                0.6    -0.6
 DAYS MIN <= 0      0                0.0     0.0
 DAYS MIN >= 90     9

 PRECIPITATION (INCHES)
 RECORD
  MAXIMUM       19.73   1905
  MINIMUM        2.82   2002
 TOTALS          7.11               7.22   -0.11
 DAYS >= .01       41               33.4     7.6
 DAYS >= .10       23               17.2     5.8
 DAYS >= .50        3                4.1    -1.1
 DAYS >= 1.00       1                0.9     0.1
 GREATEST
  24 HR. TOTAL   1.01   07/22 TO 07/23
                        12/24 TO 12/25


 DEGREE DAYS
 HEATING TOTAL    678                874    -196
  SINCE 7/1       191                378    -187
 COOLING TOTAL   4932               4765     167
  SINCE 1/1      4932               4764     168
 ..............................................................

 WIND (MPH)
 AVERAGE WIND SPEED              6.5
 HIGHEST GUST SPEED/DIRECTION    69/080    DATE  08/16

 AVERAGE RH (PERCENT)     32

 WEATHER CONDITIONS. NUMBER OF DAYS WITH
 THUNDERSTORM             30     HEAVY RAIN                13
 RAIN                     14     LIGHT RAIN                55
 FOG W/VIS <= 1/4 MILE     0
 CLIMATE REPORT
 NATIONAL WEATHER SERVICE PHOENIX AZ
 503 PM MST SAT JAN 01 2022

 ...................................

 ...THE YUMA AZ CLIMATE SUMMARY FOR THE YEAR OF 2021...

 CLIMATE NORMAL PERIOD 1991 TO 2020
 CLIMATE RECORD PERIOD 1876 TO 2021

 WEATHER         OBSERVED          NORMAL  DEPART   LAST YEAR`S
                 VALUE   DATE(S)   VALUE   FROM     VALUE
                                           NORMAL
 ..............................................................
 TEMPERATURE (F)
 RECORD
  HIGH            124   07/28/1995
  LOW              22   01/24/1937
                        12/26/1911
                        01/20/1883
 HIGHEST          117   08/04        115       2
 LOWEST            40   03/01         36       4
                        12/16
                        12/29
 AVG. MAXIMUM    89.2               88.1     1.1
 AVG. MINIMUM    63.7               63.8    -0.1
 MEAN            76.5               75.9     0.6
 DAYS MAX >= 90   184              181.0     3.0
 DAYS MAX <= 32     0                0.0     0.0
 DAYS MAX >= 100  107
 DAYS MAX >= 110   26
 DAYS MIN <= 32     0                0.1    -0.1
 DAYS MIN <= 0      0                0.0     0.0
 DAYS MIN >= 90     3

 PRECIPITATION (INCHES)
 RECORD
  MAXIMUM       11.41   1905
  MINIMUM        0.03   2002
 TOTALS          2.44               3.28   -0.84
 DAYS >= .01       18               16.6     1.4
 DAYS >= .10        7                7.9    -0.9
 DAYS >= .50        1                1.4    -0.4
 DAYS >= 1.00       1                0.4     0.6
 GREATEST
  24 HR. TOTAL   1.12   01/20 TO 01/20


 DEGREE DAYS
 HEATING TOTAL    567                679    -112
  SINCE 7/1       181                306    -125
 COOLING TOTAL   4859               4705     154
  SINCE 1/1      4859               4704     155
 ..............................................................

 WIND (MPH)
 AVERAGE WIND SPEED              7.3
 HIGHEST GUST SPEED/DIRECTION    50/300    DATE  07/30

 AVERAGE RH (PERCENT)     35

 WEATHER CONDITIONS. NUMBER OF DAYS WITH
 THUNDERSTORM             19     HEAVY RAIN                 3
 RAIN                      5     LIGHT RAIN                22
 FOG W/VIS <= 1/4 MILE     1
 CLIMATE REPORT
 NATIONAL WEATHER SERVICE PHOENIX AZ
 503 PM MST SAT JAN 01 2022

 ...................................

 ...THE IMPERIAL CA CLIMATE SUMMARY FOR THE YEAR OF 2021...

 CLIMATE NORMAL PERIOD 1991 TO 2020
 CLIMATE RECORD PERIOD 1925 TO 2021

 WEATHER         OBSERVED          NORMAL  DEPART   LAST YEAR`S
                 VALUE   DATE(S)   VALUE   FROM     VALUE
                                           NORMAL
 ..............................................................
 TEMPERATURE (F)
 RECORD
  HIGH            122   06/20/2017
  LOW              16   01/22/1937
 HIGHEST          119   06/17        116       3
                        08/04
 LOWEST            34   12/16         31       3
                        12/18
                        12/19
 AVG. MAXIMUM    89.6               88.6     1.0
 AVG. MINIMUM    60.0               58.7     1.3
 MEAN            74.8               73.7     1.1
 DAYS MAX >= 90   180              181.0    -1.0
 DAYS MAX <= 32     0                0.0     0.0
 DAYS MAX >= 100  117
 DAYS MAX >= 110   37
 DAYS MIN <= 32     0                4.1    -4.1
 DAYS MIN <= 0      0                0.0     0.0
 DAYS MIN >= 90     0


 DEGREE DAYS
 HEATING TOTAL    786                966    -180
  SINCE 7/1       253                430    -177
 COOLING TOTAL   4458               4162     296
  SINCE 1/1      4458               4162     296
 ..............................................................

 WIND (MPH)
 AVERAGE WIND SPEED              7.0
 HIGHEST GUST SPEED/DIRECTION    55/270    DATE  12/14

 AVERAGE RH (PERCENT)     38

 WEATHER CONDITIONS. NUMBER OF DAYS WITH
 THUNDERSTORM             11     HEAVY RAIN                 4
 RAIN                      3     LIGHT RAIN                22
 FOG W/VIS <= 1/4 MILE     2

